EthusdIt looks the Ethusd is now forming W4: the last wave of ABC.
I am waiting to break the last support to get a signal W5 of C is done.
Then , we could see the formation of W5 .
ETHUSD.P trade ideas

ETHUSDETHUSD
ETHUSD at the lower support levels,
From here adding volumes on the long side,
With BOUNCBACEK.
This is educational purposes.
Follow for more.
Tune update.
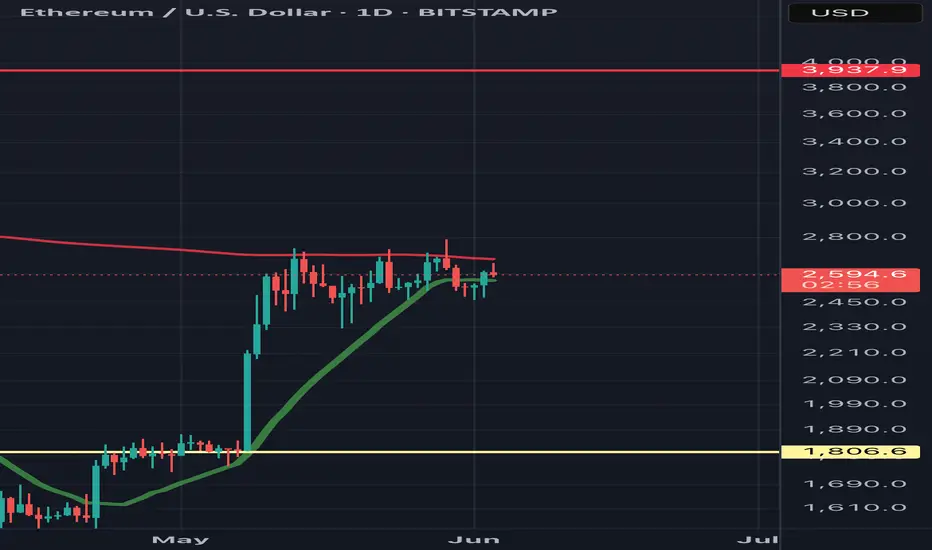
Downside Risk Ahead: ETH Drops Below 20-Day MA
The last few candles show strong red bodies, suggesting selling pressure.
Price has closed below the middle Bollinger Band (20-day moving average), often a trigger point for downside momentum. This suggests a transition from neutral/bullish to bearish momentum.
Recent highs failed to break the previous peak near $2,900. This forms a lower high, indicating weakening buying strength.


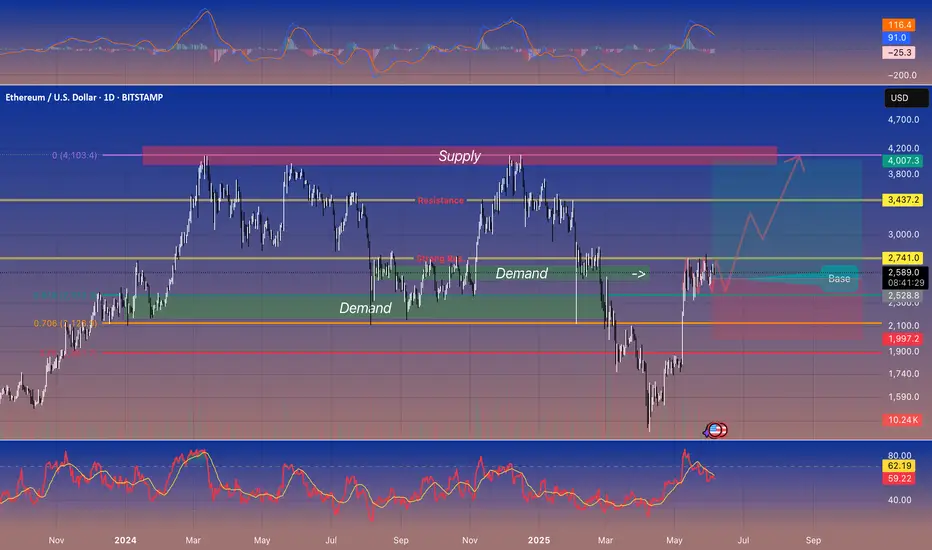
Ethereum (ETHUSD) • Daily • Trading ideaEthereum (ETHUSD) • Daily Chart 🚀
---
🔑 Key Levels
* Demand Zone (Support): \$2,350–2,550
* Price has bounced here twice in the last year.
* Immediate Resistance: \$2,741
* Multiple rejections around this level recently.
* Next Major Resistance: \$3,437
* Former highs in late 2024/early 2025.
* Big Supply Zone (Strong Sell Area): \$4,000–4,200
---
💡 What’s Happening?
* ETH is sitting in a “base” between \$2,528–2,741 (green box).
* If it breaks above \$2,741 on strong volume, it can run toward \$3,437 and eventually \$4,000+.
* If it falls below \$2,528 (demand), the next support is around \$1,997.
---
🎯 Trade Idea
* Bullish Entry: Buy on a daily close above \$2,741 + higher-than-usual volume.
* First Target: \$3,437 (take partial profit).
* Final Target: \$4,000–4,200 (major sell area).
* Stop-Loss: Below \$2,500 (just under support).
* Bearish Scenario:
* If price drops below \$2,528 with big volume, look for a possible move down toward \$1,997.
---
📈 Indicators (Confirmation Only)
* Volume: Watch for a spike on any breakout above \$2,741.
* MACD & RSI: If both are rising (not overbought), it adds confidence—though price and volume matter most.
---
👍 Summary
ETH is coiling in a strong support zone. A clean break above \$2,741 on good volume can send it to \$3,437, then \$4K+. If support fails, \$1,997 is next. Trade with proper stops and watch volume for confirmation.
— Feel free to leave a 🚀 if this helps!
#Ethereum #ETHUSD #Crypto #Support #Resistance #Volume
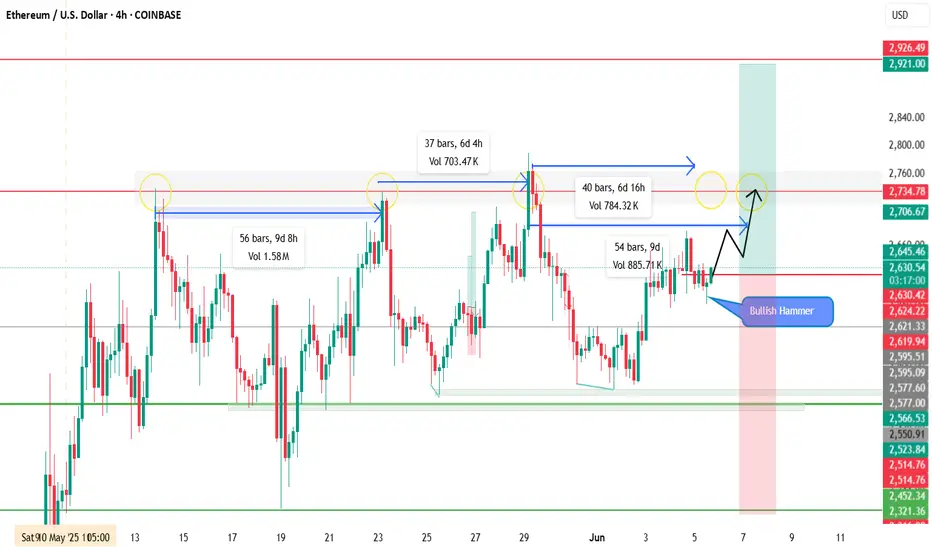
ETHUSDETH is showing signs of a potential resistance retest, echoing previous price behavior. On the 4H chart, historical data suggests ETH typically revisits resistance zones within 6–9 days (±). The pair has been ranging between support and resistance, and a strong bullish hammer has just formed — signaling a potential shift in momentum.
📍 Entry: Market (Instant)
🛑 Stop Loss: 2312
🎯 Take Profit: 2913 (1:1 Risk-Reward)
📊 Plan: Trade aligned with historical timing and price structure. Entering on bullish confirmation.
⚠️ Note: Manage risk accordingly — structure looks promising, but always respect your stop.
Ethereum has reached its bottomKey support trendline should offer spring towards the next bullish wave.

$ETH Broadening Wedge TargetCRYPTOCAP:ETH reached its technical target of $4K from the ascending triangle (Jul '22-Oct '23).
CRYPTOCAP:ETH appears to be back in the multi-year range between $1.9K-$4K.
If the Bull Market continues, the current macro pattern could develop into a flat top broadening wedge with a target of $11.7K.
Invalidation if it fails to break $4K, or falls to Hades.

ETH/USD gearing up for potential breakoutThe ETH/USD has been coiling inside a bullish continuation pattern for several weeks now and a breakout could be on the cards soon. The consolidation suggests ETH is gearing up for a potential breakout soon, as it chips away at resistance coming from the 200-day moving average near $2700.
Further resistance is seen between $2745 to $2855, as shaded in grey on the chart. If it gets through this area of resistance in the coming days, then a big breakout could be on the cards, with the first stop likely around $3,000, but we could go much further than that over time, given the length of the current consolidation.
However, it is essential that the ETH/USD doesn't break the support trend of the consolidation pattern and key support at $2470 now. If it does, then that would invalidate the bullish price structure.
By Fawad Razaqzada, market analyst with FOREX.com

ETH at a Critical Decision Level – $2260Ethereum is currently showing strong price action around the key decision level of $2260. This zone will likely determine the next major move:
A breakout above could trigger a bullish continuation.
A rejection here may send ETH down, possibly all the way toward $1000 in the long term.
📌 Stay tuned — we'll update you as the move unfolds. Keep in touch!

BTC & ETH LONGSliquidity
manipulation
imbalance
mitiation
both coming into POIs at the same time but different zones

ETHUSD tested the Resistance level 2650.00 👀 Possible scenario:
Ether (ETH) rose 7% on June 2, fueling optimism among traders about a potential breakout. The ETH/BTC pair also gained, strengthening recovery prospects. ETH is currently trading near $2,650, up 46% over the past month, and holding above key support. While ETH is still far from its all-time high of $4,891 set in November 2021, its current price stabilization around $2,650 could form a new base. If this level holds, it may pave the way for a renewed push toward higher prices.
Several factors are supporting ETH’s recent gains. Continued inflows into Ethereum-focused ETFs from major issuers like BlackRock and Fidelity indicate growing investor interest. At the same time, a number of companies, including BioNexus Gene Labs and SharpLink Gaming, are building ETH holdings as part of their treasury strategies. In addition, the amount of ETH held on centralized exchanges has declined, suggesting many holders are opting for long-term storage rather than immediate selling.
✅Support and Resistance Levels
Support level is now located at 2,480.00.
Now, the resistance levels are located at 2,650.00 and 2,765.00.


ETHETH continues to hold the line so far
Would love to see us blast off from here
We had enough pain since the year began if more comes this will be the craziest bullrun for alts
Etherium is following the trendas we all noticed that the crypto was retracing its significant keys, going to redefine the new era of crypto currency , etherium stays solid in this erea showing no mitigation. we assume that its bullish following other big crypto like etherium, sol, btc

Ethereum - The most important analysis for 2025!Ethereum - CRYPTO:ETHUSD - is clearly shifting bullish:
(click chart above to see the in depth analysis👆🏻)
After four years of trading, Ethereum is now sitting at the exact same level compared to mid 2021. However, Ethereum has been creating a significant triangle pattern and with the recent bullish price action, a breakout becomes more and more likely. Then, the sky is the limit.
Levels to watch: $4.000
Keep your long term vision!
Philip (BasicTrading)

Ethereum Is Not DEAD ... WHY ??? Because BlackRock Says SoMartyBoots here , I have been trading for 17 years and sharing my thoughts on ETH here.
ETH Is Not Dead — It’s Just Getting Started
Narrative of ETH being “dead” is short-sighted. Here’s why:
1. Ethereum Is Still Younger Than Bitcoin
• Ethereum launched in 2015, a full 6 years after Bitcoin.
• BTC had over a decade of network effect, price discovery, and global trust before ETH even got its first DApp.
• On the charts, ETH still has room to mature, just like Bitcoin did pre-2020.
• Fundamentally, Ethereum is still evolving — from PoW to PoS, scaling solutions (L2s), and now modular chains.
You’re not late to ETH — it’s just halfway through the marathon.
⸻
2. BlackRock’s BUIDL Fund Is a Massive Signal
• The BlackRock BUIDL fund, launched on Ethereum, already has $3B in AUM — and it’s growing.
• It shows that legacy institutions aren’t ignoring ETH — they’re building directly on it.
• This isn’t speculative hype. It’s tokenized real-world assets backed by the biggest asset manager on earth.
• Smart money is moving into ETH, not away from it.
The narrative is shifting. Institutions aren’t betting on meme coins — they’re betting on Ethereum rails.
Final Thought
ETH is not dead. It’s undergoing the same early-stage skepticism BTC did in its early years. With foundational upgrades and institutional validation, ETH might be the most undervalued top asset in the market today.
⸻
Watch the chart. Track the fundamentals. And don’t sleep on ETH.
#Ethereum #ETHUSD #Crypto #fundamentals #BUIDL #BlackRock #OnChainData #NotDead #TradingView
Watch video for more details

Weekly trading plan for EthereumIn this idea I marked the important levels for this week and considered a few scenarios of price performance
RSI is already showing a bearish divergence and therefore it is possible to see a correction before further growth
Write a comment with your coins & hit the like button and I will make an analysis for you
The author's opinion may differ from yours,
Consider your risks.
Wish you successful trades ! mura

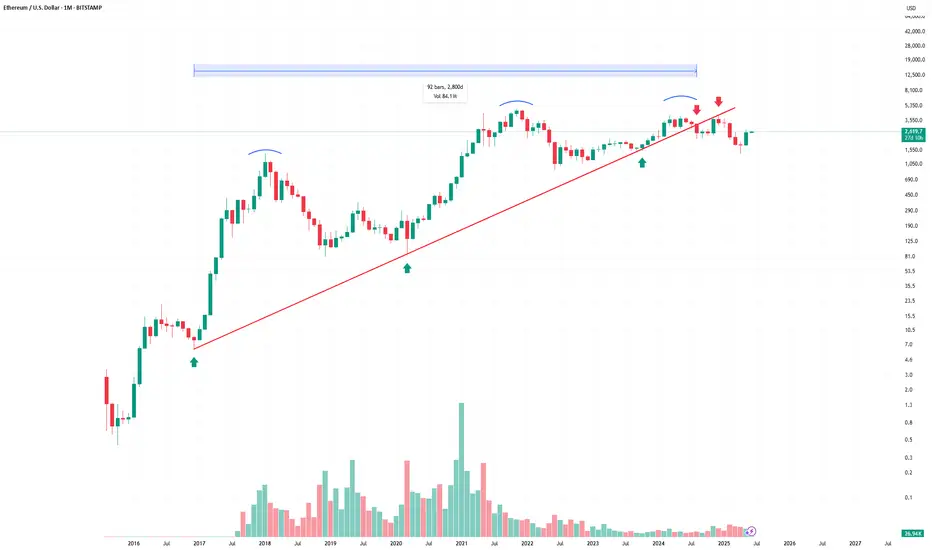
This is why I don't buy Ethereum.This chart shows a clear loss of momentum after a long-term uptrend.
The trendline supported the price for years, confirmed multiple times (green arrows).
Price broke below the trendline and failed to reclaim it (red arrows = rejection).
We're seeing a potential triple top pattern with lower highs (blue curves), a classic distribution signal.
📉 Last candle confirms breakdown structure — lower highs, and now lower lows.
I'm not saying ETH is dead.
But for me, this is not a buy.
Until it reclaims the trendline or shows true strength with a breakout and volume, I'm staying out.
Thanks For Reading.

Is Ethereum ready for a higher high?CRYPTO:ETHUSD seems to be the only one, from the top cryptos, wit the best technical set-up, at the moment. Let's dig in.
CME:ETH1!
Let us know what you think in the comments below.
Thank you.
77.3% of retail investor accounts lose money when trading CFDs with this provider. You should consider whether you understand how CFDs work and whether you can afford to take the high risk of losing your money. Past performance is not necessarily indicative of future results. The value of investments may fall as well as rise and the investor may not get back the amount initially invested. This content is not intended for nor applicable to residents of the UK. Cryptocurrency CFDs and spread bets are restricted in the UK for all retail clients.

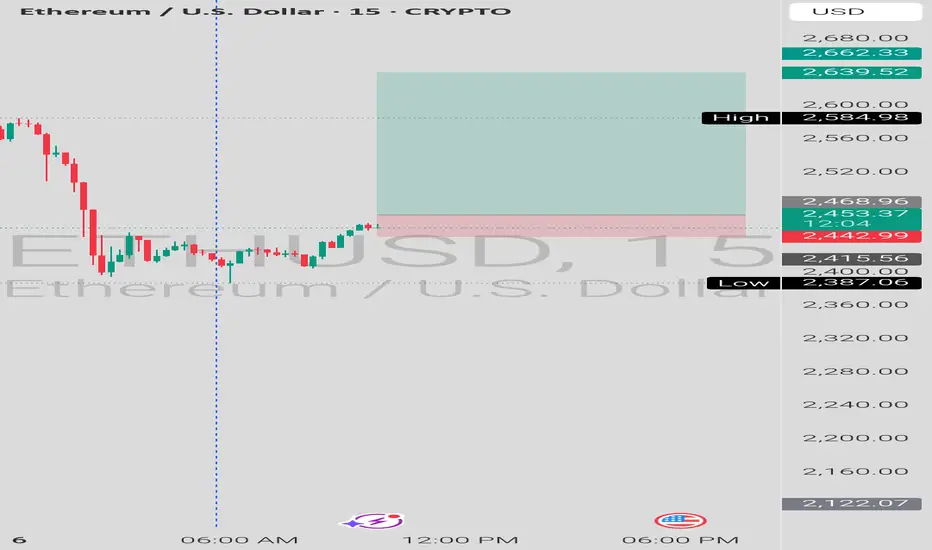
ETH short trade idea (30 min chart)Short Entry: 2584
Stop-Loss: 2630
Take-Profit: 2478
Risk/Reward: 2.3 / 1

My Market Review for the week 03/06/2025 (Tuesday)Staying bearish for now.
Let me know your thoughts and ideas and of any other pairs you would like me to look at
