Ethereum H4 | Overlap support at 23.6% Fibonacci retracementEthereum (ETH/USD) is falling towards an overlap support and could potentially bounce off this level to climb higher.
Buy entry is at 2,455.05 which is an overlap support that aligns close to the 23.6% Fibonacci retracement.
Stop loss is at 2,250.00 which is a level that lies underneath an overlap support.
Take profit is at 2,846.25 which is a multi-swing-high resistance.
High Risk Investment Warning
Trading Forex/CFDs on margin carries a high level of risk and may not be suitable for all investors. Leverage can work against you.
Stratos Markets Limited (tradu.com):
CFDs are complex instruments and come with a high risk of losing money rapidly due to leverage. 63% of retail investor accounts lose money when trading CFDs with this provider. You should consider whether you understand how CFDs work and whether you can afford to take the high risk of losing your money.
Stratos Europe Ltd (tradu.com):
CFDs are complex instruments and come with a high risk of losing money rapidly due to leverage. 63% of retail investor accounts lose money when trading CFDs with this provider. You should consider whether you understand how CFDs work and whether you can afford to take the high risk of losing your money.
Stratos Global LLC (tradu.com):
Losses can exceed deposits.
Please be advised that the information presented on TradingView is provided to Tradu (‘Company’, ‘we’) by a third-party provider (‘TFA Global Pte Ltd’). Please be reminded that you are solely responsible for the trading decisions on your account. There is a very high degree of risk involved in trading. Any information and/or content is intended entirely for research, educational and informational purposes only and does not constitute investment or consultation advice or investment strategy. The information is not tailored to the investment needs of any specific person and therefore does not involve a consideration of any of the investment objectives, financial situation or needs of any viewer that may receive it. Kindly also note that past performance is not a reliable indicator of future results. Actual results may differ materially from those anticipated in forward-looking or past performance statements. We assume no liability as to the accuracy or completeness of any of the information and/or content provided herein and the Company cannot be held responsible for any omission, mistake nor for any loss or damage including without limitation to any loss of profit which may arise from reliance on any information supplied by TFA Global Pte Ltd.
The speaker(s) is neither an employee, agent nor representative of Tradu and is therefore acting independently. The opinions given are their own, constitute general market commentary, and do not constitute the opinion or advice of Tradu or any form of personal or investment advice. Tradu neither endorses nor guarantees offerings of third-party speakers, nor is Tradu responsible for the content, veracity or opinions of third-party speakers, presenters or participants.
ETHUSD.P trade ideas

ETHEREUM (ETHUSD): Retest of $3000 Soon!Ethereum has successfully violated and closed above a significant daily horizontal resistance level.
The bullish momentum appears to be ongoing, and the price is likely to soon test the psychological level of $3000 mark.
Following this test, a breakout is expected, potentially driving prices to new heights.

ETHEREUM, the big catch-up has finally begun!Introduction: In our previous TradingView analyses, we defended the bullish recovery of the crypto market since the beginning of April, particularly for the bitcoin price. The latter seems to be positively correlated with the global liquidity trend (you can reread all our latest crypto analyses in our analysis history directly from the main page of our TradingView profile).
In this new analysis, we discuss the return of Ethereum's outperformance of Bitcoin.
1) ETH/USD bullish cycle: what are the theoretical price targets highlighted by technical analysis of the financial markets?
The current bullish cycle for ETH/USD began in the summer of 2022, with prices rebounding from the all-time high of the penultimate cycle, which peaked at $1150 in January 2018. A chartist base for a bullish reversal had developed between July and November 2022, before the uptrend began shortly after the FTX bankruptcy.
A well-constructed uptrend then took place until March 2024, with an intermediate high reached at $4,000, a resistance that three times produced a bearish rejection effect. The ETH/USD rate finally rallied back above major support at $1150/1350 and now appears to have resumed a bullish bottom trajectory in alignment with the bitcoin price.
2) Ethereum VS Bitcoin, the great catch-up may have begun
The question investors are now asking is whether or not Ethereum is in a position to outperform bitcoin in the coming weeks. To answer this question, we need to look at both fundamental and technical aspects.
On the fundamental level, the very recent “Pectra” update considerably improves the functioning of the Ethereum blockchain, notably by reducing transaction costs. This update could be the fundamental element underpinning a return to Ethereum's outperformance of Bitcoin.
In terms of technical analysis, it is the ETH/BTC ratio that helps determine Ethereum's cycles of outperformance and underperformance against Bitcoin. Technical analysis of the ETH/BTC ratio highlights the presence of long-term chart support, which seems to have enabled a clear rebound in the ETH/BTC rate.
Consequently, if this major support remains preserved over the coming weeks, then yes, it's becoming increasingly likely that ETH/USD will do better than BTC/USD over the next few weeks on the crypto-currency market. This market view would be invalidated in the event of a breakout of the major support mentioned and which is represented on the chart below.
DISCLAIMER:
This content is intended for individuals who are familiar with financial markets and instruments and is for information purposes only. The presented idea (including market commentary, market data and observations) is not a work product of any research department of Swissquote or its affiliates. This material is intended to highlight market action and does not constitute investment, legal or tax advice. If you are a retail investor or lack experience in trading complex financial products, it is advisable to seek professional advice from licensed advisor before making any financial decisions.
This content is not intended to manipulate the market or encourage any specific financial behavior.
Swissquote makes no representation or warranty as to the quality, completeness, accuracy, comprehensiveness or non-infringement of such content. The views expressed are those of the consultant and are provided for educational purposes only. Any information provided relating to a product or market should not be construed as recommending an investment strategy or transaction. Past performance is not a guarantee of future results.
Swissquote and its employees and representatives shall in no event be held liable for any damages or losses arising directly or indirectly from decisions made on the basis of this content.
The use of any third-party brands or trademarks is for information only and does not imply endorsement by Swissquote, or that the trademark owner has authorised Swissquote to promote its products or services.
Swissquote is the marketing brand for the activities of Swissquote Bank Ltd (Switzerland) regulated by FINMA, Swissquote Capital Markets Limited regulated by CySEC (Cyprus), Swissquote Bank Europe SA (Luxembourg) regulated by the CSSF, Swissquote Ltd (UK) regulated by the FCA, Swissquote Financial Services (Malta) Ltd regulated by the Malta Financial Services Authority, Swissquote MEA Ltd. (UAE) regulated by the Dubai Financial Services Authority, Swissquote Pte Ltd (Singapore) regulated by the Monetary Authority of Singapore, Swissquote Asia Limited (Hong Kong) licensed by the Hong Kong Securities and Futures Commission (SFC) and Swissquote South Africa (Pty) Ltd supervised by the FSCA.
Products and services of Swissquote are only intended for those permitted to receive them under local law.
All investments carry a degree of risk. The risk of loss in trading or holding financial instruments can be substantial. The value of financial instruments, including but not limited to stocks, bonds, cryptocurrencies, and other assets, can fluctuate both upwards and downwards. There is a significant risk of financial loss when buying, selling, holding, staking, or investing in these instruments. SQBE makes no recommendations regarding any specific investment, transaction, or the use of any particular investment strategy.
CFDs are complex instruments and come with a high risk of losing money rapidly due to leverage. The vast majority of retail client accounts suffer capital losses when trading in CFDs. You should consider whether you understand how CFDs work and whether you can afford to take the high risk of losing your money.
Digital Assets are unregulated in most countries and consumer protection rules may not apply. As highly volatile speculative investments, Digital Assets are not suitable for investors without a high-risk tolerance. Make sure you understand each Digital Asset before you trade.
Cryptocurrencies are not considered legal tender in some jurisdictions and are subject to regulatory uncertainties.
The use of Internet-based systems can involve high risks, including, but not limited to, fraud, cyber-attacks, network and communication failures, as well as identity theft and phishing attacks related to crypto-assets.

EthusdtThis move from the lows has been incredibly strong
Probably test the highs in coming months..
Successful pectra upgrade
Might see aths

ETHWonder will Eth catch back up to the last cycle.Getting tricky here at this point sure after this FED meeting we will see a clear picture of price action.
ETH Testing Red Resistance – Breakout Potential!🚀 CRYPTOCAP:ETH Testing Red Resistance – Breakout Potential! 📈
CRYPTOCAP:ETH is currently testing the red resistance zone. If the price breaks through, the first target could be the green line level! 📊
Let’s watch this breakout unfold! 💼💸

ETHEREUM SWING SHORT|
✅ETHERUM went up by 76%
In just 3 weeks so the coin is
Overbought, therefore, despite
Or overall very bullish bias on
Crypto mid-term we will be
Expecting a local correction
From the wide horizontal
Resistance above around 2900$
SHORT🔥
✅Like and subscribe to never miss a new idea!✅
Disclosure: I am part of Trade Nation's Influencer program and receive a monthly fee for using their TradingView charts in my analysis.

Long-term Perspective on ETH/USDHello,
The ETH/USD pair has recently caught my attention as the price has been forming within an ascending triangle setup. This pattern is usually considered a bullish signal, however, it's crucial to pay attention to the resistance and immediate support of the pattern to anticipate where the breakout may occur.
The ascending triangle's resistance and support are the two main areas to watch. If the price breaks above the resistance (the flat top of the triangle), we could see a significant bullish move, with the major supply zone being the crucial resistance to look out for. Conversely, the immediate support is the upwardly sloping line formed by rising troughs. If price breaks this trendline, it would indicate that bears have gained control.
It's worth noting the significance of Support Level 3. I consider this a 'dangerous' level of support, as a break below could potentially trigger a drop towards the $360 price point, a strong demand zone. However, I'm skeptical about this bearish scenario happening soon.
Please remember that the targets for both bullish and bearish scenarios are shown on the chart and these scenarios are based on the assumption of the price breaking out of the triangle.
While my analysis is currently leaning towards a bullish breakout given the ascending triangle pattern, I will be providing intermediate updates as the market develops. It's important to remember that this is a long-term market perspective and that crypto markets can be highly volatile and unpredictable.
As always, please consider this analysis as part of your own research and trading strategy. Stay tuned for updates and remember, trade smartly!


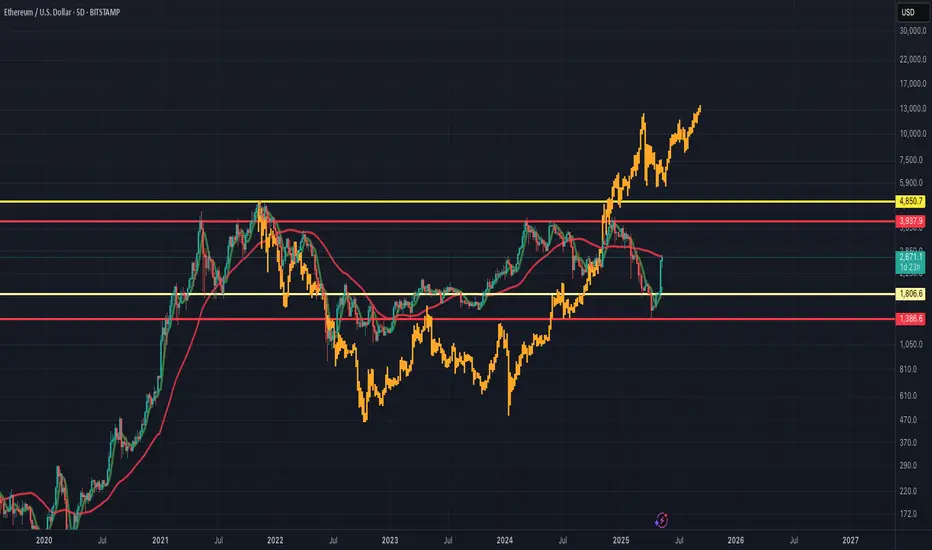
Ethereum: Range Intact, Trendline Broken – What’s Next?Ethereum just bounced hard off the $1,400–$1,500 range low, a level that's been key support since mid-2022. While that bounce looks strong, let’s not ignore the macro picture.
ETH remains trapped in a multi-year range between ~$1,400 and ~$4,800. More importantly, it recently broke below the rising trendline that had been intact since the June 2022 lows. That’s a structural shift. Unless bulls reclaim $2,800–$3,000 cleanly and turn that region into support, this move is just a reaction inside a broader sideways chop.
A push above $3K could trigger momentum toward the upper range, but rejection here? That sets up another sweep of the lows. Range rules apply until proven otherwise.

ETHUSD Multi Time Frame Trend Analysis, Profit Surging InsightsDaily Chart (1D) Overview
The daily chart reflects a powerful bullish breakout, where ETHUSD surged past prior resistance levels, now potentially turning into support. Key observations:
Support Zones:
The $2,300 to $2,400 zone has emerged as a strong demand area. This zone was previously resistance and has now flipped into support after the breakout.
A deeper retracement could potentially revisit the $1,750 to $1,850 demand area, though that would suggest a breakdown of current bullish momentum.
Resistance Zones:
The price is currently testing minor resistance around $2,600 and $2,650, with historical supply and reaction zones visible from previous consolidation.
A broader supply zone exists between $2,800 to $3,400, marked in red, which could be the next major target area if the bulls maintain momentum.
Structure:
ETH formed a higher low in late April followed by a higher high in early May, confirming a trend reversal from the earlier bearish structure.
The clean breakout from consolidation signals a fresh bullish leg, with increasing volume and momentum indicators likely aligning with upward bias.
Trend Direction: Bullish on both Daily and 4H
✅ Market Structure: Higher highs and higher lows
✅ Key Short-Term Support: $2,350 to $2,450
✅ Key Resistance Zones: $2,620 to $2,650 → $2,800 → $3,400
✅ Upside Targets:
1. Short-Term: $2,650 → $2,800
2. Medium-Term: $3,400 → $4,108
✅ Potential Retracement Levels:
3. Shallow: $2,420
4. Deeper: $2,200 and $1,850
If the price holds above $2,400, the bullish outlook remains intact, with increasing likelihood of testing higher resistance levels. However, a sustained move below $2,300 could trigger deeper retracements.

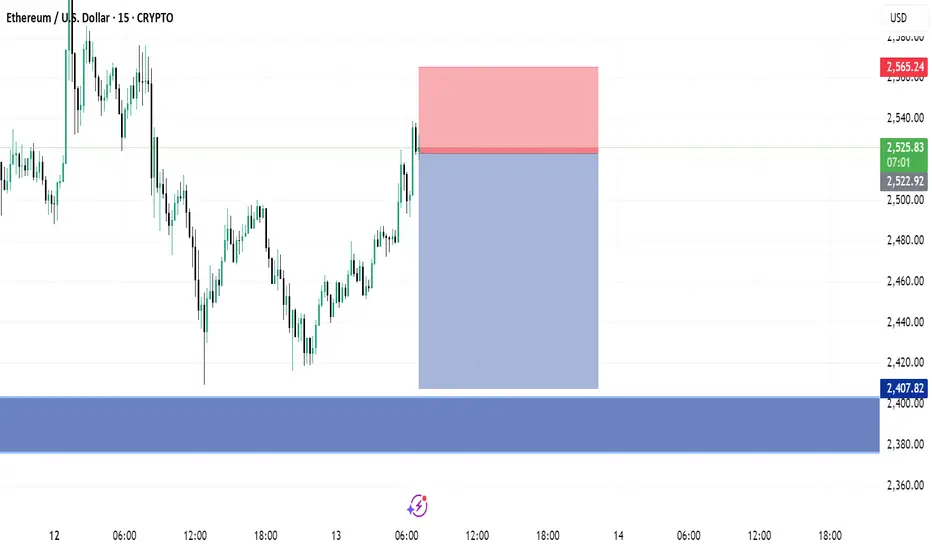
Ethereum Hits Supply Zone – Will the Rally Fade or Continue?Ethereum just tapped into a highly reactive supply zone at $2,550 – $2,565 after a sharp rally. Price has stalled, showing signs of resistance.
Technical Breakdown:
Supply Zone: $2,550–$2,565 (institutional selling zone)
Key Support 1: $2,099 – recent breakout base
Demand Zone: $1,584 – $1,650 (strong accumulation zone)
Market Context:
ETH has surged over 20%+ in the past few days with strong bullish momentum.
Price is now consolidating within a low-volume area, often a signal of distribution.
Multiple U.S. economic events ahead could trigger volatility – stay alert!
Trade Ideas:
Scenario A (Rejection): Bearish confirmation below $2,500 opens the way to $2,099.
Scenario B (Breakout): A 4H candle close above $2,570 with strong volume could signal a continuation towards $2,800.
Bonus Insight:
RSI is overbought on the 4H, so a pullback is likely before continuation.
Watch the next 3 red calendar icons – they often drive fakeouts or breakout traps.
Your Turn: What’s your ETH outlook?
Bullish or Bearish from here? Drop your vote in the comments!

Ethereum with a signature sauce of classic technical analysisGood evening, anonymous trader! COINBASE:ETHUSD
Tonight for dinner, we’ll serve Ethereum with a signature sauce of classic technical analysis. So, on the 4-hour timeframe, we have the ETH/USD pair (Coinbase).
At the moment, we’re observing the completion of the "Flag" pattern formation with a breakout of its diagonal resistance at the $2531 level. A successful price consolidation above this level and active movement toward the target will confirm the correct classification of the chart pattern.
A move into the pattern’s range, specifically a drop with a break below the key support at $2496, could disrupt the short-term bullish sentiment on the 4-hour timeframe.
ETH/ BTC

Ethereum: From Double Bottom to Bullish Flag — Phase 2In my () I outlined a classic double bottom with bullish divergence on the daily chart —
Ethereum followed the structure precisely and triggered a clean breakout.
✅ Now What?
The first impulse is already behind us.
Historically, after a double bottom breakout, price often enters a bullish continuation phase — most commonly forming a rising flag.
🟩 The flagpole (impulse) is already in place
🔄 Next: accumulation inside a potential range of $2,100–$2,700
This range could play out through late May into early summer — forming the base for a new leg higher.
🧠 Macro Catalysts:
If labor data and inflation slow down, the Fed may cut rates as early as Q3 —
which could act as a spark for renewed momentum.
And beyond price:
Ethereum is the most actively used blockchain — by dApps, DeFi, and daily transaction load.
The demand is real, and it’s growing.
🎯 Price Path:
- Consolidation between $2,100–$2,700 = healthy
- Breakout above $2,800 = measured move toward $4000-6000
As long as the range holds and volume builds — the roadmap remains valid.
📊 Are you tracking this flag too?
Drop your scenario in the comments — let’s compare setups and levels.

ETH is moving within the 2,300.00 - 2,600.00 range👀 Possible scenario:
Ethereum has surged over 50% in the past month, breaking above $2,400 for the first time since March and outpacing Bitcoin’s gains. Analysts are calling it the top crypto to watch, fueled by renewed investor confidence and strong on-chain activity. Currently trading near $2,500, ETH is benefiting from renewed market confidence and strong on-chain activity. Data from CryptoQuant shows stakers are back in profit, signaling increased confidence in Ethereum’s long-term outlook and network stability.
Ethereum remains the foundation for real-world applications and stablecoins, and is the only altcoin legally classified as a commodity—boosting institutional trust. A potential pause in the Fed’s tightening later this year could provide an additional boost to ETH’s rally. With growing momentum and increased staking, Ethereum is steadily closing in on its all-time high of $4,878.
✅ Support and Resistance Levels
Support level is now located at 2,300.00.
Now, the resistance level is located at 2,600.00.

Bear market confirmation - ETH up to 4000$ was altcoin seasonBear market confirmation - ETH up to 4000$ was altcoin season
You should consider this seriously now.
ETH can end up to 800$ or 600$

ethereum towards + $10kETH towards + $10K
Ethereum’s Journey to + $10k Successfully Completes Major Milestone with PECTRA Update

Ethereum Flash Crash 2.0? Phase 4 May Trigger a -90% DumpMost traders forget:
🔙 On June 19, 2017, ETH suffered a flash crash dropping 98% in minutes — from over $300 to as low as $0.10 on some exchanges.
That kind of volatility wasn’t a glitch — it was a liquidity event engineered during peak optimism.
Now in 2025, we're setting up for something eerily familiar…
🔄 4-Phase Macro Structure Repeats:
Phase 1: Initial high
Phase 2: Breakout bait
Phase 3: Final high – Exit Liquidity
Phase 4: Return to prior supply before collapse
This pattern played out exactly during the 2021–2022 cycle, leading to a 75% markdown.
We are now entering Phase 4 again — just like the final trap zone from the previous cycle.
💥 If history rhymes, the next move could be a flash crash event, flushing price down as much as -90%, potentially toward the $400–$600 zone, especially with imbalances still unfilled near prior opens.
This is not hopium or FUD — just objective analysis based on structure, past behavior, and liquidity mechanics.
🧠 Smart money never sells into weakness — they sell into strength.
Right now, ETH is trading at strength… again.
💬 What do you think — could a flash crash repeat in today's more liquid markets? Or is that a relic of the past?
#ETH #Ethereum #FlashCrash #ExitLiquidity #SmartMoney #CryptoCrash #MacroStructure #TradingViewAnalysis

ETH SHORT IDEA.ETH SHORT IDEA.
eth will take good downside to form higher low on daily timeframe so trying to catch the pull back.
MOREover daily rsi oversold , 4hr rsi bearish divergence.

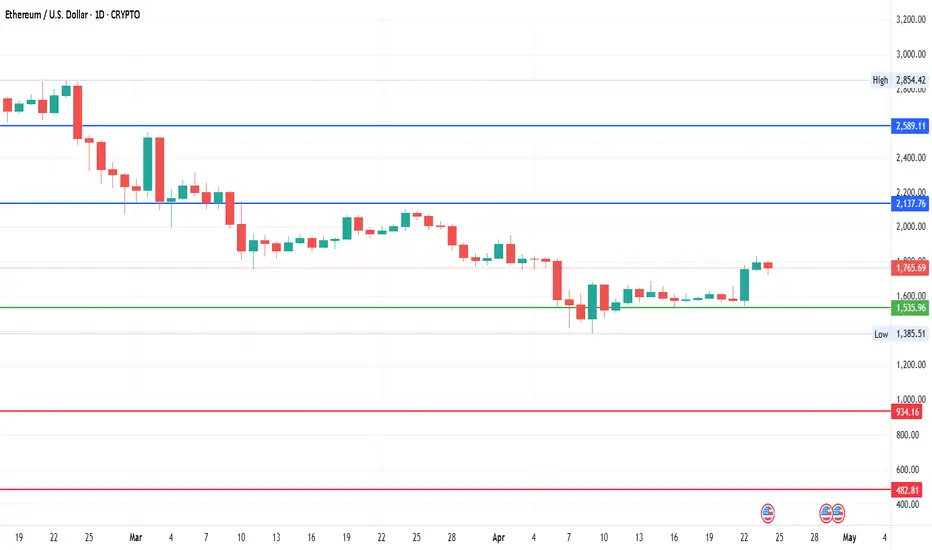
Ethereum - Looking GoodCurrent Price: 1772
Mid-point: 1535.96
Upside: 2137.76 & 2589.11
Downside: 934.16 & 482.81
Resistance: 1693.34 (It's already above this level at the time of posting).
Support: 1378.58
Weekly trading plan for EthereumIn this idea I marked the important levels for this week and considered a few scenarios of price performance
I forgot to inform you that divergences are already visible on the hourly TF, so we may see a local correction to the $2,200-$2,300 zone
Write a comment with your coins & hit the like button and I will make an analysis for you
The author's opinion may differ from yours,
Consider your risks.
Wish you successful trades ! mura

How to manage an entry in AvaxA few days ago we covered an entry in AVAX. The entry was triggered, and in this video we show how the stop could have been managed and what to watch next.
This content is not directed to residents of the EU or UK. Any opinions, news, research, analyses, prices or other information contained on this website is provided as general market commentary and does not constitute investment advice. ThinkMarkets will not accept liability for any loss or damage including, without limitation, to any loss of profit which may arise directly or indirectly from use of or reliance on such information.
