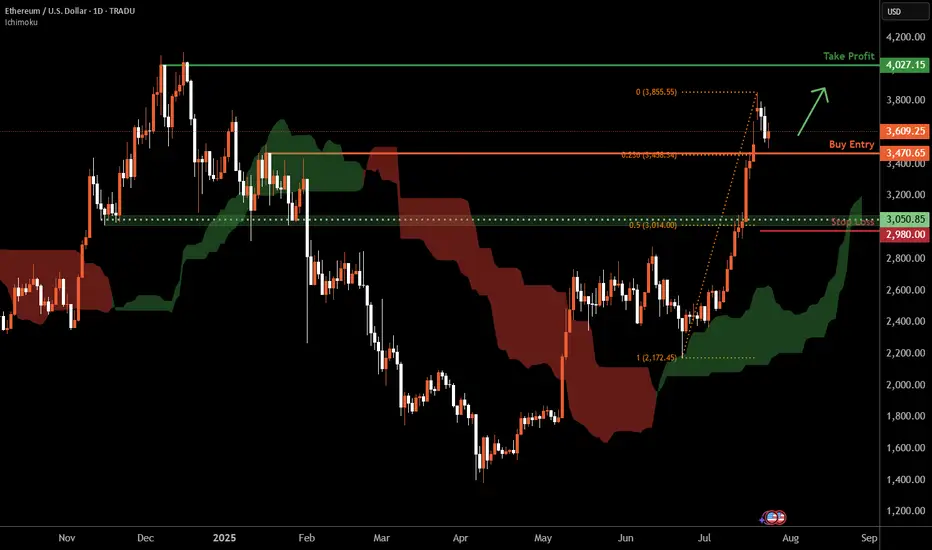
Ethereum D1 | Bullish uptrend to extend higher?Ethereum (ETH/USD) is falling towards a pullback support and could potentially bounce off this level to climb higher.
Buy entry is at 3,470.65 which is a pullback support that aligns with the 23.6% Fibonacci retracement.
Stop loss is at 2,980.00 which is a level that lies underneath a pullback support and the 50% Fibonacci retracement.
Take profit is at 4,027.15 which is a multi-swing-high resistance.
High Risk Investment Warning
Trading Forex/CFDs on margin carries a high level of risk and may not be suitable for all investors. Leverage can work against you.
Stratos Markets Limited (tradu.com ):
CFDs are complex instruments and come with a high risk of losing money rapidly due to leverage. 66% of retail investor accounts lose money when trading CFDs with this provider. You should consider whether you understand how CFDs work and whether you can afford to take the high risk of losing your money.
Stratos Europe Ltd (tradu.com ):
CFDs are complex instruments and come with a high risk of losing money rapidly due to leverage. 66% of retail investor accounts lose money when trading CFDs with this provider. You should consider whether you understand how CFDs work and whether you can afford to take the high risk of losing your money.
Stratos Global LLC (tradu.com ):
Losses can exceed deposits.
Please be advised that the information presented on TradingView is provided to Tradu (‘Company’, ‘we’) by a third-party provider (‘TFA Global Pte Ltd’). Please be reminded that you are solely responsible for the trading decisions on your account. There is a very high degree of risk involved in trading. Any information and/or content is intended entirely for research, educational and informational purposes only and does not constitute investment or consultation advice or investment strategy. The information is not tailored to the investment needs of any specific person and therefore does not involve a consideration of any of the investment objectives, financial situation or needs of any viewer that may receive it. Kindly also note that past performance is not a reliable indicator of future results. Actual results may differ materially from those anticipated in forward-looking or past performance statements. We assume no liability as to the accuracy or completeness of any of the information and/or content provided herein and the Company cannot be held responsible for any omission, mistake nor for any loss or damage including without limitation to any loss of profit which may arise from reliance on any information supplied by TFA Global Pte Ltd.
The speaker(s) is neither an employee, agent nor representative of Tradu and is therefore acting independently. The opinions given are their own, constitute general market commentary, and do not constitute the opinion or advice of Tradu or any form of personal or investment advice. Tradu neither endorses nor guarantees offerings of third-party speakers, nor is Tradu responsible for the content, veracity or opinions of third-party speakers, presenters or participants.
ETHUSD.P trade ideas
ETHUSD (15m) – Precision Pullback Anticipated Before Final Expan📈 ETHUSD (15m) – Precision Pullback Anticipated Before Final Expansion
VolanX Protocol: Synthetic Capital Deployment Phase II
🗓️ July 20, 2025 | ETH @ $3,776
🚨 Market Intelligence Snapshot:
"Structure delivered. Liquidity engineered. Expansion phase in effect."
🔍 Current Readings:
🟥 Weak High tapped at $3,817
📈 Regression Line intact, favoring bullish continuation
📊 Premium zone reached – expect pullback to equilibrium before next leg up
💼 Protocol Alignment – VolanX:
Synthetic Block Order cluster from $3,701 to $3,629 (blue & yellow mitigation zones)
Reversal Potential Zone (RPZ) aligned with 0.618–0.786 retracement of latest impulse
Volume Surge at break of falling wedge confirms breakout strength
Choch → BOS Sequencing validated with structural integrity
📌 Projected Moves:
📉 Pullback into Equilibrium ($3,700–$3,629)
📈 Expansion targets:
$3,883 (1.236)
$3,989 (1.618)
Final: $4,210 (2.414) – profit booking zone
🧬 Status: Synthetic capital locked and deployed
🕒 Next Watch: Rejection or acceptance at 0.618–0.786 FIB zone
🛡️ “Discount fuels premium. Wait for precision, not permission.”
#ETHUSD #VolanX #SyntheticDeployment #SmartMoneyConcepts #LiquidityGrab #FVG #PriceAction #AlgoDrivenTrading #WaveAnalysis #ETH

ETH/USD Short Setup – Bearish Opportunity Amid Bullish RSI DiverLooking to short Ethereum at current levels as price action shows bullish RSI divergence at the top, signaling potential exhaustion of the uptrend.
Trade Plan:
Sell Stop: 3,680
Stop Loss: 3,865
Take Profit 1: 3,495
Take Profit 2: 3,310
This setup aims to capitalize on a potential reversal as momentum weakens. Managing risk carefully with a well-placed SL above the recent high.
🔍 Watching closely for confirmation — a break below 3,680 would validate entry.
#ETHUSD #CryptoTrading #ShortSetup #TechnicalAnalysis #RSIDivergence

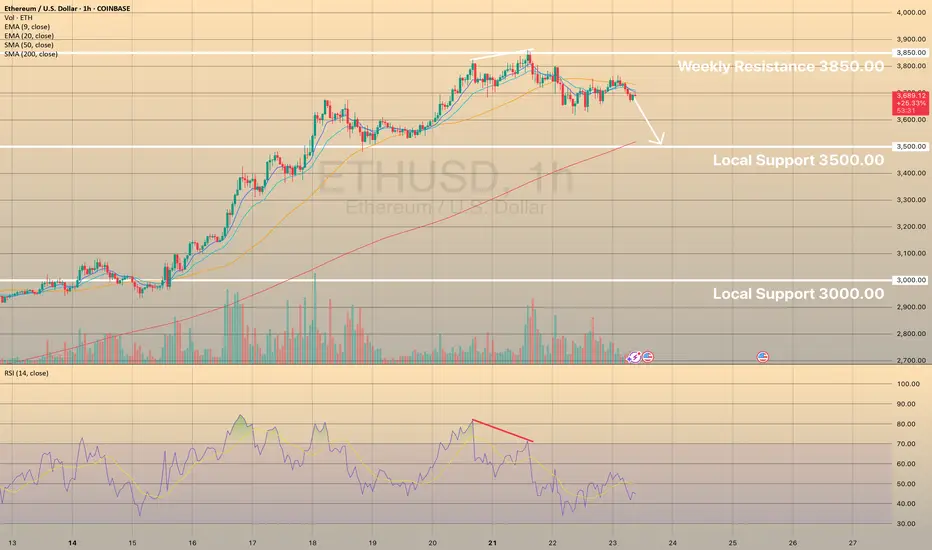
ETHUSD SEEMS TO RETEST SUPPORT LEVEL OF 3,500.00ETHUSD SEEMS TO RETEST SUPPORT LEVEL OF 3,500.00
The ETHUSD has hit some resistance at around 3,850.00 this week. But it's since pulled back from that level, which might be a sign of a cooling trend. That's backed up by the RSI going bearish.
Right now, the price is below the 50 SMA on the 1-hour chart, indicating a mid-term downtrend.
We could see the price find some support at 3500.00 or so. Additionally the SMA 200 lays nearby, providing extra support here.
ETHUSD heading towards the top of the D1 frame✏️ CRYPTO:ETHUSD is in a strong uptrend towards the resistance zone of the 3800 daily frame. There are not many conditions for the sellers to jump in and reverse the current trend. Wait for the price reaction at the resistance of the D1 frame to consider the SELL strategy. Because currently if BUY is too Fomo.
📉 Key Levels
Sell trigger: Rejection from 3800
Target 3400, potentially 3,380
Leave your comments on the idea. I am happy to read your views.

ETH BUY SETUP ,Bought From $3720ETH BUY SETUP
Currently $3720
Bought From $3720
(Trading plan If ETH go down
to $3630 will add more longs)
Expecting target $3830 OR ABOVE
In the event of an early exit,
this analysis will be updated.
Its not a Financial advice

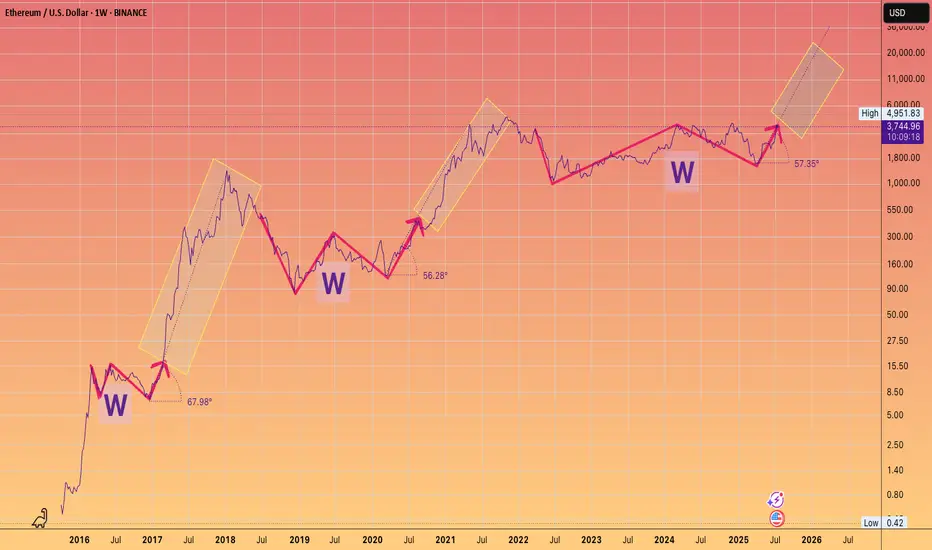
3 Wins to Glory.You guys know my long term Targets for ETH.
What I wanted to highlight is the angle of the Banana zone has been remarkably consistent on the Log chart.
Granted we only have 2 - 2.5 data points
But note how even in 2025 the run is adhering to the approx 60 degree angle of attack, after breaking out of their respective W's.
something to monitor.
ETHUSD-SELL strategy 12 hourly chart REG CHANNELAs always crypto movements are severe, and one can never judge the corrective timings. Overall the view remains the same, and when carefully scaling in, is always warrented and proper risk management strategies.
Strategy SELL @ $ 3,675-3,750 area and take profit @ $ 3,175 area. On previous shorts if applicable, scale down slowly.


$Ethereum / USD 4H AnalysisMARKETSCOM:ETHEREUM / USD 4H Analysis
ETH has shown a massive rally of +82.5%, climbing from the $1,900 area to a local high of ~$3,670.
🔑 Key Levels & Zones:
🔹 Resistance Zone:
~$3,750–$3,800 Price is reacting here after a strong bullish move. Potential local top if no breakout follows.
🔹 First Demand Zone:
~$3,500 Nearest 4H demand zone. A possible area for a short-term bounce or continuation if price retraces.
🔹 Mid-Level Demand Zone:
~$2,950 Previous consolidation zone, now flipped into support. Stronger structure here.
🔹 Deep Support Zone:
~$2,530 Major support in case of a deep correction. Confluence with previous breakout zone and unfilled demand.
🧠 After an 82% run, ETH might enter a short-term distribution or pullback phase. Eyes on how it reacts around $3,500. If that level holds continuation possible. If not expect deeper retracement.

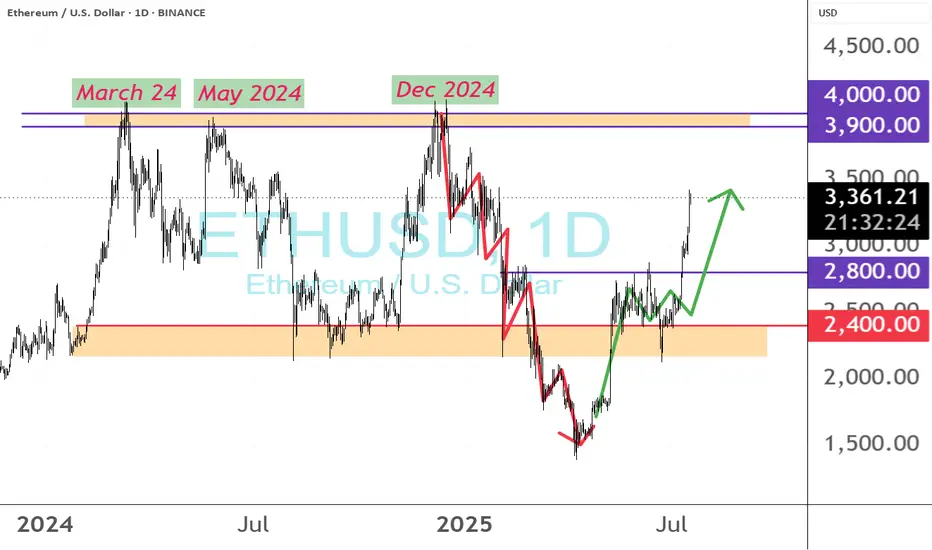
ETH $3,900–$4,000 Major Resistance: Can This Rally CLEAR $4,000?#ETH $3,900–$4,000 is still a very major resistance for ETH, having been tested in March, June, and December 2024… all without success. Let’s see if this rally is able to CLEAR the $4,000 level?
Ethereum is going to 2000 then new ATH
Alright, let's talk about what I see coming for Ethereum. I’ve been deep-diving into these charts, especially that weekly one where I’ve highlighted the past moves and percentages. I'm using these patterns as a guide to try and anticipate where Ethereum is heading next. I'm going to set aside any kind of trading advice, and focus on what I see the market doing next.
Key Observations From Past Cycles
Looking at Ethereum's history, I’m seeing a pretty clear cycle of large price swings:
Massive Rallies: Ethereum has a history of powerful bull runs, where the price can surge by hundreds, or even thousands of percent. I need to be aware of these to understand the potential of the coin.
Substantial Corrections: These rallies are always followed by substantial corrections, which range from about 30%, to upwards of 80%. This is important to see as any retracement can be devastating to a trader.
My Prediction For The Next Move:
Based on those historical patterns, here’s what I see as the most probable outcome for Ethereum's next move:
Anticipated Retracement: I’m expecting a retracement, or a pullback following the recent gains. Ethereum tends to make large retracements after a period of growth, and I am anticipating this will happen again soon. I want to see the price find a solid level of support, as this will be important to the next move up. Based on historical price action, I expect the next support levels to be somewhere around $2000 to $2500.
The Next Upside Move: After that pullback, I anticipate a strong upside move.
The magnitude of this move is unclear, but the data on the chart shows we could be looking at a move upwards of 100%, and maybe even more. I want to be watching that very carefully when it happens.

Moon SoonThe Genius Act passing and other regulatory tailwinds pave the way for the US financial system and the rest of the world to slowly migrate over to blockchain infrastructure via Ethereum. The demand relative to supply imbalance will force ETH to re-rate aggressively over coming months and years


ETH 1H – Breakout or Bull Trap ?
ETH just broke above the 0.236 Fib with a strong push.
✅ Trend structure remains bullish:
MLR > SMA > BB Center.
But something feels off...
🔍 Volume surged late — likely short liquidations.
OBV didn’t confirm — it's still lagging.
RSI is extended. Structure looks tired.
Could be a liquidity grab above recent highs.
If price closes back below the Fib, momentum could fade fast.
📌 Key zones to watch on a pullback:
– 1H 50MA
– Previous support clusters
We’ll be here to watch it unfold.
Always take profits and manage risk.
Interaction is welcome.

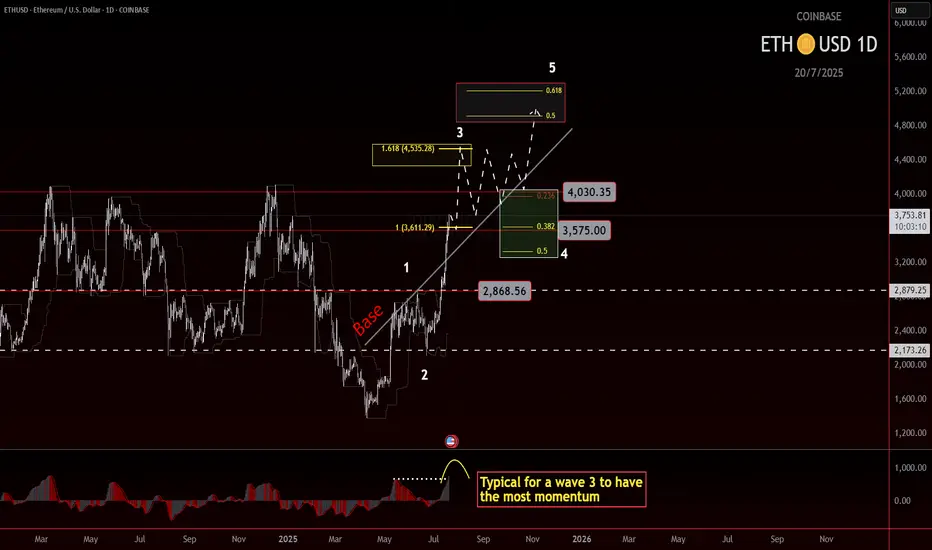
ETH roadmap to 5000!Ethereum Wave 3 in Play? Eyes on the $4500 Target
Ethereum may currently be progressing through a wave 3, which is often the strongest leg of an impulse. The structure so far supports that idea, and based on standard projections, the most likely target sits near $4500.
If price can break and hold above the 4k level, we could see a consolidation forming above the previous high. That would be a constructive sign and might set up the next leg higher.
But there’s still a chance ETH struggles to clear that level. If that happens, consolidation could form just underneath, which would still be acceptable within a wave 3 framework. What matters next is the shape and depth of the pullback.
Wave 4 will be the key. A shallow or sideways correction would keep bullish momentum intact. A deeper pullback doesn't ruin the structure, but it does mean we’ll need to watch support zones more closely.
If wave 4 behaves well and broader market conditions stay supportive, then a final wave 5 could bring ETH into the $5000 region. That’s the upper edge of this current roadmap, based on conservative assumptions.
Stay flexible. Let the structure guide the bias.
ETHEREUM: The $4,000 Triangle - Breakout or Breakdown?🎯 THE MEGA SETUP: Giant Symmetrical Triangle
🔍 What We're Looking At: 📐 Triangle Specifications:
🟢 $3,042.00 - Triangle Lower Trendline
🟢 $2,875.00 - 1W FVG (Fair Value Gap)
🔴 $4,087.00 - BSL (Buy Side Liquidity)
🔴 $4,200.00 - Psychological barrier
_______________________
🛡️ CONSERVATIVE LONG:
Entry: $2,800 - $2,850 (Triangle support bounce) 📊
Stop Loss: $2,740 (Below triangle) ❌
Targets: $3,500 → $3,800 → $4,200 🎯
! Smash that follow button for more killer setups! 🔥📊
____________ NOTE __________
⚠️ RISK MANAGEMENT
⚠️ DYOR
Remember: No setup is guaranteed. Always manage risk and never invest more than you can afford to lose.

ETH weekly turning positive too targeting $5000 sl $1500Weekly trend turning slowly turning positive with daily already in a positive channel, expecting 5000 with corrections along the way. Dipping below $1500 would invalidate

ETH turned bullish on the daily chart, great R:R hereTargeting mid to upper 3000s in the mid-term (2-3 months) and expecting 5k plus by year end. ETH will get it's turn, don't worry

make or break for ethEthereum is currently trading at a make-or-break level. If we fail to break above this key resistance area before or during tomorrow’s U.S. market open, there’s a high likelihood of a sharp downside move. The most compelling bull case recently—BlackRock’s involvement in ETH staking through ETFs—has already played out. At this point, I struggle to see any near-term catalysts that could surpass that narrative in bullish impact.
Despite that, broader market sentiment remains highly irrational. Across equities and crypto alike, we’re seeing strength that, in my view, isn’t fundamentally justified. I personally don’t believe the market deserves new all-time highs given current macro and liquidity conditions.
Technically speaking, I’ll consider entering a short position if ETH closes within the 0.5 monthly order block without a clean breakout. On top of that, the Ethereum futures weekly chart also looks bearish—Friday’s close reinforced that weakness. However, it’s possible we gap up and invalidate the current futures order block, which would require a reassessment of the short setup.
Right now, caution and discipline are key. We're at a technical and psychological inflection point—and what happens next could shape the trend for weeks.
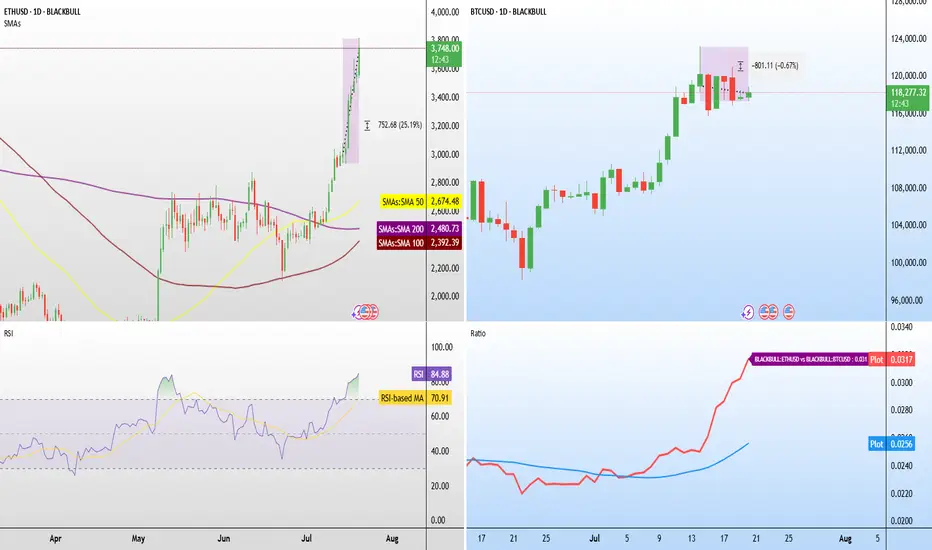
Will ETH stall at $3,800 like BTC did at $120K?Ethereum is firmly in breakout mode. The ETH/BTC ratio , a closely watched measure of altcoin strength, has surged close to a year-to-date high.
ETH has now gained over 25% in the past week, fueled by institutional flows into ETH ETFs and tech investor Peter Thiel reportedly taking a major stake in BitMine.
RSI is at 84.82 , showing extremely strong momentum, though short-term consolidation near the $3,800–$4,000 resistance zone is possible. This is a zone that capped previous rallies in 2024.
Bitcoin, in contrast, is holding flat near $118,000 , down slightly from its recent highs above $120,000 . Small-bodied candles and minor intraday sell-offs have formed a tight consolidation block, indicating profit-taking and indecision.
The question now is whether Ethereum will follow BTC’s recent behaviour and stall near local highs, or whether the breakout will carry it decisively through $4,000 .
ETH It is important not only to sell on time, but also not to return money to the market when it seems like the best opportunity to make money...

High SpeculationThis is something I've come up with for a bit of fun, but looks pretty convincing, but should still to take with a massive grain of salt.
After comparing the ETHBTC and ETHUSD dates, this is what I've come up with, and so to get a better understanding, visit my other post showcasing the ETHBTC chart and put them side by side.
I've come up with a bull cycle endpoint by using ETHBTC's top and bottom durations which typically coincide with each other, and just used the channel it has been following as the potential price peak, given how much ETHUSD has moved from a far smaller move in ETHBTC makes this possible as ETHBTC has a long way to go still.
