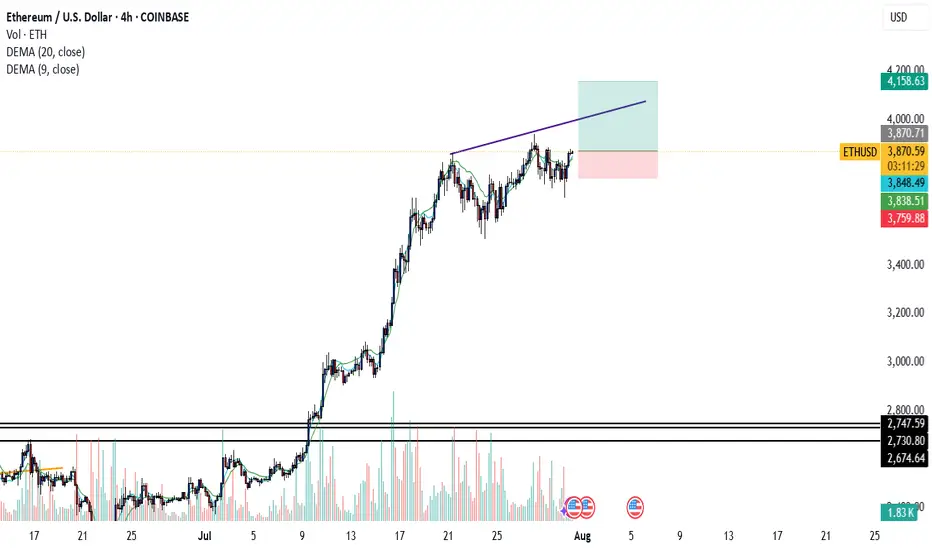
ETHETH has poised for more bullish movement to the upside we are currently at a demand zone in confluence with a fibonnaci and also sma in line with the level if it should hold we might see eth rally into 3800 per coin and 4600 per coin
ETHUSD.P trade ideas

ETH on the 1H timeframe
Indicators are showing slight weakness:
MLR < SMA < BB Center
Price is trading below the 50MA
RSI is under the midpoint, and green volume is fading
This could just be a pause before the next leg up
but I’m curious whether the last high of $3,678.86 was this week’s top,
or if price will try to break it tomorrow.
Always take profits and manage risk.
Interaction is welcome.

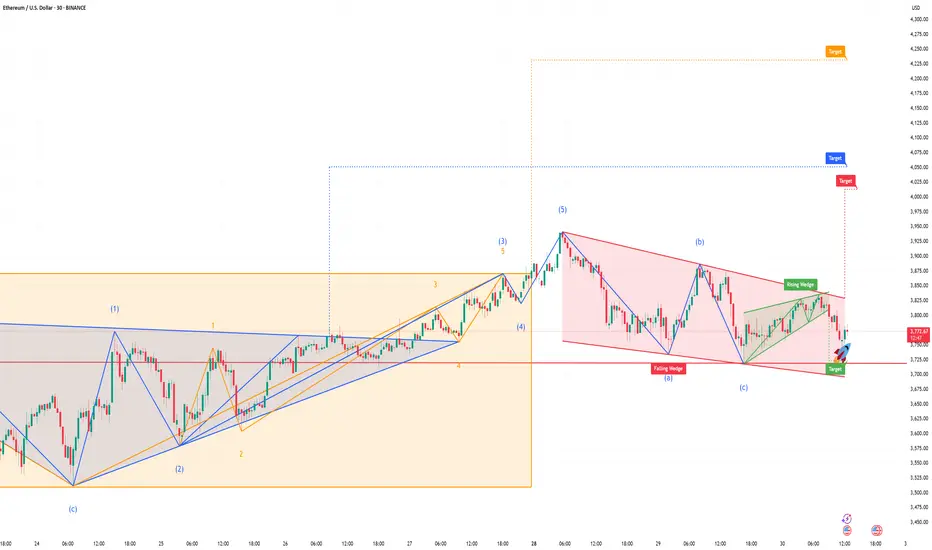
MY VIEW ON ETH - BULLISH & BEARISHMy analysis of Ethereum (ETH): Bullish and bearish scenario
The analysis of Ethereum is currently quite complex. The price structure does not show clear impulses in the form of classic wave movements, but frequently overlapping patterns that indicate ABC correction waves.
I therefore present both my primary and an alternative scenario for a bullish (rising) and a bearish (falling) trend.
Primary bullish scenario:
Wave 2 seems to be completed at the lower end of the blue trend channel and at the 70.70-% FiB. We could currently be in red wave 3. However, the structure of this movement is more reminiscent of an ABC formation, which could indicate a weaker impulse.
Should the price break through the upper edge of the blue trend channel and exceed the 100% Fibonacci level at around USD 4,424, several important Fibonacci zones would converge in the “profit area” marked in red. In this case, a setback as part of the red wave 4 could not be ruled out.
Alternative (bearish) scenario:
It is possible that the blue V-wave could turn into a white ABC structure. In this case, an additional wave 4 would be omitted, which could result in a stronger sell-off.
Secondary scenario - bearish:
If Ethereum fails to play out the primary bullish count scenario, I expect that we will continue to be in an overarching correction phase. This assessment also fits in with the typical market slowdown during the summer months.
In this case, a green ABC correction could form, whereby wave C could theoretically still rise to the 100% Fibonacci level at USD 4,416. However, this would be an overextended wave B.
In addition, we are already in the area of the sales or profit zone, which indicates that only a limited rise is possible.
Subsequently, I expect a stronger downward movement towards the green buy area between the 1.618 Fibonacci level and around USD 1,866.
LEAVE YOUR COMMENTS AND ASSESSMENT
ETH/USD Double Bottom with Bullish RSI Divergence 1HETH/USD has formed a double bottom pattern on the 1 -hour timeframe , signaling a potential bullish reversal after recent downside pressure. The pattern is supported by a bullish RSI divergence, where price made lower lows but RSI printed higher lows — indicating a momentum shift.
A buy stop entry is placed just above the neckline, targeting a continuation toward key resistance zones.
Trade Setup
Buy Stop Entry: 3539.52 (on confirmed neckline breakout)
Stop Loss: 3424.13 (below second bottom – invalidation level)
Take Profit 1: 3658.19
Take Profit 2: 3774.71

Ethusd $2500 I suspect may be the last dipTechnical analysis on ethusd .
Whilst everyone is bullish from current level, my technicals is telling me $2500 region which is key for upward movement or a break makes it want to go lowet

Ethereum Breakdown Imminent: Bearish Triple Tops confirmedEthereum has fired off multiple bearish signals that traders and investors cannot ignore. A confirmed triple top on the daily chart suggests exhaustion at resistance, while the appearance of a hanging man candlestick pattern adds weight to the reversal thesis.
The daily RSI has confirmed a bearish divergence, and the MACD has officially crossed below the zero line—marking a shift in momentum and confirming bearish control.
In this video, I’ll break down:
• The triple top formation and its implications
• Why the 200 EMA is the next major support target
• The significance of RSI and MACD confirmations
• What traders should watch for in the coming sessions
This isn’t just noise—Ethereum’s technicals are flashing red. Make sure you’re prepared.


ETH VS AI?Hi
Asked AI on the next movement ETH
Predicted Target = 4 847
Time Projection 20 days → 15 Aug 2025
Probability (%) Attenuation × 100 = 183.6 %
Variance vs. Today (Target) 4 847 − 3 507 = 1 340
Projected Retracement Price 3 886 − 599 = 3 287
Variance vs. Today (Retrace) 3 287 − 3 507 = −220
All the best
Caveat emptor
Not a guru

ETH Critical Next Few Days.Hello I am the Cafe Trader.
Today we are taking a close look at Ethereum.
After the Tariff news and the Jobs report, The market as a whole seems very bearish suddenly to many. Even though we do have aggressive sellers in the short term, The market is still bullish in the mid to long term. Let's take a look.
Sentiment has changed
A major catalyst (like the Tariffs news) can cause a change of terrain. Buyers may become more bashful, taking their foot off the gas (where the put it before). Reactions to kry levels (like "top of demand") will give us clues into how strong are they still.
Short Term
ETH had a huge rally, Whats does a healthy rally need for a continuation?
Consolidation
This brings us to the charts
Top of demand gives us evidence of how convicted these current buyers still are in a market. A hot reaction = Aggressive Demand. Cold Reaction = Hesitant or lack of Demand.
Todays close was a touch cold, but considering the recent bearish news and data, not terrible. Buyers are still active in this area, but since the terrain might have changed, I have given you two scenarios.
Green Scenario
For this to play out, we need to see buyers step in immediately. The longer ETH stays in this demand, the heavier they will become (and it's a long way down)
Wait for a second test minimum. Best to get a hot reaction. If it presses into the demand zone, Cut it early. (always good to wait for a close)
Entry 3,518
Stop 3,360
TP 1 3,990
TP 2 Breakout? Trailing stop?
Red Scenario
If we can't close above top of demand (Like tomorrow...) This is the likely scenario. I would be hard pressed to try and catch a knife this overextended. So until we identify where the new sellers are sitting, I can't give you any trades on this scenario. If you are short biased this could run all the way down to the bottom of demand.
I'll keep a close eye this over the weekend and keep updates.
Long Term
These prices should be according to your personal sentiment on ETH.
Aggressive = 3,500
Good price = on the trend roughly 2,900 - 3k
STEAL = 2,200 - 2,400
That's all for ETH! Enjoy your weekend, and Happy Trading!
@thecafetrader

Ethereum (ETH/USD) Technical InsightsEthereum (ETH/USD) Technical Insights
**Chart Overview**
* **Current Price**: \~\$3,631
* **EMA 7 (Red Line)**: \$3,720.80
* **EMA 21 (Blue Line)**: \$3,522.96
* **Key Support Zone (Pink area)**: \~\$3,600–\$3,650
* **Support 1 (S1)**: \~\$2,950
* **Support 2 (S2)**: \~\$2,500
* **Uptrend Line**: Still intact, but under pressure
**Technical Insights**
* **Price Breakdown**: ETH has dropped below the **EMA 7**, and is now testing a **critical horizontal support zone** around **\$3,600–\$3,650**.
* **Trendline**: Still holds, but ETH is **hovering just above it**, signaling a potential bounce or breakdown.
* **EMA 21** near \$3,522 is the next short-term support if \$3,600 fails.
* **Momentum**: Recent candles show **strong selling**, indicating weakness, but no full breakdown yet.
**Bullish Scenario**
*Conditions**:
* Price **holds above** \$3,600–\$3,620 zone and the **trendline**
* **Bounce** with bullish daily candle from current zone or above \$3,650
**Buy Setup**:
* **Entry**: \$3,620–\$3,650 on confirmation
* **Stop-loss**: Below \$3,520 (just under EMA 21)
* **Targets**:
* TP1: \$3,720 (reclaim EMA 7)
* TP2: \$3,850–\$3,940
* TP3: \$4,100+
**Bearish Scenario**
**Conditions**:
* Price **breaks below** \$3,600 and **the trendline**
* EMA 21 is lost with strong bearish candle
**Sell Setup**:
* **Entry**: Below \$3,580 on breakdown
* **Stop-loss**: Above \$3,650
* **Targets**:
* TP1: \$3,520 (EMA 21)
* TP2: \$2,950 (S1)
* TP3: \$2,500 (S2)
**Bias: Neutral with Bearish Lean**
* **Decision Zone**: ETH is at a key inflection point
* Wait for **confirmation**: bounce or breakdown before entering

ETH 4H – 58% Trend Ride From MACD Liquidity StrategyThis Ethereum 4H setup shows the power of a clean trend-following system. The MACD Liquidity Tracker Strategy (Normal Mode) entered long on July 1st after price reclaimed both the 60 and 220 EMAs — a major shift in directional bias confirmed by MACD momentum flipping bullish.
From there, ETH trended smoothly for weeks, gaining +58.35% before the strategy exited automatically as momentum waned and MACD flipped bearish. No overtrading, no manual input — just clear structure, confluence, and filter-based entries.
Now, we’re seeing pink candles return and price struggling to hold the 60 EMA. A continued breakdown here could open the door toward $3,400–$3,500 support. Bulls must reclaim $3,750+ quickly to confirm continuation.
📊 Strategy Breakdown:
– MACD: 25 / 60 / 220
– EMA Filter: 60 & 220
– Mode: Normal
– Timeframe: 4H
Educational content. Drop thoughts or questions below — let’s break it down together.

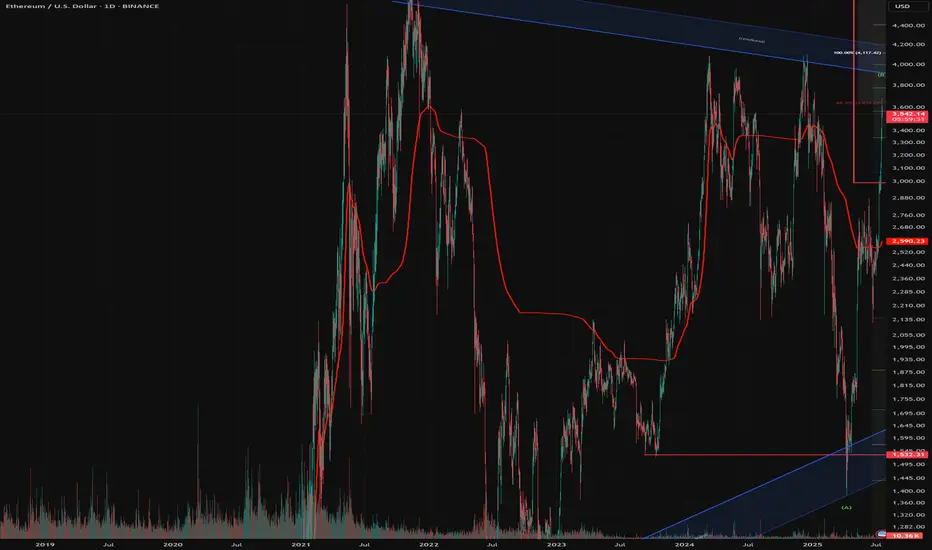
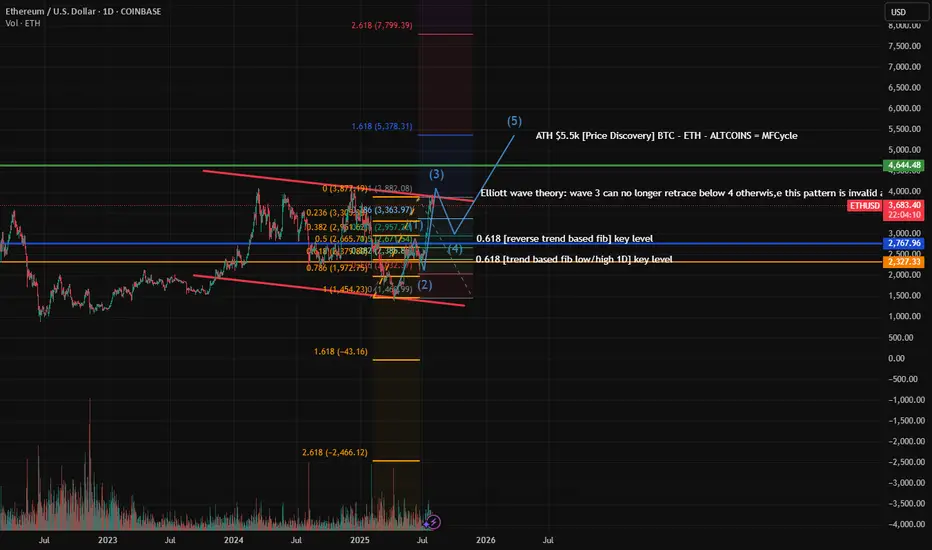
ETH in a 1-5 patternEverythings is labeled on the chart of my theory and where I predict if this theory is valid following BTC's ATH and the Money Flow Cycle.
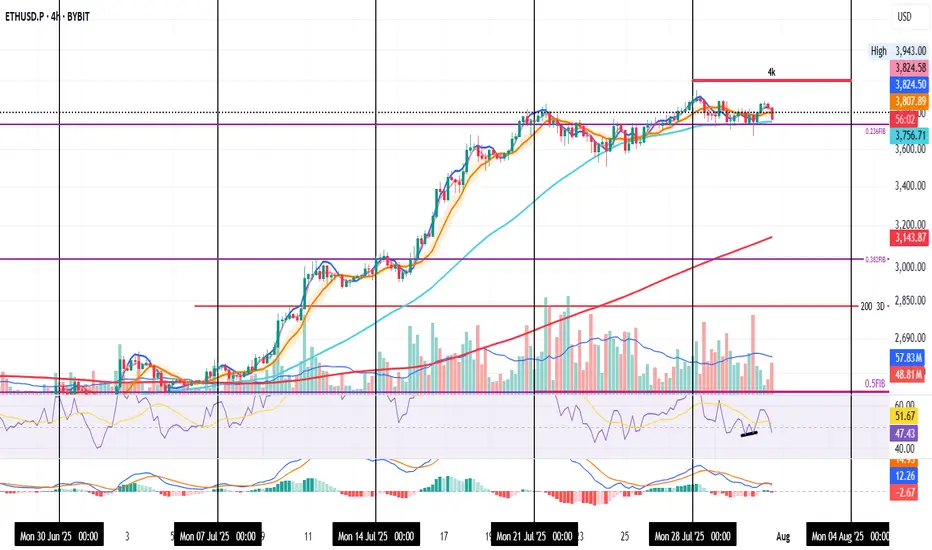
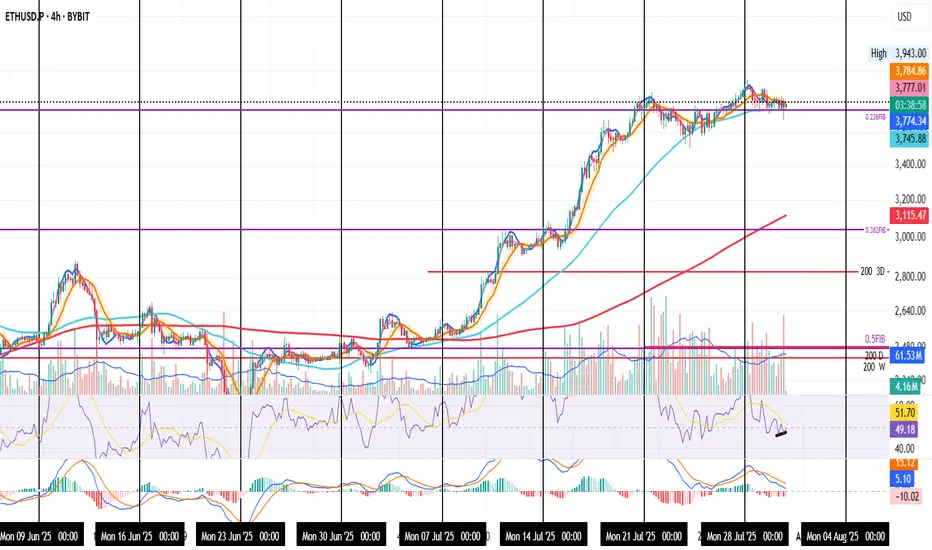
ETH Holding Steady in the Noise
ETH on the 4H
Price is pulling back again — mostly due to sticky inflation.
Even though YoY CPI came in at 2.8% (vs 2.7% expected), MoM data was on target, so the market may just be pricing in “higher for longer.”
Back to the chart — not much has changed.
ETH is still holding above both the 0.236 Fib and the 50MA.
The next real resistance is around $4,000.
Personally, I’d rather see price consolidate and gear up for a clean breakout than rush into it and get rejected.
Right now, it feels like ETH is waiting for direction.
It had a reason to drop — and didn’t.
It had a reason to fly — and paused.
Could be prepping for a boring chop before a sudden move.
I'm still bullish overall. Holding a long.
If it moves against me, I’ll scale out.
If it breaks higher, I’ll scale in.
Always take profits and manage risk.
Interaction is welcome.

ETH bullish Tke your trade, etherium is showing so good resistence and a bullish confluences , next stop the 4000 dollars key zone ,
BTC vs ETH: Lil Bro not waiting on nobody?!As BTC is stuck trying to convince everyone to stay long, ETH is using its bullish orderblocks really well...shorts are showing signs of letting go in these ranges.
Would like to hear your take!

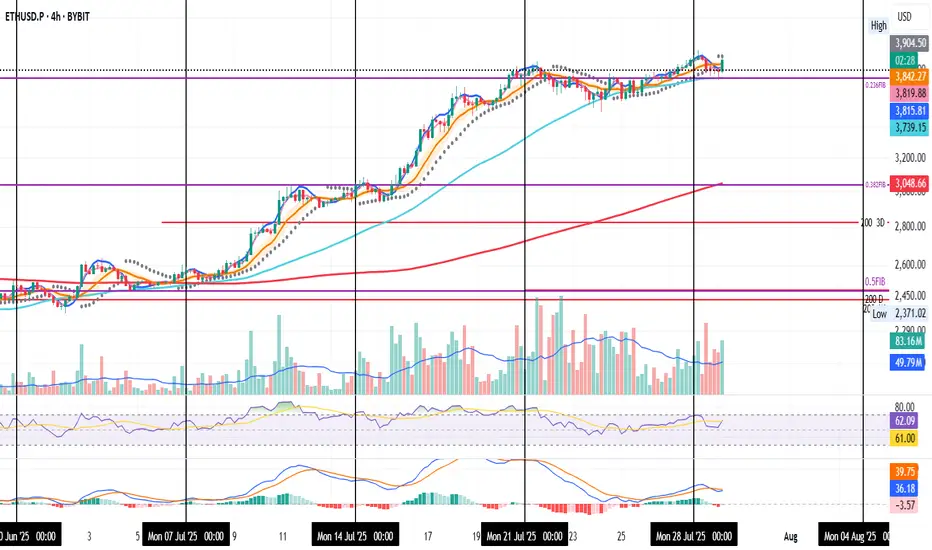
ETH: Buyers Show Their HandETH on the 4H
The Fed noise is gone, now it’s just pure market intent.
Price wicked below the 0.236 Fib, but buyers stepped in fast, showing strength at that level.
A small bullish divergence is forming on the RSI. If ETH holds above the Fib, that signal could gain momentum.
Always take profits and manage risk.
Interaction is welcome.
3 Key Catalysts Driving the Next ETH Bull Run
A remarkable confluence of powerful market forces is brewing in the Ethereum ecosystem, fueling increasingly bold outlooks for its future valuation. A potent combination of historical price patterns, dramatic supply dynamics, soaring institutional interest, and resilient price action is painting a picture of a digital asset potentially on the verge of a historic expansion. While a target of $20,000 may seem audacious, a granular look at the underlying mechanics reveals a compelling, multi-faceted argument for a significant upward repricing of Ethereum (ETH).
This deep dive will explore the four key pillars supporting this optimistic outlook: a striking historical price pattern that mirrors Bitcoin’s monumental 2021 surge, a critical supply shock evidenced by a mass exodus of ETH from exchanges, record-breaking institutional engagement in the futures market, and a tenacious price strength holding firm at key technical levels.
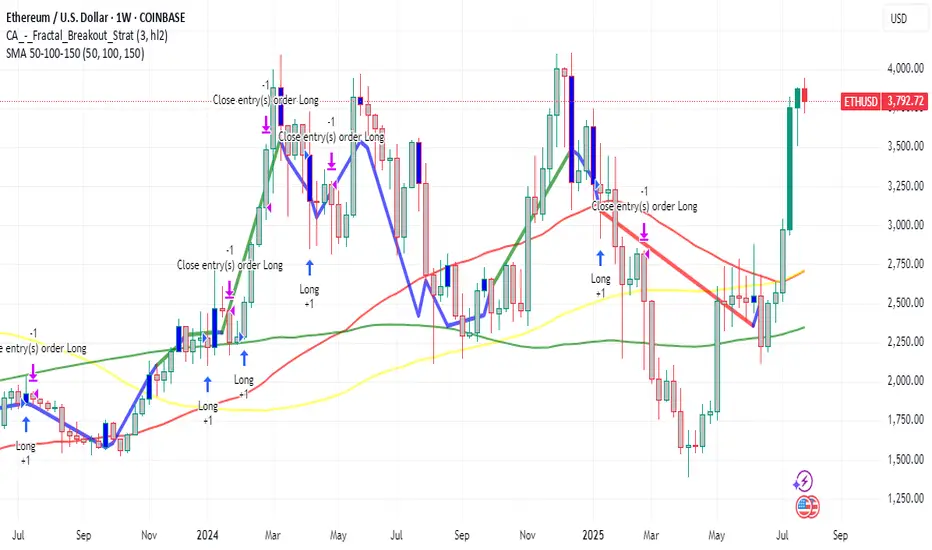
Chapter 1: The Bitcoin Fractal: Is History Rhyming?
In financial markets, history rarely repeats itself exactly, but its patterns often rhyme. Market analysts are increasingly pointing to a "fractal"—a recurring geometric pattern in price action—that suggests Ethereum's current market structure is eerily echoing that of Bitcoin's in late 2020, just before its parabolic surge in 2021.
This analysis highlights that Ethereum's chart is displaying a nearly identical pattern of accumulation, re-accumulation, and price compression that Bitcoin exhibited before its own historic breakout. During that period, Bitcoin experienced a multi-fold increase in value, shattering previous records. The parallel suggests that, much like Bitcoin did, Ethereum has emerged from a prolonged consolidation phase and is now pressing against a long-term downtrend resistance line that has defined its market structure for several years.
Should this fractal play out as it did for Bitcoin, a decisive breakout above this critical resistance could trigger a rapid, exponential move upwards. The potential for such a climb is being fueled by a perfect storm of institutional adoption and favorable market shifts.
A critical catalyst underpinning this parallel is the recent launch and explosive growth of spot Ethereum Exchange-Traded Funds (ETFs). The 2021 Bitcoin bull run was significantly propelled by growing institutional legitimacy and new, regulated investment vehicles. Similarly, Ethereum ETFs are now providing a secure and accessible gateway for a fresh wave of institutional capital. These funds have already seen staggering net inflows, with major asset management firms accumulating billions in assets, signaling deep conviction from the titans of traditional finance. This institutional stamp of approval is a powerful parallel to the forces that drove Bitcoin's last major cycle, providing the foundational capital flows needed for a sustained rally.
Chapter 2: The Great Supply Squeeze: A Mass ETH Exodus from Exchanges
One of the most compelling bullish arguments for Ethereum is rooted in fundamental on-chain economics: a dramatic and accelerating supply squeeze. The "Exchange Reserve," a metric that tracks the total amount of ETH held in the wallets of centralized exchanges, has plummeted at an astonishing rate.
In a recent one-month period alone, well over one million ETH were withdrawn from these platforms. This mass exodus of coins is a profoundly bullish indicator. When investors move their assets off exchanges, it typically signals an intention to hold for the long term in self-custodial wallets, rather than keeping them liquid and ready for a quick sale. This behavior drastically reduces the immediately available supply on the open market. Consequently, even a steady level of demand can exert significant upward pressure on the price.
This trend has pushed the total supply of Ethereum on exchanges down to its lowest level in nearly a decade. The drivers behind these massive withdrawals are multifaceted and all point toward a tightening market:
• Long-Term Conviction and Staking: A growing number of investors are locking up their ETH in staking contracts to help secure the network and earn passive yield. Others are simply moving their holdings to secure "cold storage" with a long-term investment horizon, effectively taking them off the market for the foreseeable future.
• DeFi Integration: A significant and growing portion of ETH is used as the primary form of collateral within the sprawling Decentralized Finance (DeFi) ecosystem, where it is locked into smart contracts for lending, borrowing, and other financial applications.
• ETF Accumulation: The newly launched spot ETFs are required to purchase and hold real ETH to back their shares. This direct accumulation removes vast quantities of ETH from the circulating supply that would otherwise be available to retail and institutional buyers.
This fundamental imbalance between a shrinking available supply and growing demand is creating the perfect conditions for a potential "supply shock." The sustained decline in exchange reserves, even as prices have rallied, reinforces the idea that current holders are not rushing to take profits. This indicates a strong belief in future price appreciation and adds a powerful layer of underlying support to Ethereum's macro bullish structure.
Chapter 3: The Wall of Institutional Money: Futures and Open Interest Soar
The derivatives market, often seen as the playground for more sophisticated and institutional investors, is flashing its own set of glaringly bullish signals. Open Interest (OI) in Ethereum futures—representing the total value of all outstanding futures contracts that have not been settled—has surged to unprecedented levels.
On major regulated exchanges favored by institutional investors, Ethereum futures Open Interest has recently shattered all-time highs. This represents a massive and undeniable increase in institutional participation, as asset managers, hedge funds, and other large-scale players use these regulated products to gain exposure to ETH's potential upside and to manage their risk. This is not an isolated phenomenon; across the global landscape of exchanges, the total Open Interest for Ethereum futures has climbed to record-breaking heights.
Rising Open Interest that occurs in tandem with a rising price is a classic technical confirmation of a strong and healthy trend. It demonstrates that new money is actively flowing into the market, with participants expressing confidence in future price appreciation. This influx of capital adds significant fuel to the ongoing rally. The surge in derivatives activity highlights a maturation of the market, where both institutional and retail investors are increasingly using sophisticated financial instruments to speculate on Ethereum's price trajectory.
While the high levels of leverage inherent in futures trading can introduce volatility and the risk of cascading liquidations, the primary signal is one of immense and growing institutional conviction in Ethereum's medium-to-long-term outlook. The influx of capital into both spot ETFs and the futures market creates a powerful, self-reinforcing feedback loop, enhancing liquidity, legitimizing the asset class, and attracting even more conservative capital off the sidelines.
Chapter 4: The Immediate Battleground: Price Action Shows Resilient Strength
Zooming in from the macro-outlook to the short-term technical picture, Ethereum's price action has demonstrated notable resilience, reinforcing the broader bullish thesis. After a strong rally, the price has been consolidating its gains, establishing critical support zones that traders and algorithms are watching with keen interest.
Recent price action shows Ethereum starting a fresh increase above the $3,820 and $3,880 levels. The price is trading near the crucial $3,800 mark and the 100-hourly Simple Moving Average, an indicator that often acts as a dynamic line of support during uptrends. Although there was a brief break below a key bullish trend line that had formed with support at $3,800 on the hourly chart, the ability of the price to remain supported above the broader $3,720 zone is considered vital for a bullish continuation. Should the pair remain supported above this zone in the near term, it could start a fresh increase.
The price has recently faced resistance near the $3,900 and $3,920 levels. The psychological $4,000 barrier remains the next major target. A decisive and sustained break above the $4,000 mark could open the door for a rapid advance, as it would clear the last major resistance area before a potential retest of previous all-time highs.
Technical indicators on higher timeframes remain robust. The price is in a clear long-term uptrend, trading well above its key daily moving averages. While short-term indicators may show temporary overbought conditions or moments of waning momentum, the overall market structure remains decisively bullish as long as critical support levels continue to hold.
Conclusion: A Compelling Case for a New Era of Price Discovery
The prospect of Ethereum reaching a valuation of $20,000 is a monumental forecast, but it is one built on a solid and multi-faceted foundation. The convergence of a compelling historical fractal mirroring Bitcoin's most famous bull run, a verifiable and intensifying supply shock, unprecedented institutional adoption via both spot ETFs and futures markets, and a resilient technical posture creates a powerful case for a sustained bullish continuation.
Each pillar of this argument reinforces the others. Institutional inflows from ETFs directly contribute to the supply squeeze on exchanges. The resulting upward price pressure attracts more speculative interest in the futures market, and the resilient technical picture provides the stable base from which a larger market move can be launched. While no outcome in financial markets is ever guaranteed, and the risks of volatility and sharp corrections remain ever-present, the confluence of these potent factors suggests that Ethereum may not just be knocking on the door of its old all-time high, but preparing to smash through it and enter a new and explosive era of price discovery.
Etherum turns 10 in Style after the previous year of etherum struggling there is new hopes of etherum hitting new higher high. these is due to VP of the USA Vence once again showing confidence in Bitcoin.

ETH is expected to rise toward USD 4 000 – USD 4 200Expecting a rise toward USD 4 000 – USD 4 200, with a maximum downside correction to USD 3,700
Has Eth begun its descent?On July 23rd, I anticipated that Eth would dump once it took out the range high.
Now that we have witnessed that, along with a bearish retest (as indicated on chart),
I believe the descent has begun. I hope I'm wrong.
But if I'm right, it will provide me with an amazing entry point around $2900-3200

Strong ETH on the 4H !
ETH is now in the process of retesting both the 50MA and the 0.236 Fib level.
This current candle is closing strong — with solid volume. If momentum holds, both systems are close to flipping bullish:
– PSAR is about to flip
– MLR and SMA are lining up to cross above the BB center
RSI has cooled off, giving room for more upside, and MACD is close to turning bullish.
In short:
We’ve got a confirmed Fib retest on good volume
Both systems are preparing to signal long
And both oscillators are backing the move
We’ll be here to watch it unfold.
Always take profits and manage risk.
Interaction is welcome.
ETHUSD : Playing with the DThe good thing about a harmonic pattern is that it significantly lowers your risk. It forces you to be patient and wait.
It can be applied to all, whether FX, stocks, crypto, etc.
Why does it work better compared to others? The answer is simple - PRICE ONLY MOVES UP AND DOWN, PRICE DOES NOT MOVE SIDEWAYS.
One crucial thing we can see from the above is that the D < B. Which means if we are patient enough and wait for the appropriate time to SELL, the probability is very good to make money.
Good luck.
