Ethereum: Eyeing New Highs?Ethereum has surged recently and continues rising in turquoise wave B. The next target is a break above the June high, with potential upside to resistance at $4,107. A direct breakout above this level (27% probability) would suggest green wave alt. ended in April. However, our main scenario expects a reversal below $4,107, with turquoise wave C likely dragging ETH into the Long Target Zone between $935.82 and $494.15 to complete wave .
📈 Over 190 precise analyses, clear entry points, and defined Target Zones - that's what we do.
ETHUSD.PI trade ideas

Ethereum, Generational opportunity is on its way Ethereum has been bearish for already couple years, and if you feel like me - missed out, then let me tell you that we might actually get golden entries
I am thinking we will witness Ethereum under 700 dollars once again, just before the world moves onto next stage - digital AI age
This is detailed Elliott Wave breakdown

ETHUSD coiling pattern breakout support at 2170.Trend Overview:
ETHUSD remains in a bullish trend, characterised by higher highs and higher lows. The recent intraday price action is forming a continuation consolidation pattern, suggesting a potential pause before a renewed move higher.
Key Technical Levels:
Support: 2,170 (primary pivot), followed by 2,080 and 1,980
Resistance: 2,610 (initial), then 2,800 and 2.920
Technical Outlook:
A pullback to the 2,170 level, which aligns with the previous consolidation zone, could act as a platform for renewed buying interest. A confirmed bounce from this support may trigger a continuation toward the next resistance levels at 2,610, 2,800, and ultimately 2,920.
Conversely, a daily close below 2,170 would suggest weakening bullish momentum. This scenario would shift the bias to bearish in the short term, potentially targeting 2.080 and 1,980 as downside levels.
Conclusion:
ETHUSD maintains a bullish structure while trading above the 2,170 support. A bounce from this level would validate the consolidation as a continuation pattern, with upside potential toward the 2,610 area. A breakdown below 2,170, however, would invalidate this view and suggest deeper corrective risk.
This communication is for informational purposes only and should not be viewed as any form of recommendation as to a particular course of action or as investment advice. It is not intended as an offer or solicitation for the purchase or sale of any financial instrument or as an official confirmation of any transaction. Opinions, estimates and assumptions expressed herein are made as of the date of this communication and are subject to change without notice. This communication has been prepared based upon information, including market prices, data and other information, believed to be reliable; however, Trade Nation does not warrant its completeness or accuracy. All market prices and market data contained in or attached to this communication are indicative and subject to change without notice.

Bearish reversal off major resistance?The Ethereum (ETH/USD) is rising towards the pivot which acts as a pullback resistance and could reverse to the 1st support which is a pullback support.
Pivot: 2,655.32
1st Support: 2,506.53
1st Resistance: 2,820.60
Risk Warning:
Trading Forex and CFDs carries a high level of risk to your capital and you should only trade with money you can afford to lose. Trading Forex and CFDs may not be suitable for all investors, so please ensure that you fully understand the risks involved and seek independent advice if necessary.
Disclaimer:
The above opinions given constitute general market commentary, and do not constitute the opinion or advice of IC Markets or any form of personal or investment advice.
Any opinions, news, research, analyses, prices, other information, or links to third-party sites contained on this website are provided on an "as-is" basis, are intended only to be informative, is not an advice nor a recommendation, nor research, or a record of our trading prices, or an offer of, or solicitation for a transaction in any financial instrument and thus should not be treated as such. The information provided does not involve any specific investment objectives, financial situation and needs of any specific person who may receive it. Please be aware, that past performance is not a reliable indicator of future performance and/or results. Past Performance or Forward-looking scenarios based upon the reasonable beliefs of the third-party provider are not a guarantee of future performance. Actual results may differ materially from those anticipated in forward-looking or past performance statements. IC Markets makes no representation or warranty and assumes no liability as to the accuracy or completeness of the information provided, nor any loss arising from any investment based on a recommendation, forecast or any information supplied by any third-party.

Ethereum Trading Strategy: 5:1 Risk-to-Reward Ratio"Ethereum Showing Strength on the 4-Hour Chart — A New Bullish Trend Emerging?"
The 4-hour timeframe is starting to show strong bullish momentum. Could this be the beginning of a new uptrend?
A potential 5:1 risk-to-reward setup is forming:
Entry: 2,620
Stop Loss: 2,364
Target: 4,062
Support 2500 must hold!!!

ETHUSD-BUY strategy 6 hourly chart ETH is on the verge of a break $ 2,458 and supported by some of the indicators.
The break when happen, will likely see a move towards $ 2,580-2,600 again and considering BTC being in the $ 107-108k range, the ETHUSD has a chance to see those levels.
Strategy BUY @ $ 2,450-2,475 and take profit near $ 2,600.

Ethereum monthly cup and handleSoooo, this is my first post, and I'm not really too sure if I'm seeing this correctly, can somebody please explain to me why I'm wrong or if I'm right. Cuzzzzz this seems extremely bullish to me.
This is on the monthly timeframe, so this projection is for closer to November - February, IMO...
AM I SEEING THIS CORRECTLY, or is this my bullish personality shining through.

ETHUSDT Weekly Technical OutlookETHUSDT Weekly Technical Outlook
Acting as a strong intermediate support, aligning with previous accumulation range Major psychological and technical support zone, possible final defence before a bullish continuation.
Ethereum (ETH) appears to be forming a base between $2200 and $2000, suggesting a potential accumulation phase. This consolidation indicates that ETH may be preparing for a strong bullish move A heavy pump
You may find more details in the chart Ps Support with like and Comments for Better analysis Thanks for supporting.

Ethereum Breakout Unleashed: Major Upside Targets in Sight The ETH/USD 2-hour chart reveals a classic ascending triangle formation, which has now been decisively broken to the upside. After consolidating within a tightening range for several sessions, Ethereum has surged past the horizontal resistance level, supported by Ichimoku cloud structure and rising trendline support. The breakout candle is strong, indicating bullish momentum and potential for further upward movement. The breakout aligns with increasing volume and market confidence. This technical setup suggests a possible rally continuation toward higher resistance zones marked above. The structure remains bullish as long as price holds above the breakout zone with minimal retracement.
Entry: 2,570
1st Target: 2660
2nd Target: 2,850

Ethereum H4 | Potential bearish reversalEthereum (ETH/USD) is rising towards a pullback resistance and could potentially reverse off this level to drop lower.
Sell entry is at 2,551.80 which is a pullback resistance that aligns closely with the 78.6% Fibonacci retracement.
Stop loss is at 2,700.00 which is a level that sits above the 127.2% Fibonacci extension and an overlap resistance.
Take profit is at 2,364.35 which is a pullback support.
High Risk Investment Warning
Trading Forex/CFDs on margin carries a high level of risk and may not be suitable for all investors. Leverage can work against you.
Stratos Markets Limited (tradu.com ):
CFDs are complex instruments and come with a high risk of losing money rapidly due to leverage. 63% of retail investor accounts lose money when trading CFDs with this provider. You should consider whether you understand how CFDs work and whether you can afford to take the high risk of losing your money.
Stratos Europe Ltd (tradu.com ):
CFDs are complex instruments and come with a high risk of losing money rapidly due to leverage. 63% of retail investor accounts lose money when trading CFDs with this provider. You should consider whether you understand how CFDs work and whether you can afford to take the high risk of losing your money.
Stratos Global LLC (tradu.com ):
Losses can exceed deposits.
Please be advised that the information presented on TradingView is provided to Tradu (‘Company’, ‘we’) by a third-party provider (‘TFA Global Pte Ltd’). Please be reminded that you are solely responsible for the trading decisions on your account. There is a very high degree of risk involved in trading. Any information and/or content is intended entirely for research, educational and informational purposes only and does not constitute investment or consultation advice or investment strategy. The information is not tailored to the investment needs of any specific person and therefore does not involve a consideration of any of the investment objectives, financial situation or needs of any viewer that may receive it. Kindly also note that past performance is not a reliable indicator of future results. Actual results may differ materially from those anticipated in forward-looking or past performance statements. We assume no liability as to the accuracy or completeness of any of the information and/or content provided herein and the Company cannot be held responsible for any omission, mistake nor for any loss or damage including without limitation to any loss of profit which may arise from reliance on any information supplied by TFA Global Pte Ltd.
The speaker(s) is neither an employee, agent nor representative of Tradu and is therefore acting independently. The opinions given are their own, constitute general market commentary, and do not constitute the opinion or advice of Tradu or any form of personal or investment advice. Tradu neither endorses nor guarantees offerings of third-party speakers, nor is Tradu responsible for the content, veracity or opinions of third-party speakers, presenters or participants.

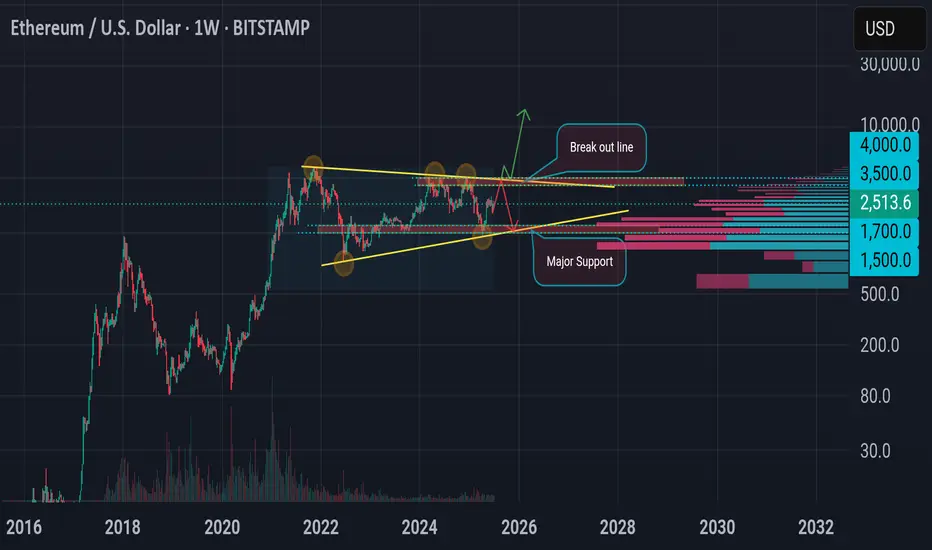
ETH Bullish pennant!?Let's look at the big timeframe (weekly). currently the price is moving in the consolidation area, forming a triangle with a narrowing trend but in a long time span. therefore there has been no eth spike for several years making it feel boring. big movement if it is able to penetrate the breakout line of 3500-4000$ or there will be a rejection if it fails. Major support is in the area of 1500-1700$ which historically is quite good at withstanding high selling pressure.
#SUI Ready to Grow up?#SUI
The price is moving within a descending channel on the 1-hour frame and is expected to break and continue upward.
We have a trend to stabilize above the 100 moving average once again.
We have a downtrend on the RSI indicator that supports the upward break.
We have a support area at the lower boundary of the channel at 2.83, acting as strong support from which the price can rebound.
We have a major support area in green that pushed the price higher at 2.75.
Entry price: 2.87.
First target: 2.95.
Second target: 3.04.
Third target: 3.14.
To manage risk, don't forget stop loss and capital management.
When you reach the first target, save some profits and then change your stop order to an entry order.
For inquiries, please comment.
Thank you.

ETH could be about to rip into a short-term rallyWhile the stock market has seen surprising upside in the past weeks (presumably due to pricing in rate cuts / a more positive liquidity picture / high expectations for Q2), crypto has lagged behind. I don't believe anything significantly above current prices - no matter in which market - is sustainable for now, but we can certainly milk it for whatever it's worth.
Notably, BTC has shown way more resilience and dominance in the current cycle so far. This makes sense in a high interest environment. However, within the bias of the markets pricing in expectations for rate cuts and as such more liquidity, we could also assume that demand for assets other than "safe havens" would now increase as well, leading us to the biased conclusion that we could see altcoins wildly outperforming BTC over the next weeks.
Indeed, if we look at the BTC chart, technicals such as VWAP stddevs show significantly less potential for upside if compared to ETH in the current moment in time. We therefore would focus on ETH at this point (as money flow seems to cycle BTC->ETH->Others).
PLEASE NOTE: SL and TP are not accurate. This is not a precise trading idea. Please use your own judgement in accordance with your trading style.

ETHERIUM LONG FOR TARGET 3000ETH has fallen from its recent high of 2879 to present levels of 2184 it has formed an anti butterfly pattern this is a good demand zone we can expect an up move from here targets and stop loss mentioned on the chart

ETH Ready for Lift-Off: Traders Eye +14% Surge Toward $2,813Ethereum has been consolidating in a large sideways range after recovering from a steep decline earlier this year. The chart clearly shows a defined support zone and key resistance area, with price currently trading just above mid-range and attempting to reclaim bullish momentum.
Chart Structure Highlights
• Support Zone: Around $2,231 – $2,232, which has been tested multiple times and held firmly, confirming strong demand here.
• Key Resistance / Take Profit Area: Near $2,813, a major level where price was repeatedly rejected in the past.
• Consolidation Box: A ~50-day range between support and resistance, suggesting accumulation.
• Recent Price Action: ETH is attempting to break out of the upper side of this consolidation, with buyers gradually stepping in.
Trade Setup
✅ Entry Zone: $2,450–$2,460
ETH is currently near this area, which represents a conservative breakout attempt from the range. Traders may look for confirmation candles closing above $2,460 for added conviction.
✅ Stop Loss: $2,231
Placed just below the lower edge of the support zone to protect against a failed breakout and renewed selling.
✅ Take Profit Target: $2,813
This is the key resistance level marked on the chart, offering approximately +14% upside from the entry.
Reward-to-Risk Profile
• Potential Reward: ~$353 (+14.3%)
• Potential Risk: ~$228 (-9.2%)
• Reward:Risk Ratio: ~1.55:1
Summary of the Setup
Ethereum has spent nearly 50 days consolidating between $2,230 and $2,813, and is now threatening a breakout to the upside. This creates a favorable swing trade scenario with a clear invalidation level below the strong support zone. A sustained move above the consolidation could target the $2,813 resistance in the coming weeks.

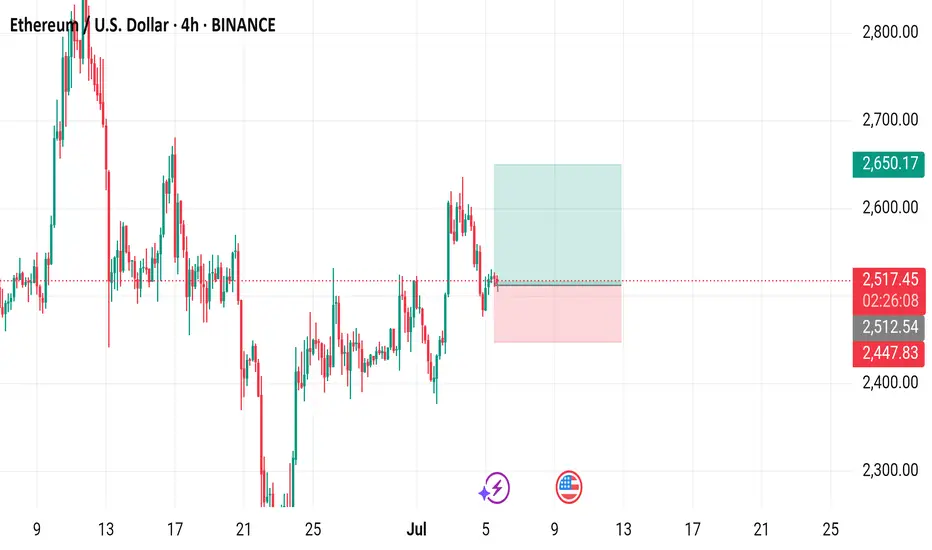
Ethereum / U.S. Dollar 4-Hour Chart4-hour chart from BINANCE displays the price movement of Ethereum (ETH) against the U.S. Dollar (USD) as of July 05, 2025. The current price is $2,520.12, reflecting a 4-hour increase of $10.77 (+0.43%). The chart includes buy and sell signals at $2,520.12, with a highlighted support zone around $2,447.83 and resistance near $2,650.17. A recent price drop is visible, followed by a potential consolidation or reversal zone marked in green and red.
ETH bullish ETH is at the entry on the daily. TP1-TP3 are possible price targets with BTC hitting 110,000🎉
Use SL if necessary!

ETHUSD pump from here ?? this is my ideaas per my analysis , eth took the weekly supply and wait fortook monklthy supply, on other side dxy in weak condition. so i expect eth going to reach next target 3334.69

bearish reversal off pullback resistance?The Ethereum (ETH/USD) has rejected off the pivot and could drop to the 1st support that aligns with the 61.8% Fibonacci retracement.
Pivot: 2,483.49
1st Support: 2,289.88
1st Resistance: 2,587.09
Risk Warning:
Trading Forex and CFDs carries a high level of risk to your capital and you should only trade with money you can afford to lose. Trading Forex and CFDs may not be suitable for all investors, so please ensure that you fully understand the risks involved and seek independent advice if necessary.
Disclaimer:
The above opinions given constitute general market commentary, and do not constitute the opinion or advice of IC Markets or any form of personal or investment advice.
Any opinions, news, research, analyses, prices, other information, or links to third-party sites contained on this website are provided on an "as-is" basis, are intended only to be informative, is not an advice nor a recommendation, nor research, or a record of our trading prices, or an offer of, or solicitation for a transaction in any financial instrument and thus should not be treated as such. The information provided does not involve any specific investment objectives, financial situation and needs of any specific person who may receive it. Please be aware, that past performance is not a reliable indicator of future performance and/or results. Past Performance or Forward-looking scenarios based upon the reasonable beliefs of the third-party provider are not a guarantee of future performance. Actual results may differ materially from those anticipated in forward-looking or past performance statements. IC Markets makes no representation or warranty and assumes no liability as to the accuracy or completeness of the information provided, nor any loss arising from any investment based on a recommendation, forecast or any information supplied by any third-party.

ETH Daily: Contracting Triangle Nearing Completion – Downside BrPattern Overview
Textbook five-wave contracting triangle (A-B-C-D-E) fully formed
Price compressed between converging trendlines – coiled spring ready to release
Volume steadily declining into apex – classic pre-breakout signature
Multiple indicators point to downside resolution
Technical Analysis
Elliott Wave Structure
Clean 3-3-3-3-3 corrective sequence confirmed
All waves respect triangle rules: C < A, D < B, E < C
Converging boundaries create pressure for explosive move
Timing Analysis (Neely Method)
Triangles complete within 60-80% of A-to-apex timespan
ETH now sits directly in this critical window
Resolution expected within 4-6 weeks maximum
Price Projection Methods
Largest Wave Rule: Thrust often equals biggest internal leg → Target: $1,350 then $900
Minimum Line Rule: Must exceed lowest triangle point (~$880) for valid thrust
Fibonacci Extension: 0.75-1.25x of C-D height → Extended targets: $750-$300
Key Levels & Targets
Support Break: Pink trendline (see chart)
Initial Target Zone: $1,200-$900
Extended Targets: $600-$300 if momentum builds
Invalidation: Close above upper resistance line
Trading Strategy
Entry: Daily close below rising support line
Target 1: $1,200-$900 (confluence zone)
Target 2: $600-$300 (1.25 fib extension)
Stop Loss: Re-entry into triangle after breakdown
Risk Management: Small position size, use trailing stops, monitor ETF flows
Market Context
Triangle maturity suggests imminent resolution
Volume expansion will confirm breakout direction
Watch for macro catalysts that could accelerate move
ETF decisions and regulatory news remain wildcards
Action Plan
Triangle has exhausted time – breakout window is NOW
Technical evidence strongly favors downside
Wait for clean break with volume confirmation
Prepare for potential cascade to three-digit prices
Stay disciplined – let the market prove the direction


ETH Pushed Back, Support in Sight
ETH on the 4H just closed below the last daily close and the 0.5 Fib again, after getting pushed back from the 4H 200MA and daily 200MA resistance zone.
The next key supports are the weekly 200MA and the local support zone.
Also worth noting: Trump and Musk are stirring things up again. The last time this dynamic appeared, it triggered a selloff a few weeks ago, even before the conflict began.
Always take profits and manage risk.
Interaction is welcome.

ETHUSD POTENTIAL LONGETHUSD potential bullish setup ↗️
ETH still showing bullish momentum. Might bounce on the bullish trend line, for now it’s hasn’t done the third touch so expect it go lower to the trendline first. A strong bullish confirmation would be a signal to go LONG. Share your thoughts on this in comment section.
