Why ETH Might Get Rejected... AgainThere are several reasons to believe ETH will get rejected from this area once again:
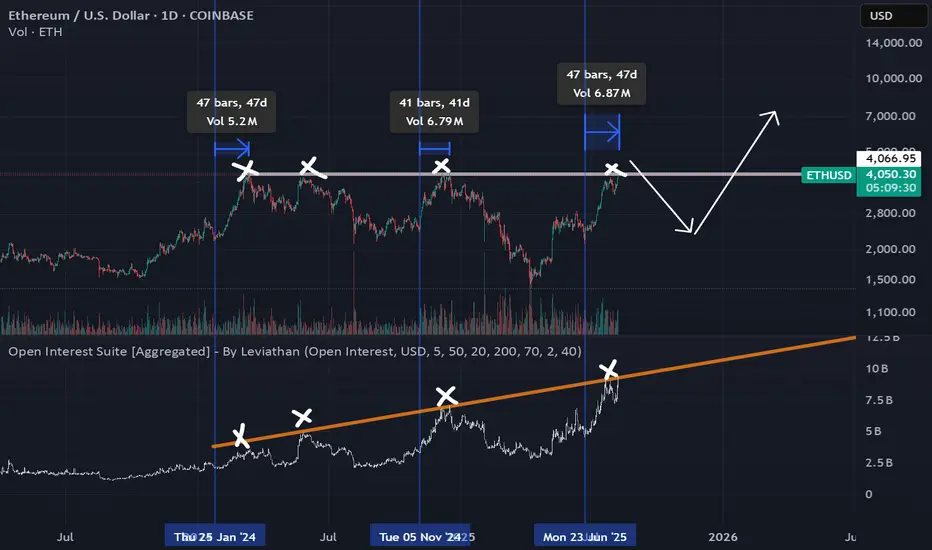
1_Open interest is extremely high, meaning everyone’s borrowing money to add even more to their long positions. That’s definitely not healthy for a sustained uptrend. We might see a “staircase up, elevator down” type of move soon.
2_This rally is way overextended — we’ve been in a parabolic uptrend with no meaningful correction for the past 47 days. It's been a consistent pattern of higher lows and higher highs. We need at least 2–3 weeks of downtrend to regain strength for another solid move upward.
3_There’s no real fundamental news backing this move. There’s the 401(k) Trump order, but that mostly affects BTC — and even then, it would take ages for any actual money to hit the market (if it ever does). This ETH pump is mostly driven by FOMO — people buying just because others are buying ETFs. Pure hype about ETH hitting some fantasy number in the future.
4_Seasonal weakness matters — I highly doubt ETH can break through major resistance during the summer, especially in a historically bearish month like August.
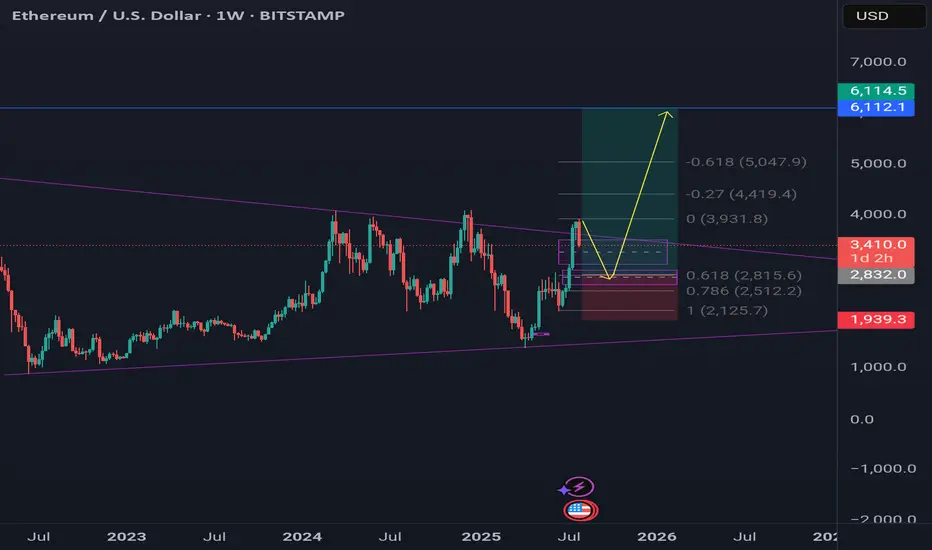
I expect a correction wave to the downside — at least somewhere bellow the $3,350 area( Why 3350? because it's most recent higher low) . We might get a fakeout above $4,100 before that happens. From there, we can reassess the market to see if it’s ready to finally take out that $4,100 resistance or not.
ETHUSD trade ideas
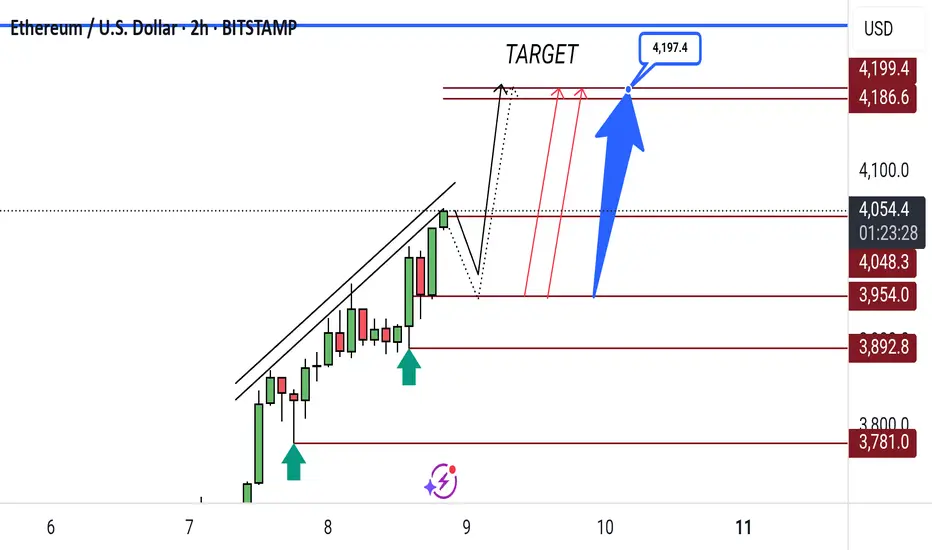
ETH/USD Bullish Breakout Targets 4,197Ethereum (ETH/USD) is showing bullish momentum on the 2H chart, with price targeting the 4,197 level after breaking above the channel. Key supports are at 4,048 and 3,954.
Ethereum Breakout Targeting $3,705ETH/USD 1H Analysis:
Price broke out of the falling wedge pattern and is showing signs of bullish reversal. Key resistance levels are at $3,581 and $3,647, with a target set at $3,705. Support holds near $3,555. Potential for upward continuation if momentum sustains.

Ethereum (ETHUSD): All Time High Ahead📈Ethereum has successfully broke above an important daily resistance level today.
The next major resistance is base on the All Time High.
I anticipate the market will continue to rise towards the 4800 level, but I prefer to wait for a pullback to buy on a retest of the broken structure.

ETHEREUM - NEW BREAKOUT!Hello Traders!
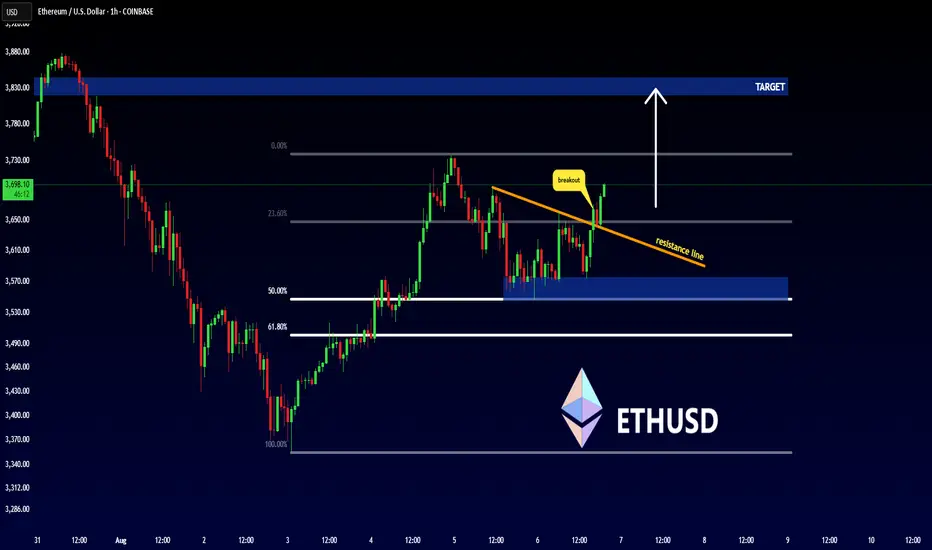
The Ethereum price reached the 50% fibonacci retracement level!
The price broke the resistance line!
So, I expect a bullish move🚀
___________
TARGET: 3820🎯
The Unicorn Breakout Part II – Ethereum at $4K, Queen of Crypto🦄👑 The Unicorn Breakout Part II – Ethereum at $4K, Queen of Crypto 📈♟
I’ve had a lot of conversations these past months.
Some friends told me ETH had no power, no influence.
One even called it the “bitch coin.”
Others insisted it lacked dynamics, that it was doomed to trail behind Bitcoin forever.
But the chart… the chart said otherwise.
That’s why, as a trader, so often I close my ears and follow the chart.
📜 The Recap
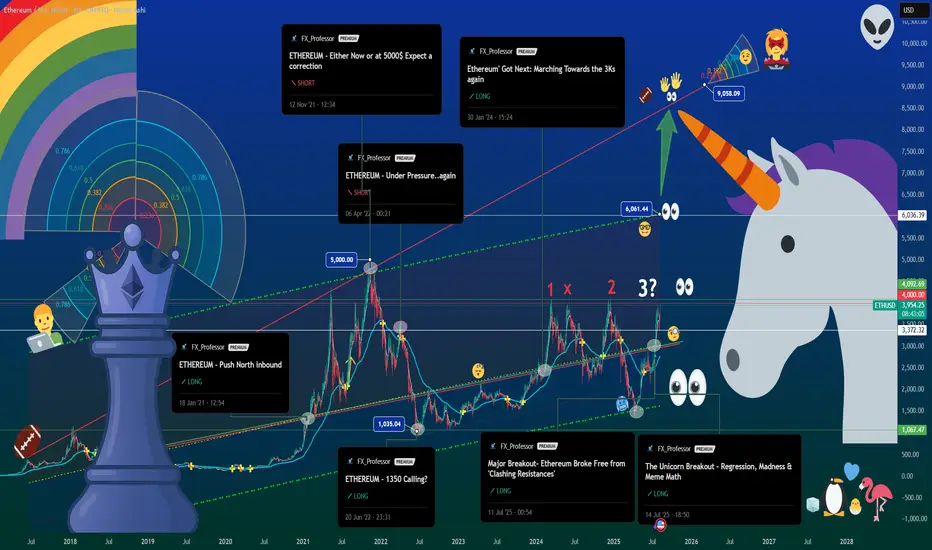
From “Push North” in 2021, to the “1-2-X” setup, and the July Unicorn prophecy, ETH has kept its dance inside the quadratic regression channel for over 7 years.
In Part I, we called $4,000 the first milestone. Now, it’s reality.
♟ Bitcoin is King, Ethereum is Queen
With recent leadership changes bringing renewed energy and sharper marketing, plus the Petra upgrade quietly powering under the hood, ETH is stepping into the place it deserves. The queen is the most powerful piece on the chessboard — and in this market, Ethereum is moving exactly like one.
📊 What’s Different This Time
-Network activity is pushing toward record levels.
-Transaction counts are surging, signaling deeper engagement.
-The ETH vs BTC conversation is back, and capital rotation is happening in real time.
🛠 Levels I’m Watching:
$4,092 – Current resistance zone.
$6,034 – Mid-regression line, the next battleground.
$8,674 – Unicorn Zone. Euphoric breakout territory.
$3,372 – Short-term support. Below here, $2,912 is on deck.
💙 The Human Note
This run is proof: conviction matters. Sometimes the crowd is wrong, the noise is deafening, and the chart is the only friend that tells the truth.
Trade with discipline, but live with intention. Spend time with those you love. Build things worth remembering. And when you play the game, know when to move your queen.
The Unicorn has hit $4K. The Queen has entered the center.
Next move? Checkmate at $6K? We’ll see.
One Love ,
The FX PROFESSOR 💙
Disclosure: I am happy to be part of the Trade Nation's Influencer program and receive a monthly fee for using their TradingView charts in my analysis. Awesome broker, where the trader really comes first! 🌟🤝📈
MTF 2nd bearish macro outlook on Eth, final wave of (Y) coming?This is an idea I've had for a while (unpublished) but looking at local structure, I have to revive this..
It's a very rare expanding triangle idea as the Y wave of the macro WXY wave.
The December 2024 high took out the March 2024 high. And, it's not uncommon, especially in crypto, for B/W wave to take out the previous high (i.e. overshoot). But, considering that the pink a-b-c-d-e's April 2024 low (c) hit the exact 1.618 extension, and the high likelihood of (d) about to hit 4k+ and overshoot the December high of 2024, there is a likelihood that you're seeing an expanding triangle play out.
If you see a rejection at previous December 2024 high (i.e. a swing failure pattern), you must entertain the idea of expanding triangle at the very least.
The unfortunate part is, if this is true, the (e) wave has a huge range, from ~$1400 to $700. The minimum requirement of (e) is to take out the (c) low but can extend to 1.618 at $700.
Will have to see the local structure playout once we get close to (c) or below.
More evidence for expanding triangle is the volume and the open-interest. From March 2024, volume has been steadily increasing (not visible on Bitstamp chart here, but go look at Binance Ethereum chart, for example) and open-interest has been increasing since March 2024, all the while price has kept peaking at ~$4k. For bulls, this should be very concerning as it means the kettle's been boiling hotter and hotter and the pressure's been building up - and long-to-short ratio is still very much positive. A swing failure pattern at (d) and with late longs entering in the market at the peak, it's possible a cascade of liquidation could result in a quick move down to (e).

ETH watch $4238.73: Semi-Major Genesis fib to slow/stop SurgeShown here is a single fib series in 3 different timeframes.
The "Genesis Sequence" has called all major turns since 2015.
$4238.73 is a "Semi-Major" fib Ratio so it will be quite strong.
It is PROBABLE that we orbit this fib a few times.
It is POSSIBLE that we reject and form a local top.
It is PLAUSIBLE that we Break-n-Retest to continue.
See "Related Publications" for previous analysis ---------->>>>>>>>>>>

ETHUSD Break- Test- GO!!! Nothing Changed! 3rd EditionI have been warning about this for some time. Please visit my previous two posts for more info and updates.
Magic!
Click boost, follow, and subscribe for more. Let's get to 5,000 followers ))

Ethereum - Finally new all time highs!🔬Ethereum ( CRYPTO:ETHUSD ) will break out now:
🔎Analysis summary:
For more than four years, Ethereum has overall been moving sideways. However now Ethereum is once again retesting previous all time highs and preparing a bullish breakout. Multiple retests are generally considered bullish so the breakout is very likely to happen any time soon.
📝Levels to watch:
$4.000
🙏🏻#LONGTERMVISION
SwingTraderPhil

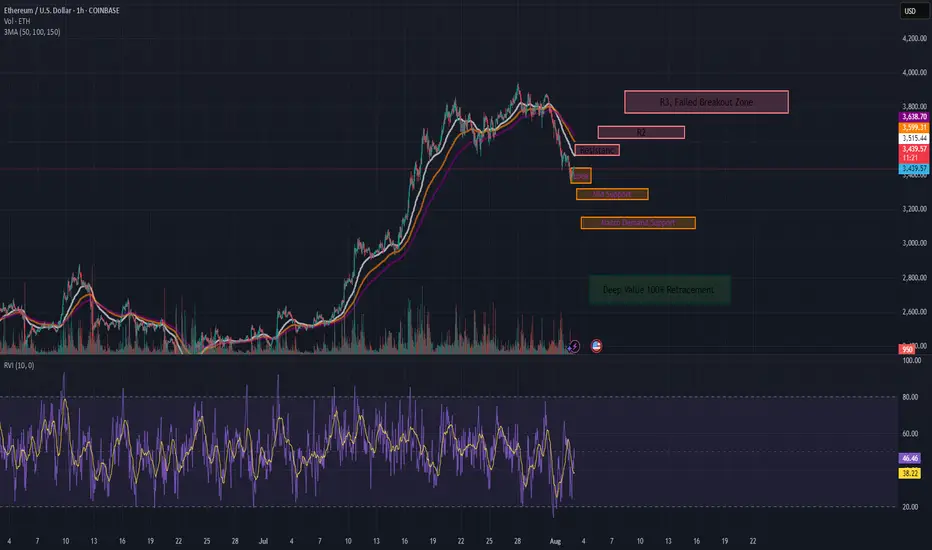
ETH Tactical Long: Laddered Bounce from Absorption ZoneCOINBASE:ETHUSD has been in a steady 1H downtrend, but key support at $3,440 is showing signs of absorption. Volume is thinning on sell-offs, and we're seeing early reversion signals.
This is my over the weekend analysis, not a final recommendation.
Setup Type: Mean Reversion / Absorption Bounce
- Trend: Still bearish on 1H (below 50/100/150 MAs), but slope compression hints at weakening
momentum
- RVI: Below 50, but curling up → early bounce bias
- Volume: Sellers fading into $3,440 = buyer absorption zone
📊 1hr Quant Entry Levels & Laddered Plan
Zone Type Action
$3,440–3,435 Primary Entry Base long entry zone 🔄
$3,420–3,410 Add-on Entry Optional bid stack 🧱
$3,320 Soft Invalidation Trend continuation if lost 🚫
$3,150 Deep Value Wick Low-prob, high-juice trap 💎
🎯 Targets:
T1: $3,515 → EMA cluster rejection zone
T2: $3,600–3,638 → Range midpoint
T3: $3,800 → Trend reversal if reclaimed
⚖️ Risk/Reward: 1:2.5+ (depends on fill ladder)
We are starting entries here, but be cautious if we break through our support levels and you don't have the appetite for the deep value range it may be wiser to wait for a confirming trend or post.
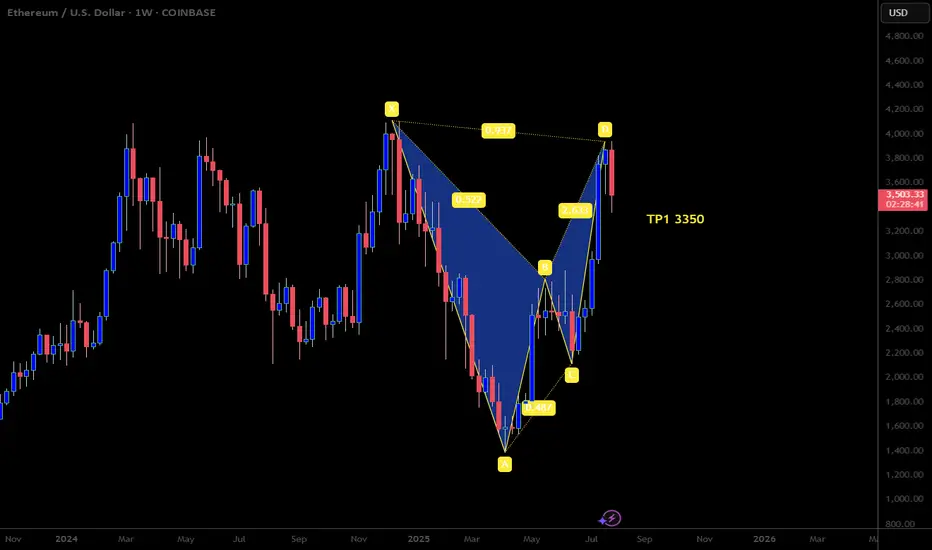
Bearish Bat Pattern on ETHUSDLooking to continue selling here with this beautiful harmonic bat pattern that just formed. We also got a bearish candle close on the weekly timeframe which gives us solid sells confirmation. Happy Trading
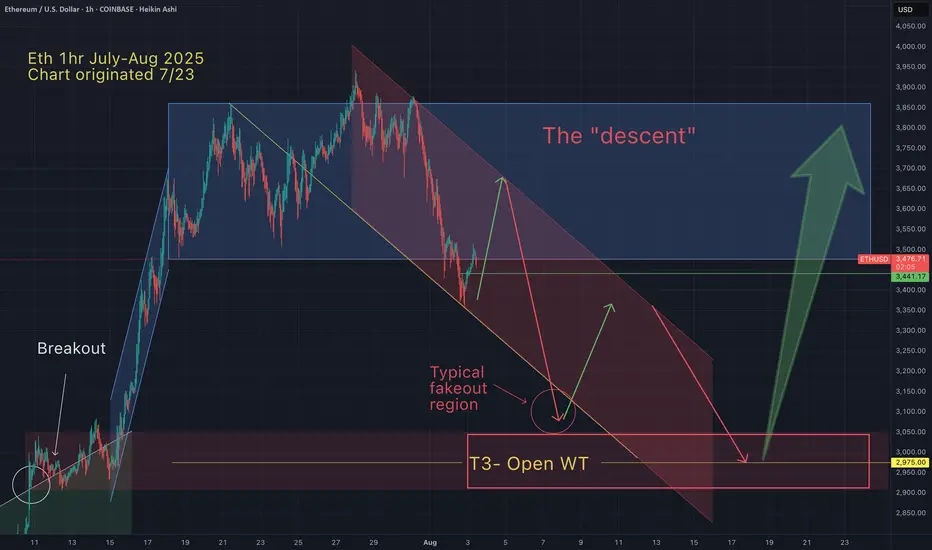
Eth - An aticipated path of continued downward price actionThis is just a thought eperiment based on years of watching patterns repeat.
I like to anticipate price action so I know if/when my trading ideas are being invalidated.
Regardless of the actual path downward, I'm still holding out for $3K or less.
May the trends be with you.
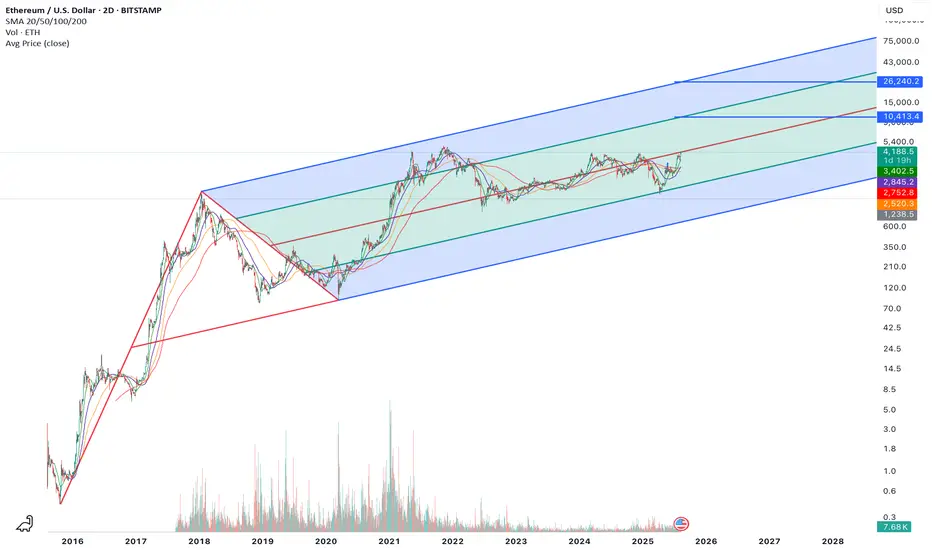
Ethereum’s $26K Path: Pitchfork Precision Meets 401(k)🚀 Ethereum’s $26K Path: Pitchfork Precision Meets 401(k) Mega Capital Inflows
Ethereum’s long-term pitchfork structure — stretching back nearly a decade — has been an uncannily accurate roadmap for the asset’s entire price history. Every major bull run and retracement has respected these channel boundaries with surgical precision. And now, the math points to a euphoric cycle peak near $26,240.
But here’s what’s different this time: a perfect storm of structural, macro, and legislative catalysts could fuel the most explosive Ethereum rally in history.
1️⃣ The Technical Blueprint: ETH’s Pitchfork to the Moon
The chart above speaks for itself:
Multi-cycle median line respect → Every parabolic move in ETH has peaked near the upper bound of this pitchfork.
2025 setup mirrors 2017 & 2021 → Both prior cycle expansions occurred from near the lower channel up to the upper band within 12–18 months.
Current positioning → ETH is breaking away from the midline, with momentum building toward the $10.4K resistance area before a final euphoric move to the $26K upper band.
2️⃣ The Game-Changer: Trump’s 401(k) Executive Order
On August 7, 2025, President Trump signed an executive order allowing 401(k) retirement plans to invest directly in private equity — and by extension, in private tokenized assets and alternative vehicles that can include crypto exposure.
Why this matters for Ethereum:
$7.3 trillion 401(k) market in the U.S. alone.
Even a 1% allocation into ETH through tokenized or pooled products equals $73 billion in demand — over 25% of ETH’s current market cap.
Coupled with upcoming Ethereum-based private market tokenization rails, this could create persistent retirement-driven demand that never existed before.
3️⃣ Ethereum’s Unstoppable Macro Tailwinds
Beyond the 401(k) shockwave, ETH’s macro positioning has never been stronger:
BlackRock’s Ethereum staking ETF pending SEC approval — opening the floodgates for institutional inflows.
Ultra-sound money supply mechanics — ETH’s burn rate has outpaced issuance in multiple months, meaning supply is shrinking while demand is about to accelerate.
Tokenization megatrend — Real estate, private credit, and commodities are increasingly issued on Ethereum rails, boosting transaction demand and fee burns.
Layer 2 explosion — Rollup adoption is pushing more economic activity onto Ethereum, while fees and settlements still flow to ETH validators.
4️⃣ The Cycle Anatomy: How $26K Happens
If history rhymes, here’s how the final leg could unfold:
Breakout to $6K–$7K as ETF approval and 401(k)-related flows kick in.
Acceleration to $10.4K — the mid-pitchfork resistance — as retail and media hype return.
Parabolic blow-off into the $20K–$26K zone as institutional + retirement inflows collide with ultra-low liquid supply.
5️⃣ Why This Time Could Overshoot
Unlike past cycles, Ethereum now sits at the intersection of:
Institutional-grade adoption (BlackRock, Fidelity, JPMorgan)
On-chain structural scarcity (post-merge burn dynamics)
Legislative green lights (401(k) access to alternatives)
Global macro rotation into risk assets as interest rates pivot
If prior cycles were crypto’s “dot com era,” this one is the mobile internet + cloud migration phase — except ETH is the protocol on which everything runs.
Bottom line:
The $26K target isn’t just a chartist’s fantasy — it’s a mathematically reinforced roadmap now backed by the largest pool of retirement capital in the world.
Ethereum is no longer just “digital oil.” With this convergence of technical, macro, and legislative forces, it’s becoming the primary settlement layer for global finance — and this cycle could be the moment the market finally prices that in.
Ethereum 6000Ethereum is heading towards the ceiling of the $6,000 range channel. Do not open a sell trade under any circumstances.
4800
5200
5800
6200

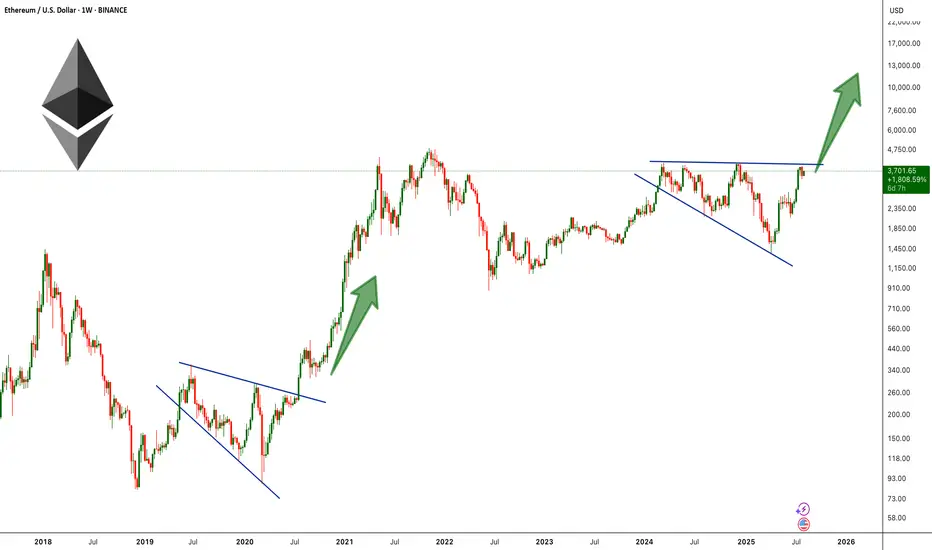
ETH Broadening Wedge Formation !BINANCE:ETHUSDT is forming a broadening wedge pattern on the weekly chart, a structure that often signals high volatility and strong momentum once the price breaks out. This setup is reminiscent of ETH’s 2019–2020 pattern, which also formed as a broadening wedge before breaking to the upside and triggering a historic rally to new all-time highs.
Currently, ETH is pressing against the upper resistance line of the wedge near the $3,900–$4100 zone, a level that has acted as major resistance multiple times in recent months. A decisive breakout above this barrier could ignite strong bullish momentum, opening the path toward the $6,000–$10,000 range.
Cheers
Hexa
ETHUSD previous resistance , new support at 3,807The ETHUSD remains in a bullish trend, with recent price action showing signs of a resistance breakout, within the broader uptrend.
Support Zone: 3,807 – a key level from previous consolidation. Price is currently testing or approaching this level.
A bullish rebound from 3,807 would confirm ongoing upside momentum, with potential targets at:
4,085 – initial resistance
4,166 – psychological and structural level
4,226 – extended resistance on the longer-term chart
Bearish Scenario:
A confirmed break and daily close below 3,807 would weaken the bullish outlook and suggest deeper downside risk toward:
3,732 – minor support
3,650 – stronger support and potential demand zone
Outlook:
Bullish bias remains intact while the ETHUSD holds above 3,807. A sustained break below this level could shift momentum to the downside in the short term.
This communication is for informational purposes only and should not be viewed as any form of recommendation as to a particular course of action or as investment advice. It is not intended as an offer or solicitation for the purchase or sale of any financial instrument or as an official confirmation of any transaction. Opinions, estimates and assumptions expressed herein are made as of the date of this communication and are subject to change without notice. This communication has been prepared based upon information, including market prices, data and other information, believed to be reliable; however, Trade Nation does not warrant its completeness or accuracy. All market prices and market data contained in or attached to this communication are indicative and subject to change without notice.

possible long position if it breaks aboveit could be a good idea to wait for re-test after it breaks, could be volatile 24hticker
Ethereum Ready for New All Time HighEthereum's protracted consolidation between $2,000 and $4,000 over the past four years appears to be reaching a critical juncture. This extended period of sideways movement has built significant potential energy, suggesting that the market is coiling for a substantial breakout. Technical indicators are hinting at an imminent end to this consolidation phase, with increasing bullish momentum. Should Ethereum decisively break through key resistance levels, a rapid ascent towards the $10,000 mark by the end of the year becomes a distinct possibility. The duration of this consolidation underscores the magnitude of the anticipated move, making Ethereum a key asset to watch for substantial gains.
Anticipation is building for a potential surge towards the $10,000 mark by the end of the year. Several factors underpin this bullish outlook, including increasing institutional interest, the ongoing development and adoption of Ethereum's Layer-2 scaling solutions, and the continued growth of the decentralized finance (DeFi) ecosystem. The upcoming Fusaka upgrade, expected in late 2025, which aims to significantly reduce Layer-2 costs through Peer Data Availability Sampling (PeerDAS), is also contributing to optimistic price predictions. If Ethereum can maintain its current momentum and break through key resistance levels, the $10,000 target remains a distinct possibility.

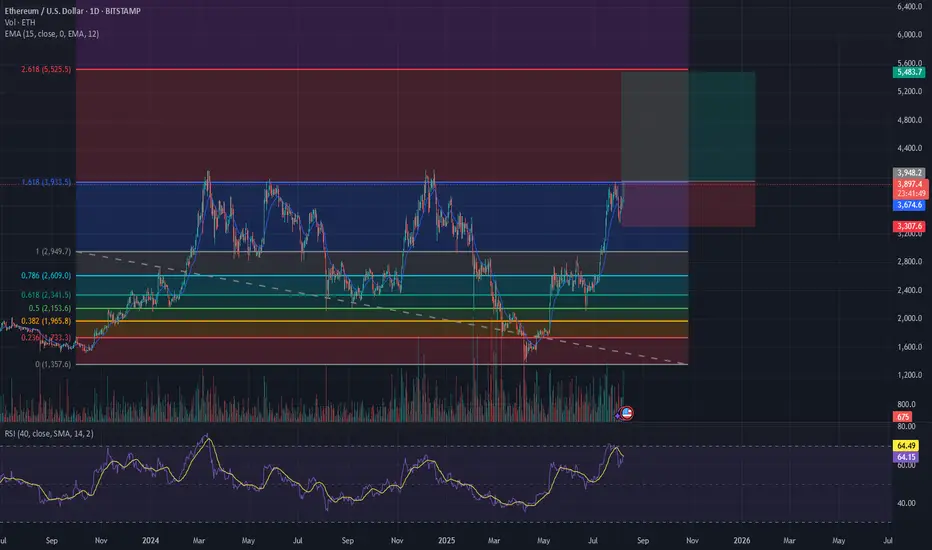
ETH LongETH pulled back to .5 fib on daily which is also near the EMA20 and max pain for long (3,553). I'm expect price to move up from here or dip to the .618 level at the most (~3,500).
Trade: Using ETHU (2x lev ETF). Setting stop loss just below 3,500. Initial TP 3,825 and will use a trailing stop to lock profit in along the way. Ideally, I will let this trade run to $4-6k range if the momentum is strong.

ETHER send it higher and higher and higher.Ether is not going anywhere without makin a new all time high.
Soon 6k ether and even 10k .
The sleeping giant is waking up and when it fully awakes ,it will obliterate everyone.
ETH short term upside to 3700? Eth has been rejected by the demand zone (support level) multiple times and broke out a triangle pattern. We should see short term upside for now in my opinion.

ETHUSD formed a bearish bat patternOn the daily chart, ETHUSD formed a bearish bat pattern. The price is currently declining, with the first downside target around 3082 (0.382 ratio of CD), and the second target around 2831 (0.618 ratio of CD).
