ETHEREUM Massive rally up ahead.Ethereum (ETHUSD) is trading on its 1M MA50, having recovered half of the Trade War losses. Still underperforming against most of its peers but as we've entered the 2nd half of the year, the traditional Bull Cycle rally is up ahead. We expect at least a 0.5 Fibonacci level test of the Channel Up, targeting 7500.
-------------------------------------------------------------------------------
** Please LIKE 👍, FOLLOW ✅, SHARE 🙌 and COMMENT ✍ if you enjoy this idea! Also share your ideas and charts in the comments section below! This is best way to keep it relevant, support us, keep the content here free and allow the idea to reach as many people as possible. **
-------------------------------------------------------------------------------
💸💸💸💸💸💸
👇 👇 👇 👇 👇 👇
ETHUSD trade ideas

Bitcoin & Ethereum New Quarter | What To Look For🎯 New Quarter For COINBASE:BTCUSD & COINBASE:ETHUSD — What To Look For
As we enter a new quarter, smart money is already positioning.
Institutional investors, hedge funds, and asset managers don’t just trade price — they rotate capital based on quarterly performance, risk appetite, and macro expectations. That’s why each quarterly open is a key inflection point across all markets — including crypto.
In this video, I break down:
• 🧠 How institutional capital rotation impacts Bitcoin and Ethereum
• 📈 Key levels to watch as Q3 unfolds
• 🔁 What are the likely outcomes
• 📊 How to prepare for volatility and new trend formation
This isn’t just another candle — it’s the start of a new chapter in the cycle.
If you’re serious about understanding where the money flows next , this video is for you.
This is the likely outcome
Price not ready to moon yet
Strong candle implying new highs incoming
Watch for bearish stop hunt on new quarter
This is a bullish outside bar
MartyBoots here , I have been trading for 17 years and sharing my thoughts
👍 Enjoyed the insights?
Let me know your thoughts in the comments below — and don’t forget to like this post to support the channel!

(ETH/USD) Bullish Setup: Entry at $2,422 with Target at $2,521 a1. Entry Point: ~2,422.2
This is the suggested buy area based on a recent bounce from the support zone
2. Support Zone (Purple Box):
Bottom boundary: ~2,392.4
Top boundary: ~2,408.4
Price has bounced multiple times here, showing strong buying interest.
3. Resistance Point: ~2,463.9
A clear horizontal resistance line, previously tested.
4. EA Target Point: ~2,522.1
A bullish target if the price breaks above the resistance level.
🔶 Highlighted Patterns / Markers
Orange Circles: Indicate key swing highs and lows — possibly used to identify double tops/bottoms or rejection/wick zones.
Blue Arrows: Illustrate the anticipated move from:
Entry (2,408.1) → Resistance (2,463.9) → Target (2,521.2)
Target gain = +111.7 USD (+4.64%)
🔻 Stop Loss Level
Set just below the support box at ~2,392.4
Protects from false breakouts or deeper pullbacks.
📈 Strategy Outlook
Bullish Bias: The setup expects a breakout from the current price range.
Risk-Reward Ratio: Appears favorable — tight stop and wide target.
Confirmation Needed: A solid breakout and hold above 2,423–2,425 may be the early confirmation signal.
📌 Summary
Element Value
Entry Point ~2,422.2
Stop Loss ~2,392.4
Resistance ~2,463.9
Target (TP) ~2,521.2
R:R Ratio Approx. 3:1
Bias Bullish

ETH one more Dump Before Parabolic Move!We see the 200 EMA crossing the 50 EMA which is a bearish sign, also eth is respecting the descending broadening wedge formation that has played out. I see eth doing one more dive to collect the vector zones mapped out below our current price action, and bouncing around 1900 before going absolutely insane this will be one last scary drop to shake out the weak hands and trap all the late longs from the runup from 1800 to about 2600. This will wreck all the people who bought between 2400-2800 and cause them to sell, allowing big players to buy more Eth at low prices before the altseason kicks in full gear by late summer.

IS Ethereum AWAITING A MAJOR CRASH? CRASH TO USD 660 ? THE GREAT EARTHQUAKE OF THE CRYPTO WORLD IS COMING, WINTER IS COMING, JUNE 28, 2025... THE BIG SHORT !
Technical analysis of Ethereum, which is introduced as the silver of the crypto world, shows that a serious crash infrastructure has formed.
1. The most important technical data is the formation of a double top formation in monthly-weekly charts.
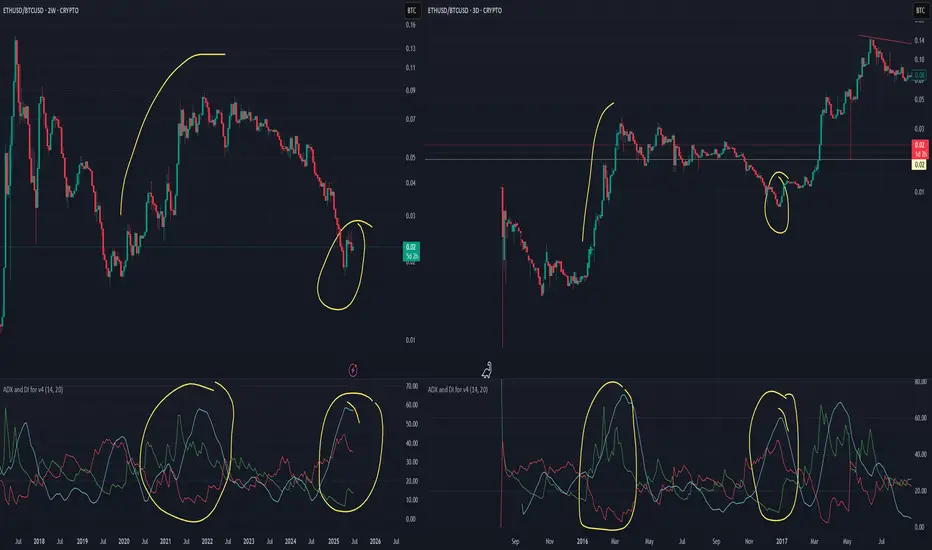
2. The low performance it has shown against the rise of Bitcoin is remarkable.
3. Again, it is the gartley pattern that is operated insidiously in long-term charts.
1. Target: 660 USD (I expect a reactive buying reaction that will then extend to 1200 dollars)
2. Target: 66 USD (It's embarrassing to say this, but the crypto world is a soap bubble. However, I personally do not see Ethereum as an investment vehicle in the long term.)
I AM AWARE THAT MAKING A 66 DOLLAR ETHEREUM ANALYSIS ON JUNE 28, 2025 IS A CRAZY THING, BUT I THINK THIS DOWN FORMATION HAS BEEN FORMED.
IT SEEMS THAT SIX IS A LUCKY NUMBER FOR MR. Vitalik . WHAT ABOUT YOU?
THIS IS NOT AN INVESTMENT ADVICE. IT IS ONLY A FINANCIAL PERSONAL STUDY FOR EDUCATIONAL PURPOSES. IT IS A PERSONAL ESTIMATE. THERE IS ABSOLUTELY NO GUARANTEED ACCURACY. ALL INVESTORS MUST MAKE THEIR OWN ANALYSIS.

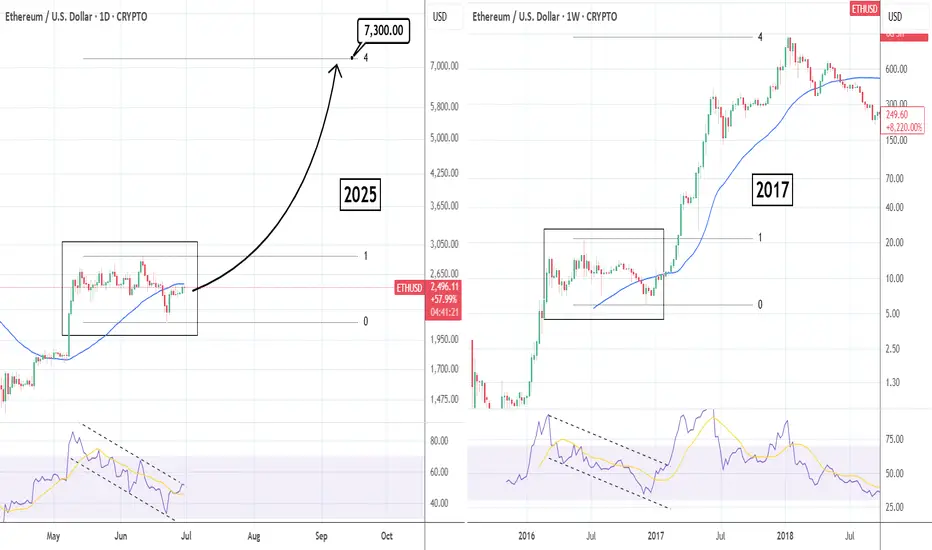
ETHUSD: Parabolic rally similar to 2017 targets $7,300Ethereum is neutral on its 1D technical outlook (RSI = 50.960, MACD = -24.810, ADX = 18.527), attempting to break over the 1D MA50, while still being inside a 6 week consolidation. This is no different than the 2016 consolidation on the 1W chart, that turned out to be just an accumulation pattern before a massive 2017 bullish breakout to the 4.0 Fibonacci extension. Time to go heavily long on ETH with TP = 7,300.
## If you like our free content follow our profile to get more daily ideas. ##
## Comments and likes are greatly appreciated. ##
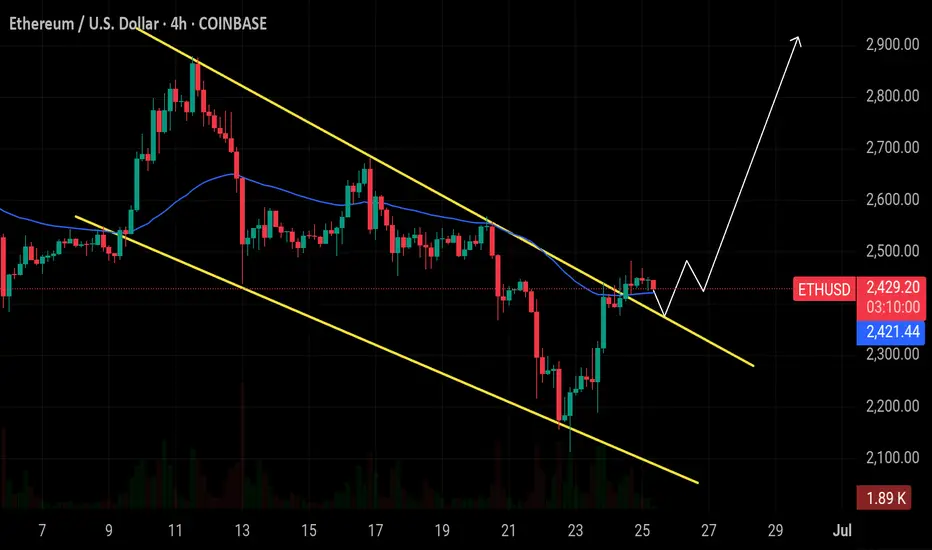
$ETH 4H Falling Wedge Breakout: Ethereum has successfully brokeCRYPTOCAP:ETH 4H Falling Wedge Breakout:
Ethereum has successfully broken out of a clear falling wedge pattern on the 4-hour timeframe, signaling a potential trend reversal from bearish to bullish. ✅
🔸 Support at $2,400 – $2,380:
After the breakout, ETH is holding above the wedge and this support area. This zone will be crucial for confirming the breakout's strength.
🔸 Upside Target: $2,800
If momentum continues, ETH could rally toward $2,600 first, followed by a move to the $2,800 level as shown by the projection in the chart.
🔸 Risk Level at $2,300:
If ETH dips below $2,300 and re-enters the wedge, it could invalidate the breakout setup and lead to downside pressure.
🔸 Outlook:
Watch for a retest of the breakout trendline (around $2,420) with bullish confirmation (like a strong wick or engulfing candle) to consider long positions. Target higher levels gradually while managing risk.
Ethereum monthly cup and handleSoooo, this is my first post, and I'm not really too sure if I'm seeing this correctly, can somebody please explain to me why I'm wrong or if I'm right. Cuzzzzz this seems extremely bullish to me.
This is on the monthly timeframe, so this projection is for closer to November - February, IMO...
AM I SEEING THIS CORRECTLY, or is this my bullish personality shining through.

ETHEREUM Perhaps the easiest long out there.Ethereum (ETHUSD) is consolidating just above the Buy Zone of the Mayer Multiple Bands (MMBs) where it rebounded on its April bottom.
Throughout its historic price action, every time it hit this Zone and rebounded, it reached at least the bottom of its Mean MM zone (red Zone).
As a result, $4000 towards the end of the year may be the easiest Target in the market right now.
-------------------------------------------------------------------------------
** Please LIKE 👍, FOLLOW ✅, SHARE 🙌 and COMMENT ✍ if you enjoy this idea! Also share your ideas and charts in the comments section below! This is best way to keep it relevant, support us, keep the content here free and allow the idea to reach as many people as possible. **
-------------------------------------------------------------------------------
💸💸💸💸💸💸
👇 👇 👇 👇 👇 👇

All Time Schiff Pitchfork: ETH to $26k this cycleEthereum’s All-Time Schiff Pitchfork Points to $26,000 Top This Cycle
What if I told you Ethereum’s long-term trajectory already contains the roadmap to its next parabolic peak—and it's hiding in plain sight?
By applying an all-time Schiff Pitchfork to ETH’s historical price action, we uncover a channel of truth that has guided Ethereum’s macro moves since its inception. And according to this structure, the upper bound this cycle sits around $26,000.
Yes, $26K ETH is not only possible—it’s technically aligned.
🧭 Schiff Pitchfork: A Forgotten Tool With Powerful Insight
While traditional pitchforks center around initial anchor points, the Schiff Pitchfork adjusts the median line to better reflect price momentum and curvature over time. For Ethereum, it captures macro cycles and logarithmic price evolution with eerie accuracy.
We anchor the pitchfork as follows:
Point A: March 2020 COVID bottom (~$90)
Point B: May 2021 cycle top (~$4,400)
Point C: June 2022 bottom (~$880)
This sets a median growth trajectory with upper and lower bounds that have so far contained all of Ethereum’s major rallies and retracements.
📈 The Pitchfork Speaks: $26K = Upper Rail This Cycle
The upper boundary of the pitchfork intersects around $26,000–$27,000 between November 2025 and January 2026
This aligns with:
Cycle timing: Ethereum typically peaks ~8 months after Bitcoin
Macro window: Projected end of global liquidity expansion before potential recession
ETF catalyst: BlackRock’s staking ETF + TradFi inflows could supercharge final leg
ETH/BTC breakout zone: Suggests ETH will outperform BTC in the late stage of the cycle
If Ethereum follows the historical path set by prior cycles (2017, 2021), and this channel remains valid, then $26K ETH becomes a technical magnet, not a fantasy.
🧠 Why $26K Isn’t Just a Chart Target
Let’s break down what would justify that kind of valuation:
Factor Supporting Insight
🟢 Staking ETF Institutional demand + ETH supply removed from float
🔥 Deflationary Tokenomics Post-1559 burn + staking = net negative issuance
⚙️ L2 Ecosystem Maturity Rollups, zkEVMs, and restaking create multi-chain ETH demand
🌐 Global Liquidity Window Fed cuts + soft macro conditions = floodgates open
📈 ETH/BTC Ratio Inversion Signals capital rotation to high beta assets
🛑 Risks to the $26K Scenario
Regulatory delays on staking ETF
Broader market crash or macro liquidity crunch
ETH/BTC fails to break out, Bitcoin dominance remains too high
Ethereum scaling and L2 fragmentation cannibalizes fee market faster than expected
🎯 Price Zones on the Schiff Pitchfork
Zone Price Range Interpretation
Lower Bound $3,000–$4,000 Final dip buy zone (if macro spooks)
Median Line $10,000–$14,000 Base case target with ETF flows
Upper Rail $25,000–$26,500 Max cycle top (Q4 2025–Q1 2026)
🧬 Conclusion: The Channel Has Spoken
The Schiff Pitchfork isn’t a magic wand—it’s a map. But Ethereum has respected this structure since 2020, and it’s now approaching the most important confluence zone in its history.
With ETFs, L2 scaling, deflationary supply, and a maturing institutional narrative, ETH has the fundamental firepower to make $26K real—not just chart art.
This may be the final cycle where ETH 4-digit prices are possible.
📊 Follow for more Ethereum macro cycle analysis, ETH/BTC tracking, and altseason models.
📍 Chart available on request—drop a comment if you'd like the TradingView link with Pitchfork drawn
#Ethereum #ETHUSD #PitchforkAnalysis #SchiffPitchfork #CryptoCycles #ETHPrediction #Altseason #ETHChart #ETH26K

ETHUSD - Could ETH hit $800 before the next bull run?ETHUSD looks very bearish in my opinion. Strong bearish divergence on the MACD. Any substantial time ETH has stayed under the MACD zeroline has lead to very bearish price action. This price recovery is currently hitting very strong resistance area. With the Israel/Iran war looming, and the deflationary crash risks with oil dumping, I'm getting very defensive sentiment at this moment. I'll be in cash until we get further confirmation on the price action.

bearish reversal off pullback resistance?The Ethereum (ETH/USD) has rejected off the pivot and could drop to the 1st support that aligns with the 61.8% Fibonacci retracement.
Pivot: 2,483.49
1st Support: 2,289.88
1st Resistance: 2,587.09
Risk Warning:
Trading Forex and CFDs carries a high level of risk to your capital and you should only trade with money you can afford to lose. Trading Forex and CFDs may not be suitable for all investors, so please ensure that you fully understand the risks involved and seek independent advice if necessary.
Disclaimer:
The above opinions given constitute general market commentary, and do not constitute the opinion or advice of IC Markets or any form of personal or investment advice.
Any opinions, news, research, analyses, prices, other information, or links to third-party sites contained on this website are provided on an "as-is" basis, are intended only to be informative, is not an advice nor a recommendation, nor research, or a record of our trading prices, or an offer of, or solicitation for a transaction in any financial instrument and thus should not be treated as such. The information provided does not involve any specific investment objectives, financial situation and needs of any specific person who may receive it. Please be aware, that past performance is not a reliable indicator of future performance and/or results. Past Performance or Forward-looking scenarios based upon the reasonable beliefs of the third-party provider are not a guarantee of future performance. Actual results may differ materially from those anticipated in forward-looking or past performance statements. IC Markets makes no representation or warranty and assumes no liability as to the accuracy or completeness of the information provided, nor any loss arising from any investment based on a recommendation, forecast or any information supplied by any third-party.

ETH could be about to rip into a short-term rallyWhile the stock market has seen surprising upside in the past weeks (presumably due to pricing in rate cuts / a more positive liquidity picture / high expectations for Q2), crypto has lagged behind. I don't believe anything significantly above current prices - no matter in which market - is sustainable for now, but we can certainly milk it for whatever it's worth.
Notably, BTC has shown way more resilience and dominance in the current cycle so far. This makes sense in a high interest environment. However, within the bias of the markets pricing in expectations for rate cuts and as such more liquidity, we could also assume that demand for assets other than "safe havens" would now increase as well, leading us to the biased conclusion that we could see altcoins wildly outperforming BTC over the next weeks.
Indeed, if we look at the BTC chart, technicals such as VWAP stddevs show significantly less potential for upside if compared to ETH in the current moment in time. We therefore would focus on ETH at this point (as money flow seems to cycle BTC->ETH->Others).
PLEASE NOTE: SL and TP are not accurate. This is not a precise trading idea. Please use your own judgement in accordance with your trading style.

ETHUSD Breakout possible to reach 27000ETHUSD has Broken the trend and is likely to go 2700 after the liquidity.

Has BTC.D Topped?All... based on the trend structure, it looks like bitcoin dominance may have topped. If so, we should see some fun price action start to happen over the next 2 weeks. ETH/BTC ratio should start to increase, USDT.D should start to drop, and TOTAL should start to increase as well.
Stand fast. Keep faith. Remain vigilant.

ETHUSD: Waiting for one last breakout.Ethereum remains neutral on its 1D technical outlook (RSI = 48.083, MACD = -39.26, ADX = 21.833), failing so far to close over its 2W MA50, where it's been rejected in the past 3 candles. The last Resistance before the price starts the parabolic rally is the P1 trendline. The price has been trading over it for the majority of this Cycle and only broke under it during the recent Tariff War. A breakout there, extends the Cycle to possibly at least a +346.99% rally from the bottom (TP = 6,200).
## If you like our free content follow our profile to get more daily ideas. ##
## Comments and likes are greatly appreciated. ##

Ethereum - This structure decides everything!Ethereum - CRYPTO:ETHUSD - trades at a key structure:
(click chart above to see the in depth analysis👆🏻)
After Ethereum retested the previous all time high in the end of 2024, we saw quite a harsh move lower. This move was followed by an expected recovery, however Ethereum is still trading below a key structure. Either move is still possible and will shape the future of Ethereum.
Levels to watch: $2.500, $4.000
Keep your long term vision!
Philip (BasicTrading)

Bearish on ETH! Price has tested and retested the daily sellers order blocking creating a triple top bearish reversal pattern, which was then swept of liquidity. From there, Price broke below the neckline of the triple top and retested the now formed resistance at the 2,450 level. Also in this move we can see a daily bearish trendline that is being respected. This screams bearish sentiments to me, so I will be selling!

ETH/USDT 4H – Bearish Breakout OpportunityA symmetrical triangle pattern has formed and recently broke out to the downside, indicating a potential short-selling opportunity. We've marked the Sell Entry Point and the Target Point at $2,174.07 based on the pattern projection. Price action confirms the move,
Risk management is key – trade responsibly!
👥 Share your thoughts in the comments below – I’d love to hear your opinion on this setup.
❤️ If you found this idea useful, don’t forget to like and support!

ETHEREUM WILL GROW|LONG|
✅ETHEREUM consolidated
Above the horizontal support
Around 2400$ and now we are
Finally seeing a bullish rebound
So we are bullish biased and
We will be expecting a
Further move up
LONG🚀
✅Like and subscribe to never miss a new idea!✅
Disclosure: I am part of Trade Nation's Influencer program and receive a monthly fee for using their TradingView charts in my analysis.

ETH/USDExpecting something like this on most alts.
I've been waiting patiently for a real correction in everything, but my timing was drastically off. Looks like FOMO is still in charge. My guess, stock market to ATH after ATH for a while and a final wave of FOMO for crypto will enter the air.
I believe the majority are expecting a COVID-like rebound, followed by rally continuation, but the majority tends to be wrong.
What I can tell you is the true crypto bull run will not begin on optimism, as it has been...
It will begin on pessimism.

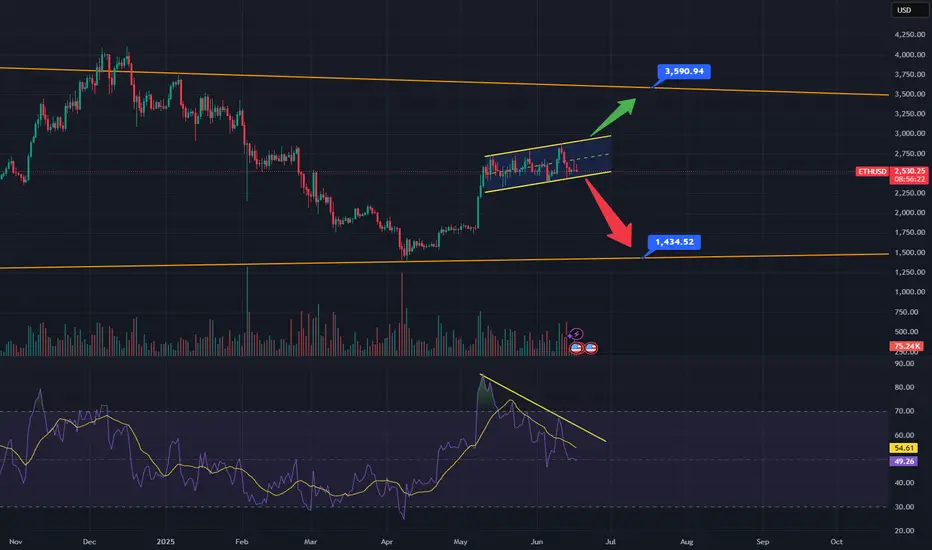
ETH: Breakout or Breakdown?As you can see ETH has been trading inside of this rising channel since the beginning of May. Rising channels favor a break to the downside, I've also highlighted some bearish divergence on the RSI which also points to a move down. The orange lines are long term weekly trend lines. The bottom orange line connects the 2022 lows through to the April lows, if price breaks down, expect a retest of the underside of the channel before moving down to the orange line around $1435. This would only be the third hit and third hits rarely breakdown. If it defies logic and breaks out above, look for it to move up to the top orange line around $3600, which connects the 2021 bull market highs through the march 24', May 24' and December 24' highs. If it comes into this area, it would be a 5th hit of a major weekly trendline, 5th hits have a very high probability of breaking out to the upside, if this happens it would be very bullish. In this scenario I would expect ETH to come down and test the top of said trendline as support before moving to new all-time highs. A Fibonacci retracement from the 2020 lows to the 2021 highs would put new price targets at $6,670 at the -0.382 as well as $7,800 at the -0.618.