ETHUSD – Breakout Confirmation & Premium Targeting🚀 ETHUSD – Breakout Confirmation & Premium Targeting (VolanX Protocol)
ETHUSD has broken out of its descending channel with a clean BOS (Break of Structure) and aggressive volume spike from the 3,620–3,650 demand zone. This breakout suggests a shift in order flow, with liquidity now being targeted toward premium levels.
Key Observations (1H SMC):
BOS: Clear bullish structure shift above 3,669 and 3,705 levels.
Volume Surge: Buyers stepped in aggressively near the equilibrium zone.
Liquidity Pools: Weak highs around 3,767 and 3,813 are prime targets.
Premium Zone: Between 3,767 – 3,875, marked as the next magnet zone.
Ultimate Target: 4,003 key level if momentum sustains.
VolanX Playbook:
Long Bias:
Entry Zone: 3,669–3,705 (retest of BOS level)
Targets:
3,767 (first liquidity grab)
3,813–3,875 (premium zone)
4,003+ if breakout trend extends
Invalidation:
Close below 3,621 = bullish scenario voided, revert to discount pricing.
VolanX Signal:
This breakout suggests institutional order flow absorption and rotation toward high-value zones. Monitor retests for long entries and manage risk under 3,621.
#ETH #ETHUSD #VolanX #SMC #CryptoTrading #Liquidity #OrderFlow #PriceAction #TradingView #AlphaSignals
ETHUSD trade ideas

ETH/USD: Watching the levels. It broke out of the downtrend and its going up, I think the momentum has just begun, Let's see where we go this time. Big time fan of ETH so excited!

ETH 1H — Decision Point Ahead
ETH just confirmed a bullish RSI divergence, with price finding support at the 200MA.
MACD supports the move, and the trend structure is clean: MLR > SMA > BB Center.
Now, price is hovering at the 0.236 Fib level.
A few strong closes above it could open the door for more upside.
If rejected, we might revisit the 200MA for another test.
Either way — we’ll find out soon.
Always take profits and manage risk.
Interaction is welcome.

ETH BUY SETUP ,Bought From $3620ETH BUY SETUP
Currently $3620
Bought From $3620
(Trading plan If ETH go down
to $3520 will add more longs)
Expecting target $3715 OR ABOVE
In the event of an early exit,
this analysis will be updated.
Its not a Financial advice

ETHUSD News Over / 30 minutes time frame Bullish Trade
Mange risk Always chart explains trade plan well

ETHUSD: [VolanX ETHUSD SMC Outlook] — Compression → Expansion📈 — Compression → Expansion Setup Brewing
Chart Context (15m):
We're in a descending channel compression zone, rejecting from discount demand after BOS (Break of Structure) & CHoCH (Change of Character) confirmations. Volume spiked at the low, signaling potential accumulation. Current price is coiling just under the equilibrium zone.
🔍 Technical Setup:
🟢 Weak Low Sweep into high-volume demand zone
🔴 EQH (Equal Highs) + Liquidity resting near $3,754
🟣 Premium Supply Zones above $3,700 — final liquidity targets
🔻 Still under bearish internal structure (lower highs intact)
🟠 Equilibrium retest holding as micro support (watch for impulse)
🎯 VolanX Execution Path:
Break above $3,667 trendline = early long trigger 🚀
Target 1: $3,700 zone reclaim = confirmation of strength
Target 2: $3,754 liquidity hunt 🧲
Rejection from $3,754–$3,775 = potential short setup
🔻 Invalid Below:
Close below $3,600 with volume = bearish continuation
Retest of $3,523 “Discount” zone or liquidity void
📊 Volume Profile:
Highest reactive node: $3,623–$3,646
Spike near low = trap or base?
📡 VolanX Signal Protocol:
Accumulation + Compression = Expect Expansion.
ETHUSD may be rotating toward premium liquidity unless invalidated. Watch for breakout confirmation above descending trendline + EQH run.
🧠 Narrative Bias:
Markets are pricing in ETH's role in upcoming ETF decisions & regulatory clarity. VolanX AI aligns this structure as "coiling before institutional deployment."
#ETH #VolanX #SmartMoney #LiquiditySweep #CryptoTrading #OrderFlow #VolumeProfile #ETHUSD #TradingView #AlphaSignals #VolanXProtocol #SMC #PriceAction

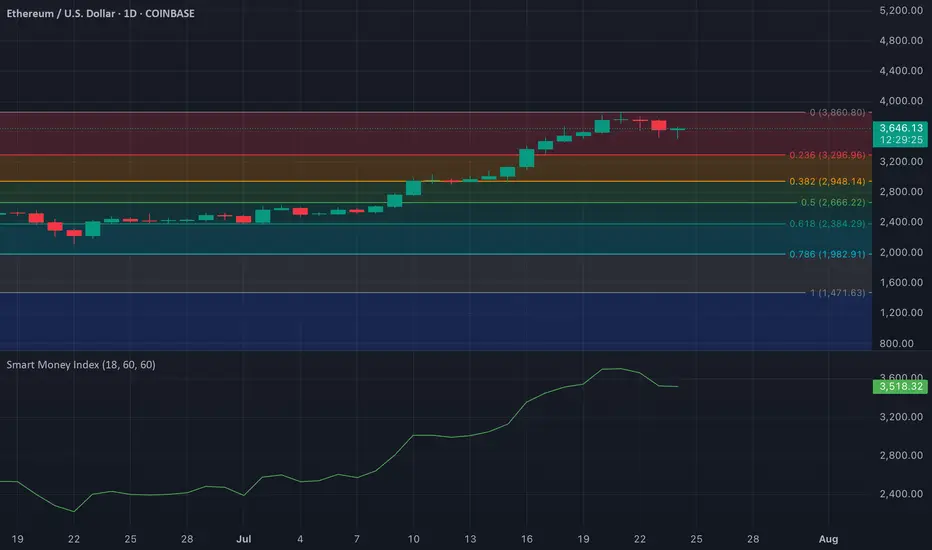
ETH/USD: Smart Money Index Signals Distribution Post-RallyOn the ETH/USD daily chart, a notable drop in the Smart Money Index (SMI) is confirming bearish sentiment among key market players. Since July 20, the SMI has declined by 7%, signaling increased selling activity from institutional investors and seasoned traders—often referred to as "smart money."
The SMI works by contrasting intraday trading behavior: it gauges retail-driven morning trades against institutional-dominated afternoon moves. A falling SMI, like the one seen on Ethereum, suggests that smart money is quietly exiting positions. In this case, it points to profit-taking after ETH’s recent price rally, reinforcing the idea that the current pullback may be more than just noise. Traders should monitor further declines in the SMI as a sign of continued distribution.
ETHUSD, XRPUSD - BEARISH DIVERGENCE SUCCESSFULLY WORKED OUT
ETHUSD, XRPUSD - BEARISH DIVERGENCE SUCCESSFULLY WORKED OUT
On these 2 graphs you may observe ethereum and ripple declining after strong bearish divergence showed up on both of these instruments. Here, the bearish divergence proved to be a success. In both cases the price has almost reached first targets: 3,500.00 for ETHUSD and 3.00000 for XRPUSD.
What will be next?
It looks like downwards correction still persists and we may observe some deeper than now decline with possible targets of 3,000.00 for the ETHUSD and 2.60000 for the XRPUSD.
ETH my notes for short termwaiting for a short time correction time. supports: 3500 - 3300 - 3050. then new ath process till october
not financial advices, notes for myself

$ETH Hit Our Targets and was rejectedCRYPTOCAP:ETH hit our signal take profit target at $3820 and was rejected at the High Volume Node EQ to the penny.
That appears to have completed wave 3 of this motif wave. Wave 4 has an expected target of the R2 daily pivot and 0.236-0.382 Fibonacci retracement, $3260 before continuing to the upside in wave 5 with a target of the all time high.
This aligns with my views of a significant pullback at the end of August and September which is typical after a summer rally.
No divergences yet in daily RSI.
Safe trading

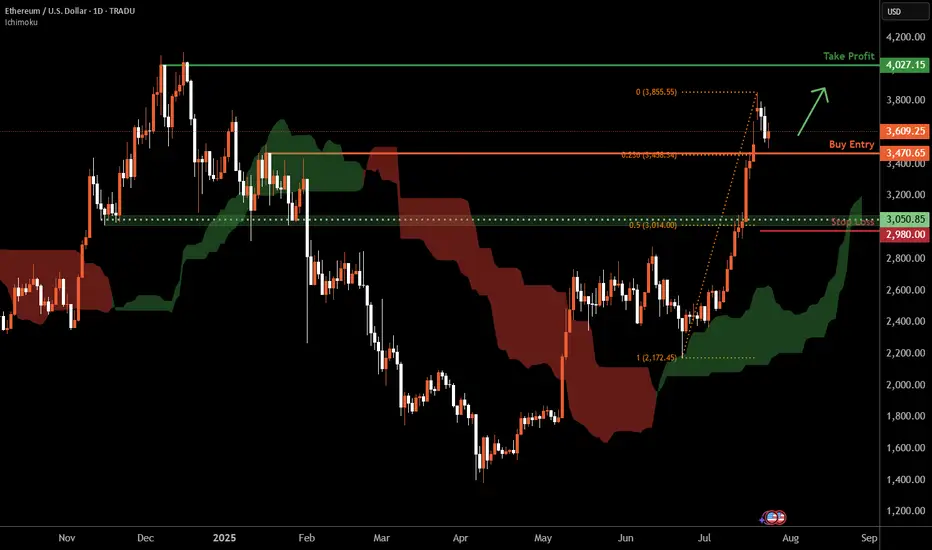
Ethereum D1 | Bullish uptrend to extend higher?Ethereum (ETH/USD) is falling towards a pullback support and could potentially bounce off this level to climb higher.
Buy entry is at 3,470.65 which is a pullback support that aligns with the 23.6% Fibonacci retracement.
Stop loss is at 2,980.00 which is a level that lies underneath a pullback support and the 50% Fibonacci retracement.
Take profit is at 4,027.15 which is a multi-swing-high resistance.
High Risk Investment Warning
Trading Forex/CFDs on margin carries a high level of risk and may not be suitable for all investors. Leverage can work against you.
Stratos Markets Limited (tradu.com ):
CFDs are complex instruments and come with a high risk of losing money rapidly due to leverage. 66% of retail investor accounts lose money when trading CFDs with this provider. You should consider whether you understand how CFDs work and whether you can afford to take the high risk of losing your money.
Stratos Europe Ltd (tradu.com ):
CFDs are complex instruments and come with a high risk of losing money rapidly due to leverage. 66% of retail investor accounts lose money when trading CFDs with this provider. You should consider whether you understand how CFDs work and whether you can afford to take the high risk of losing your money.
Stratos Global LLC (tradu.com ):
Losses can exceed deposits.
Please be advised that the information presented on TradingView is provided to Tradu (‘Company’, ‘we’) by a third-party provider (‘TFA Global Pte Ltd’). Please be reminded that you are solely responsible for the trading decisions on your account. There is a very high degree of risk involved in trading. Any information and/or content is intended entirely for research, educational and informational purposes only and does not constitute investment or consultation advice or investment strategy. The information is not tailored to the investment needs of any specific person and therefore does not involve a consideration of any of the investment objectives, financial situation or needs of any viewer that may receive it. Kindly also note that past performance is not a reliable indicator of future results. Actual results may differ materially from those anticipated in forward-looking or past performance statements. We assume no liability as to the accuracy or completeness of any of the information and/or content provided herein and the Company cannot be held responsible for any omission, mistake nor for any loss or damage including without limitation to any loss of profit which may arise from reliance on any information supplied by TFA Global Pte Ltd.
The speaker(s) is neither an employee, agent nor representative of Tradu and is therefore acting independently. The opinions given are their own, constitute general market commentary, and do not constitute the opinion or advice of Tradu or any form of personal or investment advice. Tradu neither endorses nor guarantees offerings of third-party speakers, nor is Tradu responsible for the content, veracity or opinions of third-party speakers, presenters or participants.
ETHUSD has formed a bearish bat patternOn the daily chart, ETHUSD formed a bearish bat pattern. The first downside target is around 3193, and the second downside target is around 2782.

ETHUSD 1 hour time frame
EHT USD Long Call Buy Setup
Bulllish Hammer Trigger the trade
Mange your risk reward as per your capital and book partial profits

ETHUSD: A potential short term trade setting upHello,
The ETHUSD pair is currently forming a well-defined bullish flag pattern, a reliable indicator of a potential continuation of the upward trend. Risk-tolerant investors may consider entering at the lower boundary of the flag, while risk-averse investors might prefer to wait for a confirmed breakout to the upside before entering a position.
The MACD is showing a bullish zero-line crossover, further supporting our bullish outlook. Additionally, the cryptocurrency market has experienced significant growth recently, with Bitcoin trading at all-time highs. While Ethereum has underperformed Bitcoin, this lag presents a compelling buying opportunity, as investors who missed Bitcoin's rally may turn to Ethereum to capitalize on its potential catch-up
Disclosure: I am part of Trade Nation's Influencer program and receive a monthly fee for using their TradingView charts in my analysis.

Eth next bottom before the next leg upIn a bull market the average retrace
is between .2 -.4 Fib from the bottom
of that run.
Several factors of confluence lead me
to believe Eth will hit my red T1 target,
bounce to the top of current range (green T1)
then drop to a minimum of .35 Fib = $2990

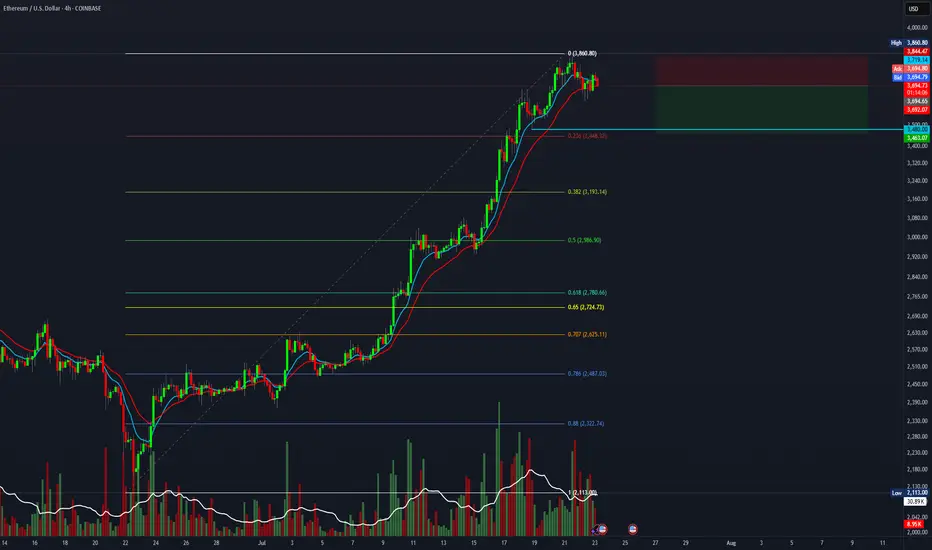
Short swing setup on ETH, targeting 1.5R.It's time for a healthy pullback on ETH. This short setup offers a 1.5:1 risk-to-reward ratio with a target of $3,500.
Entry at $3,725
Stop loss at $3,850
Target at $3,500.
ETH bullish trend.ETH bullish trend on Daily TF, Retracement can happen till 0.5 till 0.618 fib level.
Resistances shown with R sign and All time high as ATH.

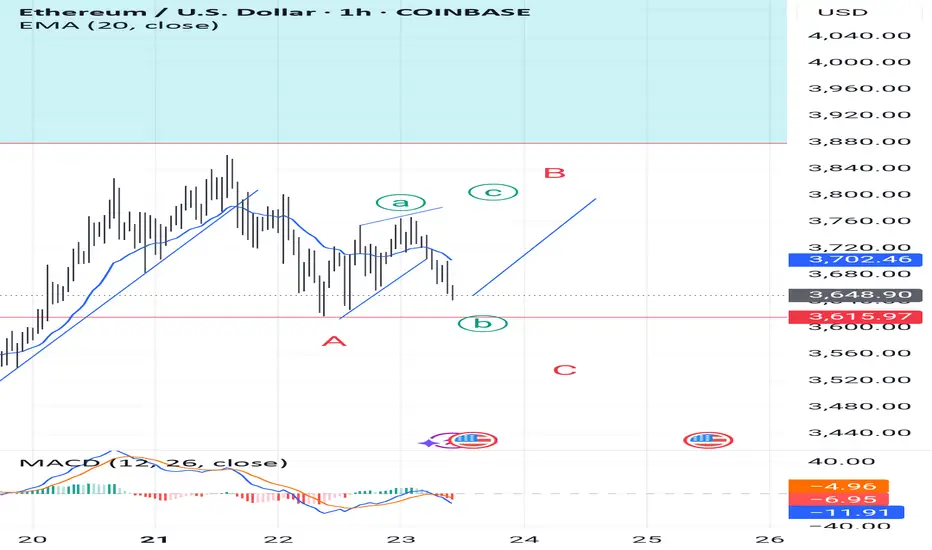
EthusdLeading diagonal has formed a wave and now we see b as a flat.
If the price doesn't go below (a)3615, I think we may see c wave of (B).
It may come strong and quick
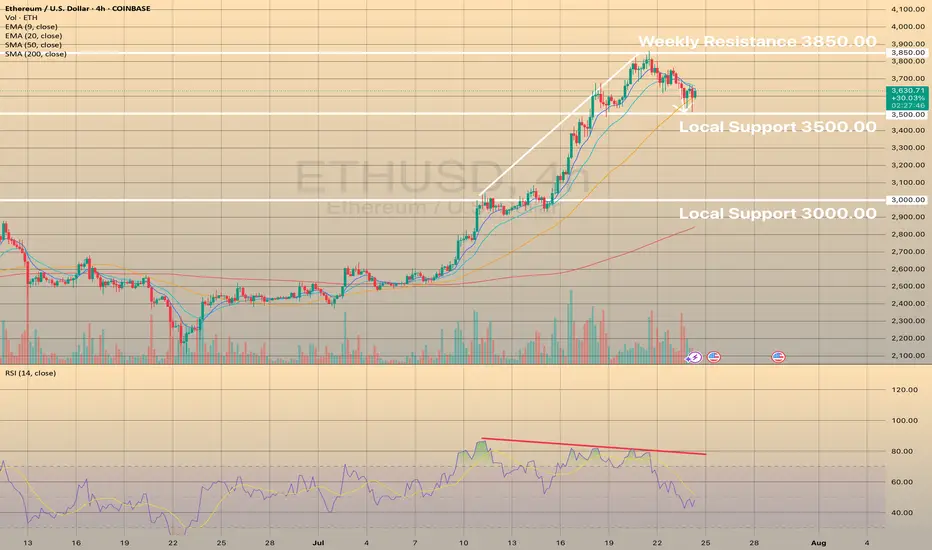
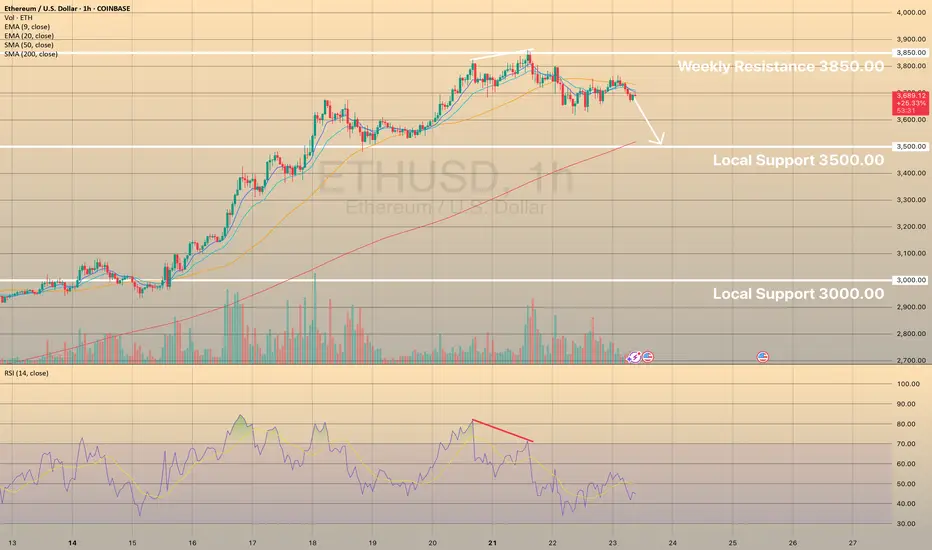
ETHUSD SEEMS TO RETEST SUPPORT LEVEL OF 3,500.00ETHUSD SEEMS TO RETEST SUPPORT LEVEL OF 3,500.00
The ETHUSD has hit some resistance at around 3,850.00 this week. But it's since pulled back from that level, which might be a sign of a cooling trend. That's backed up by the RSI going bearish.
Right now, the price is below the 50 SMA on the 1-hour chart, indicating a mid-term downtrend.
We could see the price find some support at 3500.00 or so. Additionally the SMA 200 lays nearby, providing extra support here.
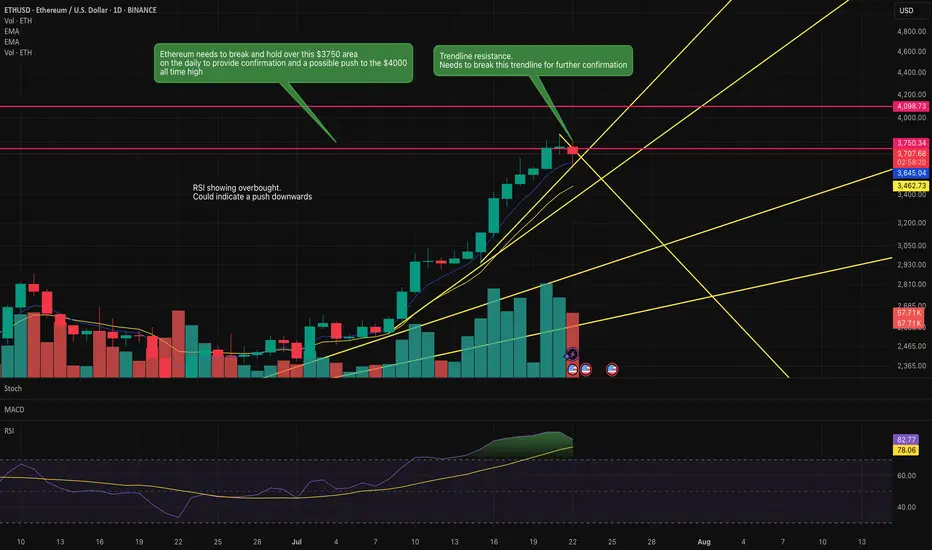
Is Ethereum going to push above this key resistance?Ethereum is knowcking against this key resistance area.
If it pushes above this $3750 area then it has a clear run to the previous all time highs of $4000.
RSI indicates overbought so it could indicate a reversal to the downside.
Key trendline is being honoured currently. However, a break of this trendline may indicate the move upwards to the previous all time high.
Watch this space over the next couple of days.
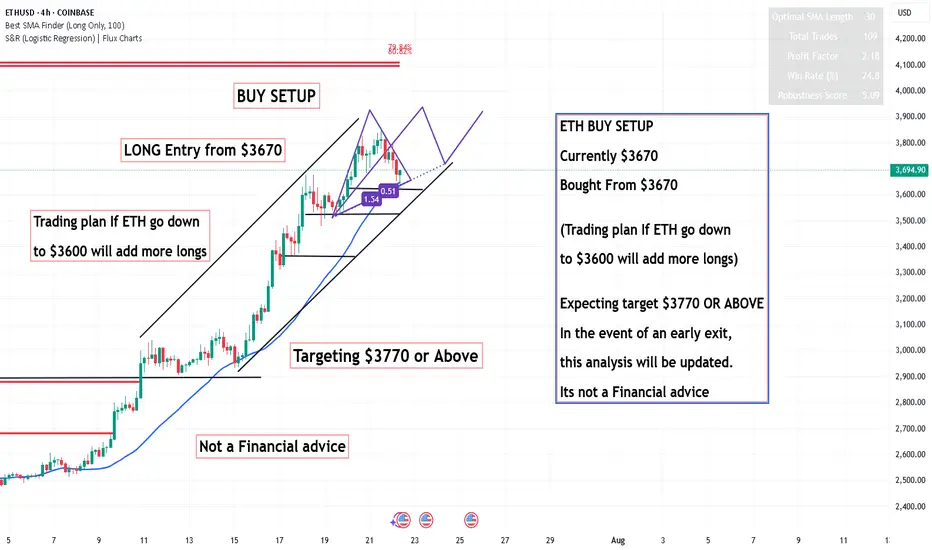
ETH BUY SETUP ,Bought From $3670ETH BUY SETUP
Currently $3670
Bought From $3670
(Trading plan If ETH go down
to $3600 will add more longs)
Expecting target $3770 OR ABOVE
In the event of an early exit,
this analysis will be updated.
Its not a Financial advice
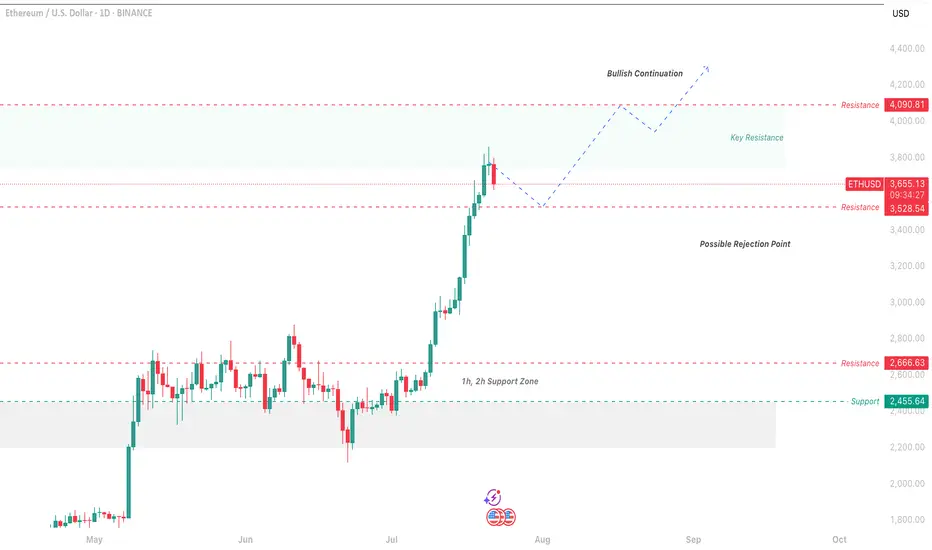
ETH Price Analysis & Bullish Continuation Prediction 4h & 1DThis analysis examines the Ethereum/US Dollar 1-day chart from Binance, focusing on a potential bullish continuation as of July 22, 2025. The chart indicates a recent upward movement following a consolidation phase, with the price approaching a key resistance at $4,090.81. As a reader, I’d want to grasp the context: the 1-hour and 2-hour support zone around $2,455.64 has provided a strong foundation, while the current price action suggests a possible rejection point near $3,600.00 if it fails to break resistance.
My thought process starts with the support zone at $2,455.64, which has historically held, indicating a solid base for any upward move. The price has now reached $3,600.00, a level where it could either break out toward $4,090.81 or face rejection. A successful break above $4,090.81 with increased volume could lead to a continuation toward $4,200.00. However, if the price falls below $3,600.00, it might signal a retreat back to the support zone, invalidating the bullish outlook.
Profit Targets:
Short-term: $4,090.81 (key resistance)
Long-term: $4,200.00 (bullish continuation)
Stop Loss: $2,455.64 (below the 1h/2h support zone)
These targets and stop loss levels provide clarity for managing the trade effectively.
Ethereum (ETH/USD) Chart AnalysisEthereum (ETH/USD) Chart Analysis
**Trend Overview:**Ethereum (ETH/USD) Chart Analysis
* The chart shows **strong bullish momentum**, with Ethereum maintaining an upward trend of **higher highs and higher lows**.
* The price is currently around **\$3,618**, well above the key moving averages:
* **EMA(7): \$3,610**
* **EMA(21): \$3,539**
* **EMA(50): \$3,419**
**Support Levels:**
* The recent pullback found support at the **\$3,570–\$3,600 zone**, which is now acting as a **key horizontal support**.
* Below this, **EMA 21 (\$3,539)** and **EMA 50 (\$3,419)** offer additional dynamic support zones.
* Marked support areas **S1 and S2** also highlight previous breakout zones that could act as strong demand levels if retested.
**Bullish Outlook:**
* As long as ETH stays **above the support zone**, the bullish trend is likely to continue.
* A bounce from the current level could lead to a **retest of \$3,740**, followed by a move toward the **\$4,000 target** shown by the projected green path on the chart.
**Indicators & Sentiment:**
* Price respecting the EMA lines confirms **strong buyer interest** on pullbacks.
* No visible bearish divergence, and the chart structure favors **trend continuation**.
**Conclusion:**
Ethereum remains in a **bullish structure**, with strong support around \$3,570–\$3,600. As long as it holds above this zone, the next upside targets are \$3,740 and potentially \$4,000. A break below the EMAs would signal weakness, but for now, momentum supports continued gains.
