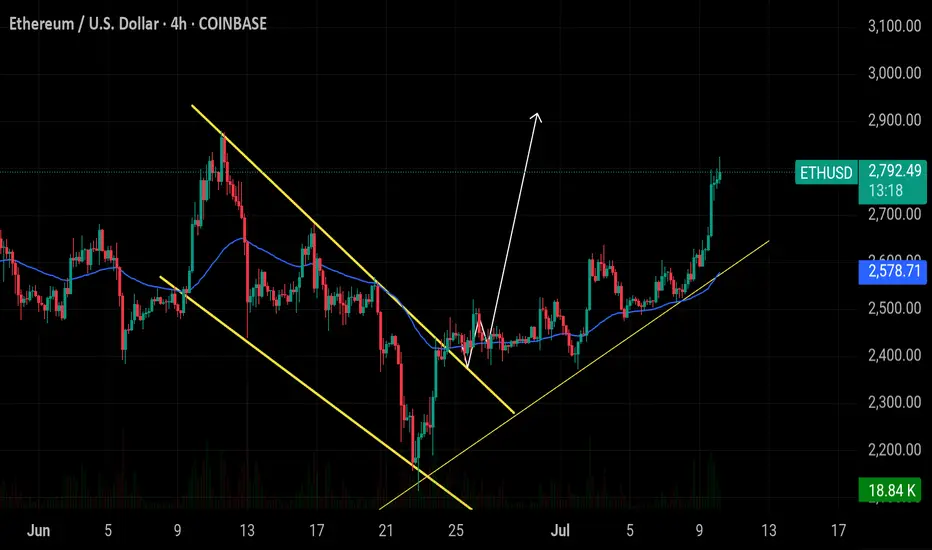
Bullish on ETHWe took out SSL, then price broke down and inverted towards bullish price action. Target is previous double tops at 4200
ETHUSD trade ideas

$ETH clear for an impulsive move to $3600?CRYPTOCAP:ETH has slowly but surely cleared resistance, with just the swing high to tackle which will activate another trade signal in my Trade Signals Substack.
Major support High Volume Node, daily pivot and daily 200 EMA proved tough support and demand continues to come in.
ETFs had an astonishing amount of inflows yesterday at $200M+
Analysis is invalidated below $2100
Safe trading

$ETH 4H Update: Both Targets Hit! Ethereum successfully reacheCRYPTOCAP:ETH 4H Update:
Both Targets Hit! Ethereum successfully reached both $2,600 and $2,800 after the breakout.
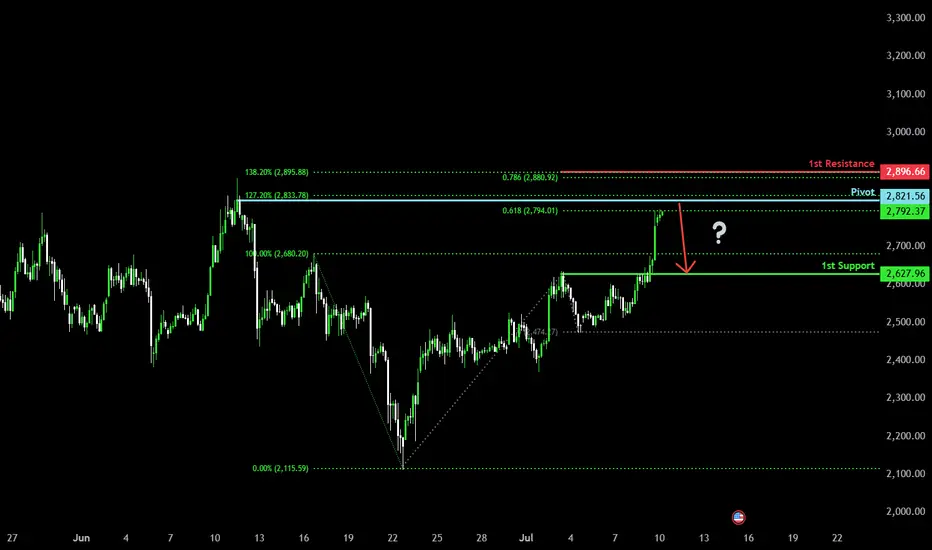
Heading into pullback resistance?Ethereum (ETH/USD) is rising towards the pivot, which has been identified as a pullback resistance and could reverse to the 1st support which acts as a pullback support.
Pivot: 2,821.56
1st Support: 2,627.96
1st Resistance: 2,896.66
Risk Warning:
Trading Forex and CFDs carries a high level of risk to your capital and you should only trade with money you can afford to lose. Trading Forex and CFDs may not be suitable for all investors, so please ensure that you fully understand the risks involved and seek independent advice if necessary.
Disclaimer:
The above opinions given constitute general market commentary, and do not constitute the opinion or advice of IC Markets or any form of personal or investment advice.
Any opinions, news, research, analyses, prices, other information, or links to third-party sites contained on this website are provided on an "as-is" basis, are intended only to be informative, is not an advice nor a recommendation, nor research, or a record of our trading prices, or an offer of, or solicitation for a transaction in any financial instrument and thus should not be treated as such. The information provided does not involve any specific investment objectives, financial situation and needs of any specific person who may receive it. Please be aware, that past performance is not a reliable indicator of future performance and/or results. Past Performance or Forward-looking scenarios based upon the reasonable beliefs of the third-party provider are not a guarantee of future performance. Actual results may differ materially from those anticipated in forward-looking or past performance statements. IC Markets makes no representation or warranty and assumes no liability as to the accuracy or completeness of the information provided, nor any loss arising from any investment based on a recommendation, forecast or any information supplied by any third-party.
Ethereum Breakout Brewing: Higher Lows Point to $4,100Ethereum is showing signs of a major breakout setup on the 8H chart. The historical price action reveals a well-defined horizontal range, with ETH respecting the $2,200–$2,950 demand zone multiple times.
Key highlights:
🔹 Strong Reclaim: Price reclaimed the key range low around $2,300 with momentum.
🔹 Higher Lows Forming: Each bounce from support has built more bullish structure.
🔹 Targeting Range High Breakout: ETH has launched toward ~$4,100 after each reclaim.
🔹 Current Resistance: $2,950 remains the final barrier before blue sky.
If ETH can break and hold above that zone, historical structure suggests a move toward $4,100+ is well within reach.

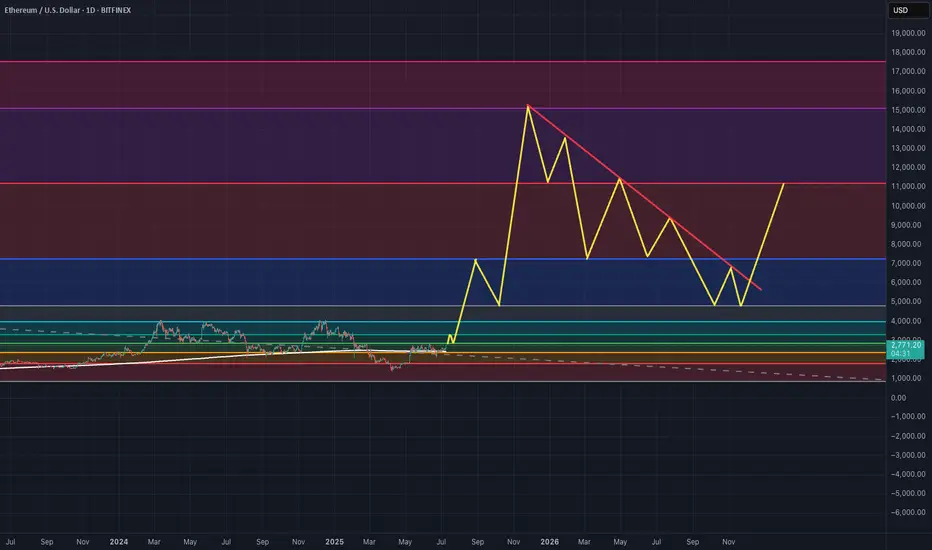
ETH ($11k - $15k) Overextend to $20k This is my idea for ETH H2 2025 - H2 2026. The pattern is still being conservative because i can see it going to almost $20k.
ETH Just Reached the Floor — This Is the Starting Line.This isn’t hopium, it’s structure.
Using my custom 4 EMA setup, you can see how ETH spent weeks coiling around the thickest dark purple line which I treat as the macro floor. ETH dropped below it briefly, retested it, and now we’re reclaiming that level again.
Whenever these EMAs start to compress and flatten, we usually get sideways chop, pressure build, breakout.
Zoom out and you’ll notice:
• We’re not extended.
• We’re not overbought.
• We’re not in price discovery.
We’re just getting back to the floor after compression.
If this is the top, it’s doing a great job pretending it’s still early.

Ethereum Faces the 'Symplegades'– Will Pectra Propel It Through?Ethereum Faces the 'Symplegades' – Will Pectra Propel It Through?
⚔️🪨 Ethereum Faces the 'Symplegades' – Will Pectra Propel It Through? 🪨⚔️
In ancient Greek myth, the Symplegades — Clashing Rocks — tested Jason and the Argonauts with a narrow, deadly passage. Today, Ethereum faces its own mythic trial as price action presses into a critical zone.
📍 The $2,805–$2,848 resistance zone is acting like the Clashing Rocks — volatile, dangerous, and decisive. Beneath it, support rests near $2,616 and $2,565 . A breakout from this trap can open the way to $3,200+ , but rejection may mean another violent plunge. ⚠️
🔧 Enter: PECTRA – Ethereum’s Game-Changing Upgrade
Ethereum’s most ambitious upgrade since The Merge is nearly here. PECTRA isn’t just a backend update — it redefines how the network feels and functions:
🧠 Smarter Wallets
– Batch transactions
– Skip approval popups
– Pay gas in any token
⚡ Frictionless UX
– Fewer clicks
– No more endless “approve + confirm” loops
📉 Cheaper Transactions
– More blobs = better L2 scaling
– Lower fees, even during congestion
🌱 Staking Overhaul
– Validator cap raised to 2048 ETH
– Smart contract withdrawals
– Faster deposit recognition
🔓 Unlocking $490B in trapped value
– Assets become more accessible and usable
“The Merge changed how Ethereum works.
Pectra changes how it feels. ” – @ethereum
⛵ Will ETH Break Through the Clashing Rocks?
This is not just another consolidation box.
It’s a moment of mythic symmetry — where price action, fundamentals, and network transformation converge.
Sail through the Symplegades... or get crushed between them?
Stay sharp. Watch the breakout. The next move will be defining.
One Love,
The FXPROFESSOR 💙

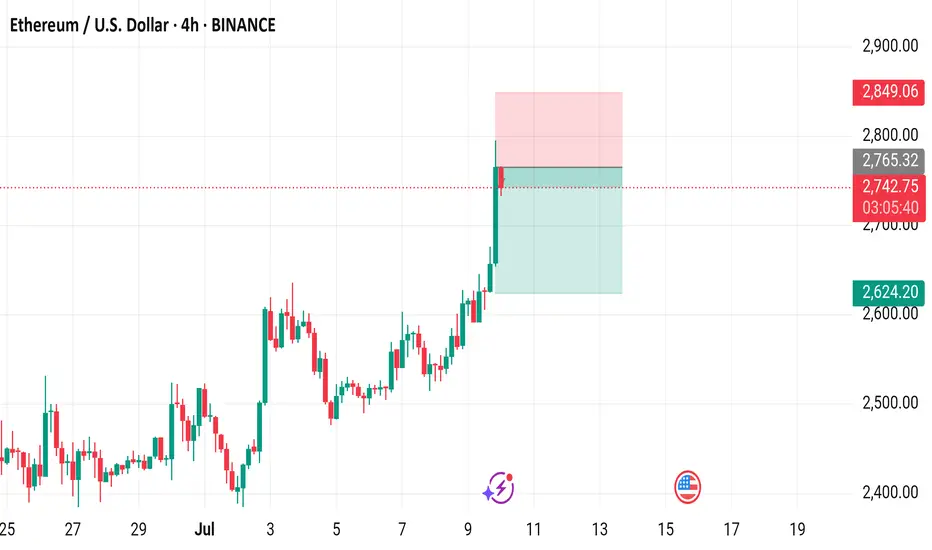
Ethereum / U.S. Dollar 4-Hour Chart (BINANCE)4-hour candlestick chart displays the price movement of Ethereum (ETH) against the U.S. Dollar (USD) on the BINANCE exchange. The current price is $2,740.99, reflecting a +$124.74 increase (+4.77%) in the last period. The chart includes a buy/sell indicator with no current activity (0.00), a resistance zone highlighted in pink, and a support zone in light green. The price has recently surged, breaking through the $2,740.99 level, with additional price points ranging from $2,400.00 to $2,949.06 shown on the right axis. The time frame spans from late June to July 10, 2025.
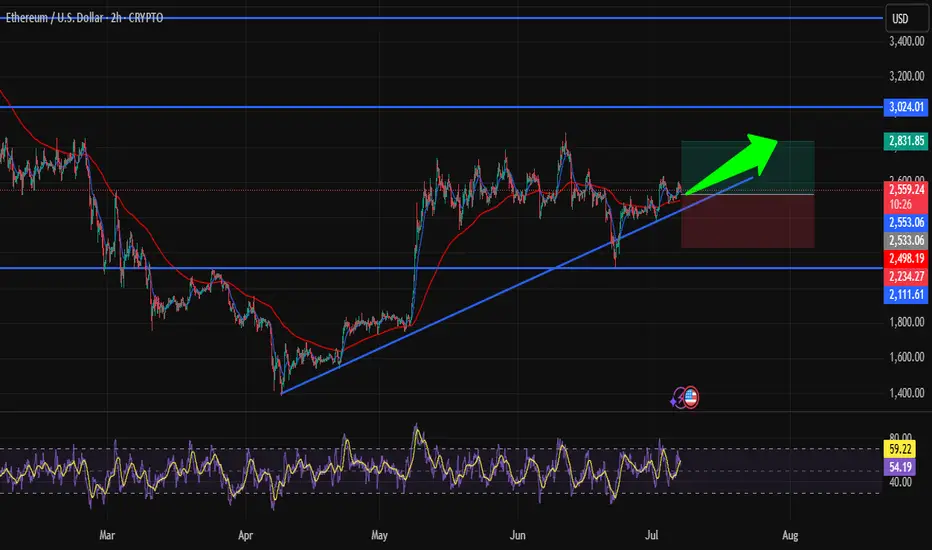
Is ETH Heading to $2800? Strategic Entry in Bullish TrendHi traders! , Analyzing ETH/USD on the 2H timeframe, price is respecting an ascending trendline and showing signs of continuation within the bullish structure:
🔹 Entry: 2555
🔹 Take Profit : 2831
🔹 Stop Loss : 2234
After consolidating above key support and retesting the ascending trendline, ETH is showing potential for a bullish continuation. The recent bounce is forming higher lows, and price remains above the 50 EMA, suggesting buyers are maintaining control.
RSI is currently turning upward from the mid-zone, signaling growing bullish momentum while still avoiding overbought conditions. The trendline has been respected several times, adding confluence to the setup.
If momentum holds, the TP around 2831 lines up with a significant resistance area from previous structure — a logical zone for price to reach in the short term.
⚠️ DISCLAIMER: This is not financial advice. Every trader is responsible for managing their own risk and strategy.
MeghaHorn or BowTie Pattern !!!Key Observations:
Pattern Formation:
A broadening wedge or megaphone pattern (also likened to a bow tie) is forming.
Price is oscillating between expanding trend lines.
Labeled waves: 1, 2, 3, 4, 5 within the pattern.
Critical Zones:
Buy Above: $2,815.98 (upper boundary of the wedge).
Sell Below: $2,258.03 (lower boundary of the wedge).
No Trading Zone: Between $2,258 – $2,815 (uncertainty/consolidation area).
Price Target:
If price breaks below, Target 1 is indicated around $1,800 or below (implied from structure).
Current Price:
Trading at $2,748.56, up +5.05%, within the “No Trading Zone”.
Summary:
The chart suggests waiting for a breakout or breakdown from the wedge pattern to determine the next move. A breakout above $2,815 could signal a buy opportunity, while a breakdown below $2,258 could trigger a sell with a potential target near $1,800.
Ask ChatGPT

#ETHUSD Buy 2624.65#ETHUSD Buy 2624.65
SL 2564.65
TP 2644.65
TP 2724.65
TP 2864.65
Trade at your own risk
Protect your capital
The Wizard 🧙♂️ SWFX

Etherium is forming MeghahorneKey Elements in the Chart:
Wave Count (Possibly 1,2,3,4,5):
The chart shows a potential Elliott Wave formation inside a "Megaphone" (broadening wedge) pattern.
The current wave appears to be completing Wave 4, heading toward Wave 5.
Buy Zone and No Trading Zone:
A "Buy Above" level is marked just above $2,763, indicating a bullish breakout confirmation.
A "No Trading Zone" is identified between ~$2,378 and ~$2,763, suggesting uncertainty or consolidation.
Downside Targets (If bearish breakout occurs):
Target 1: Around ~$1,900.
Target 2: Much lower, near ~$1,000.
Indicators:
Bollinger Bands are applied, suggesting increased volatility within the megaphone pattern.

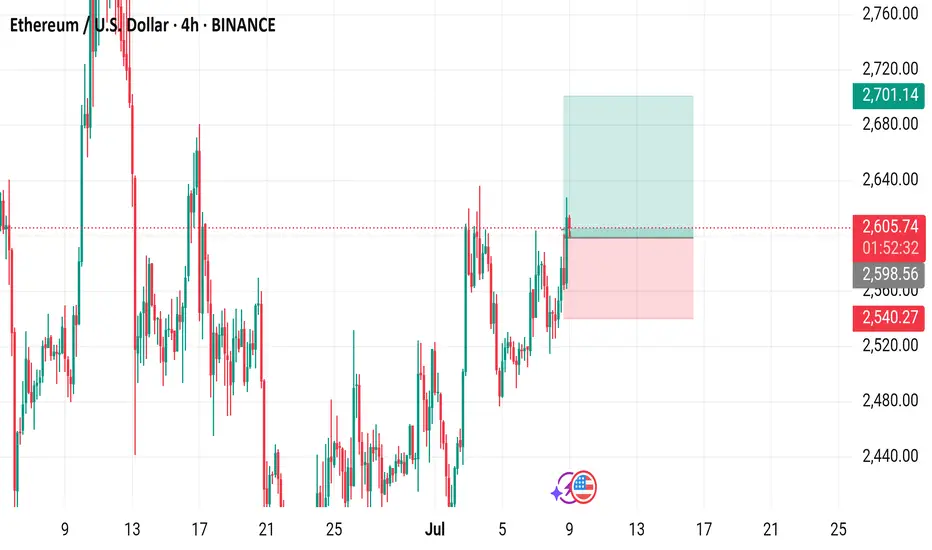
Ethereum (ETH) to U.S. Dollar (USD) 4-Hour Chart - Binance4-hour candlestick chart from Binance displays the price movement of Ethereum (ETH) against the U.S. Dollar (USD) from late June to early July 2025. The current price is $2,608.76, reflecting a +$65.53 (+2.58%) change. The chart includes buy and sell indicators at $2,608.76, with a highlighted resistance zone around $2,700-$2,760 and a support zone around $2,540-$2,600. The chart also shows a recent upward trend with fluctuating volatility.
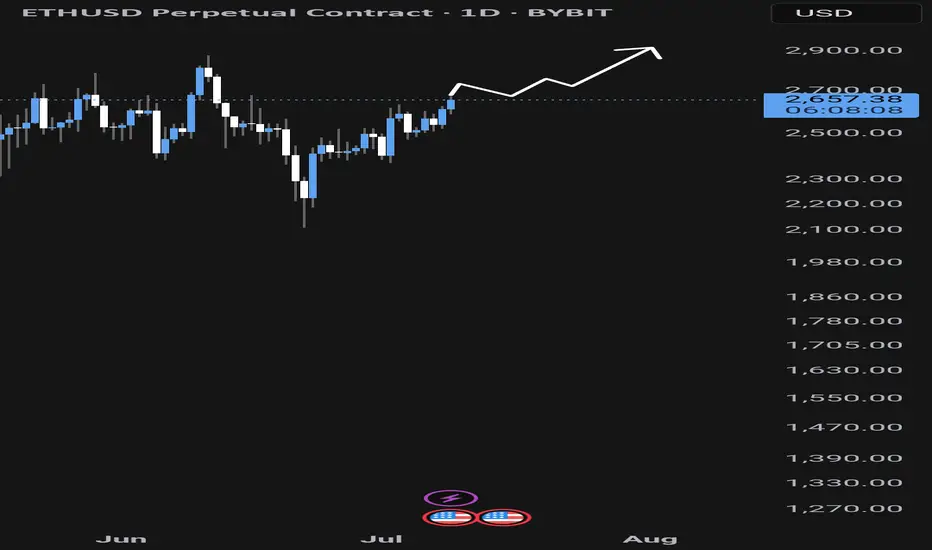
Ethereum (ETH) Market UpdateOrder Flow Signals Bullish Momentum
The current order flow structure for Ethereum is decisively bullish. Buy-side liquidity is dominant, indicating strong demand from market participants. This suggests that institutional and smart money flows are favoring long positions, providing solid support for higher price continuation.
Daily Fair Value Gap (FVG) Holding as a Strong Support Zone
The daily timeframe shows a key Fair Value Gap (FVG) that has been respected multiple times. This zone has acted as a significant area of demand, absorbing selling pressure and fueling upward momentum. As long as price holds above this level, the bias remains strongly in favor of continued bullish price action.
Correlation with Bitcoin’s Strength
Bitcoin’s current bullish structure is reinforcing ETH’s outlook. As BTC continues to maintain upward momentum and structure, ETH is benefiting from the positive market sentiment and correlation. Historically, Ethereum often follows Bitcoin’s macro trend, and this synchronized bullish movement adds further conviction to ETH’s upside potential.
ETHUSD: Bullish Momentum, SUPPORT:2400/2100 TARGET=3400/3700The ETH/USD chart looks bullish, with room to move higher toward $3,400 and possibly $3,700. If the trend loses steam, support near $2,400 could come into play.

ETHUSD 8H – Moving Toward Breakout After Months of AccumulationEthereum has been trading within a large ascending structure since April, forming consistent higher lows while repeatedly testing overhead resistance between $2,730 and $2,850. This is a classic example of a compressed range setup where buyers gradually gain strength beneath a defined ceiling, leading into a potential breakout scenario.
The chart highlights the key structural components of this setup:
An ascending support trendline has been respected for over two months, showing persistent bullish pressure on each dip.
A multi-month resistance zone has capped every breakout attempt since early May, with multiple upper wick rejections confirming this level as major overhead supply.
Most recently, ETH bounced cleanly off the rising trendline again, forming yet another higher low, reinforcing the bullish structure.
If this pattern holds, Ethereum is approaching a technical inflection point. A breakout above $2,850 with strong volume and follow-through could trigger a rapid move toward the $3,000–$3,200 range. That move would align with the measured move from the height of the ascending triangle formation.
However, if price is rejected again from resistance, the ascending trendline remains a key support level to watch for another potential retest. A breakdown below $2,400 would invalidate the pattern and open the door to a deeper retracement.
Key Technical Zones:
Support: Rising trendline from April lows (~$2,400–$2,500)
Resistance: Horizontal zone between $2,730 and $2,850
Breakout Target (on confirmation): $3,000–$3,200
Strategy Notes:
Bias remains bullish while higher lows continue to hold
Breakout setups often benefit from confirmation (candle close above resistance with volume)
Rejections from resistance could offer opportunities to re-enter at trendline support

ETHUSD – From Dip to DecisionETH swept lows at $2,460 then began a steady stair-step recovery. After reclaiming $2,580, it climbed into $2,630 and is consolidating just under resistance. Bulls need to break $2,645 to maintain momentum — failure to do so might bring a retest of $2,600.

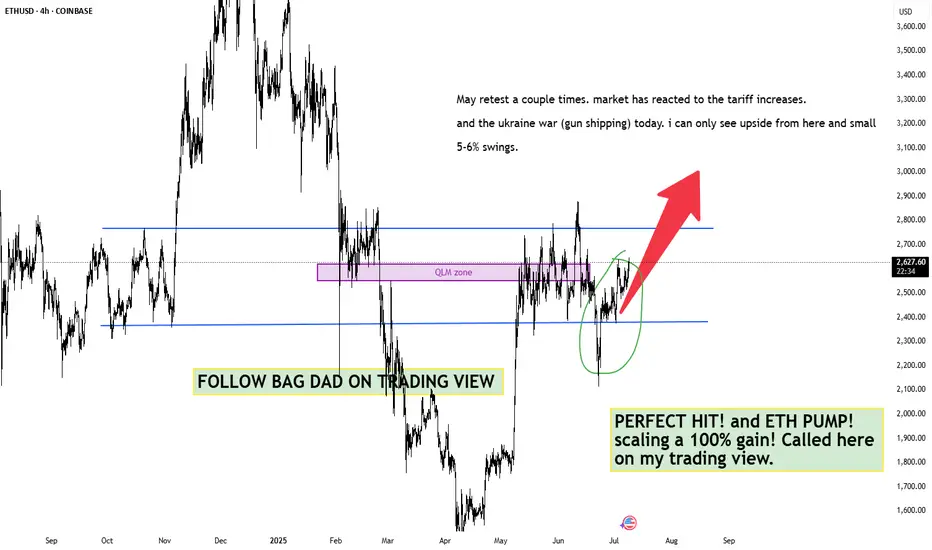
$ETH UPDATE 2 (series 11) bull incoming. altseasonWe are very close to pressing insane ranges on bitcoin and eth starting the super cycle of alts and memecoins. i first want to indicate all my longs i called have been made here on the trading view and with full transparecey. not confusing people with bull crap chart patterns.
realistic scaling and simple common sense on these longs. QLM zone is obvious here. RSI looked healthy and good. only overbought a couple times.
lets hope tomorrow we see a trump pump from the tariff announcements on apparent deals!
ETHUSD SHAPING THE BEARISH WEDGE, READY TO DECLINE
Ethereum has been forming the bearish wedge since the June 23th. The asset goes precisely according to Elliot 5-waves formation and is currently starting the wave E, rebounding from the lower border of the chart pattern.
What a trader may do?
We may go aggressive and trade long right immedia CAPITALCOM:ETHUSD tely with a take profit slightly below the 2,700.00 resistance level
🔼 a market buy order at 2544.19 with
❌a stop loss at 2489.90 and
🤑a take profit at 2691.35,
risk-reward ratio is 1:2.71 (nice one!)
However, I prefer to stay conservative and wait till the price tests the 2,700.00 level and enter the position there with
🔽 a pending sell stop order at 2691.35 with
❌a stop loss at 2759.92 and
🤑a take profit at 2409.89
risk-reward ratio here will be 1:4.1 (even better!)
In mid-term, I still expect ETHUSD to trade within a 2,400.00-2,700.00 range. So after assets reaches the 2,400.00, could be reasonable to look for new long opportunities! But will see.

Bullish momentum to extend?Ethereum (ETH/USD) is reacting off the pivot which is a pullback support and could rise to the 78.6% Fibonacci resistance.
Pivot: 2,595.10
1st Support: 2,525.42
1st Resistance: 2,735.62
Risk Warning:
Trading Forex and CFDs carries a high level of risk to your capital and you should only trade with money you can afford to lose. Trading Forex and CFDs may not be suitable for all investors, so please ensure that you fully understand the risks involved and seek independent advice if necessary.
Disclaimer:
The above opinions given constitute general market commentary, and do not constitute the opinion or advice of IC Markets or any form of personal or investment advice.
Any opinions, news, research, analyses, prices, other information, or links to third-party sites contained on this website are provided on an "as-is" basis, are intended only to be informative, is not an advice nor a recommendation, nor research, or a record of our trading prices, or an offer of, or solicitation for a transaction in any financial instrument and thus should not be treated as such. The information provided does not involve any specific investment objectives, financial situation and needs of any specific person who may receive it. Please be aware, that past performance is not a reliable indicator of future performance and/or results. Past Performance or Forward-looking scenarios based upon the reasonable beliefs of the third-party provider are not a guarantee of future performance. Actual results may differ materially from those anticipated in forward-looking or past performance statements. IC Markets makes no representation or warranty and assumes no liability as to the accuracy or completeness of the information provided, nor any loss arising from any investment based on a recommendation, forecast or any information supplied by any third-party.

ETHUSD SELL 2792On the daily chart, ETHUSD stabilized and rebounded, and short-term bulls have the upper hand. At present, we can pay attention to the resistance near 2792 above, which is a potential short position of the bearish bat pattern, and this position is in the previous supply area.

ETH///LONG///4h TIME FRAMEETH braking trend lines on 4h. Trendline is from 30 days. 1:2 risk to reward. GL
