(ETH/USD) Short Setup – May 27, 2025Currently watching ETH/USD as it taps into a key liquidity and supply zone around $2,713.
📍 Trade Idea:
Looking to sell in the red zone after an extended rally. This area aligns with:
Prior structural resistance
Strong impulse move into overhead liquidity
Volume spike + signs of possible exhaustion
🔍 Confirmation:
I’ll execute this trade only if order flow confirms (buyers trapped, sellers stepping in).
Watching closely for:
Absorption at the top
Reversal candle structure
Shift in momentum / volume imbalance
🎯 Target:
Green zone below – this aligns with a previous value area and inefficiency that price may seek to fill.
⚠️ Risk:
Tight stop-loss, accepting small risk for high potential reward (R:R ~22R)
Invalidation occurs if price breaks above the red zone with strength and sustained volume.
This is a reaction-based short setup — not a blind entry. I’m waiting for price to show signs of rejection before entering.
This idea is shared for educational purposes only. Not financial advice. Trade your plan and manage risk accordingly.
#Ethereum #ETHUSD #CryptoTrading #ShortSetup #PriceAction #VolumeProfile #OrderFlow #SmartMoney #TradingStrategy
ETHUSD trade ideas

ETH/USD short Setup🚨 ETH/USD Weekly Outlook 🚨
Ethereum is tapping into the $2,689–$2,692 weekly supply zone 🔼—a key resistance area! If it gets rejected here, brace for potential drops to $2,497, $2,397, and the big one: $2,231 🎯📉
🔧 Technical Bias: Bearish after supply tap 🔻
📉 Targets: 2497 → 2397 → 2231
🧠 Fundamentals: Rate hike fears 📈 + Altcoin weakness 😬
👀 Eyes on the chart—ETH might be gearing up for its next big move down! 🚦💣
#ETH #Ethereum #CryptoAnalysis #SupplyZone #BearishSetup #ETHUSD #TradingView #CryptoBreakdown #MarketWatch #TechnicalAnalysis #forex #gold

ETHUSDETHUSD has printed potential HH so i will make a buy limit entry using FIB at 0.382 leve(2617) With SL of 2510 and TP 2724 the risk on this trade is 0.3%

Be careful with ETH !!!Currently, ETH is forming an ascending triangle, indicating a potential price increase. It is anticipated that the price could rise, aligning with the projected price movement (AB=CD).
However, it is crucial to wait for the triangle to break before taking any action.
Give me some energy !!
✨We spend hours finding potential opportunities and writing useful ideas, we would be happy if you support us.
Best regards CobraVanguard.💚
_ _ _ _ __ _ _ _ _ _ _ _ _ _ _ _ _ _ _ _ _ _ _ _ _ _ _ _ _ _ _ _
✅Thank you, and for more ideas, hit ❤️Like❤️ and 🌟Follow🌟!
⚠️Things can change...
The markets are always changing and even with all these signals, the market changes tend to be strong and fast!!

ETHUSD INTRADAY bullish trend supported at 2,360Trend Overview:
Ethereum (ETH/USD) remains in a bullish trend, underpinned by a sequence of higher lows and a well-defined rising structure. Recent intraday price action reflects a consolidation phase, likely forming a bullish continuation pattern within the prevailing uptrend.
Key Technical Levels:
Support: 2,360 (primary), followed by 2,160 and 2,090
Resistance: 2,750 (initial), then 2,930 and 3,130
Technical Outlook:
A corrective pullback toward 2,360, which aligns with a prior consolidation zone, may offer a buy-the-dip opportunity. A successful retest of this level could set the stage for a continuation toward 2,750, 2,930, and 3,130 over the medium to long term.
However, a confirmed break and daily close below 2,360 would invalidate the near-term bullish outlook, increasing the risk of a deeper correction toward 2,160 and 2,090.
Conclusion:
ETH/USD continues to show bullish momentum as long as it holds above the 2,360 support level. A rebound from this zone would likely confirm the ongoing consolidation as a base for further upside. A breakdown below 2,360, however, would shift the short-term bias bearish, exposing Ethereum to deeper downside risk.
This communication is for informational purposes only and should not be viewed as any form of recommendation as to a particular course of action or as investment advice. It is not intended as an offer or solicitation for the purchase or sale of any financial instrument or as an official confirmation of any transaction. Opinions, estimates and assumptions expressed herein are made as of the date of this communication and are subject to change without notice. This communication has been prepared based upon information, including market prices, data and other information, believed to be reliable; however, Trade Nation does not warrant its completeness or accuracy. All market prices and market data contained in or attached to this communication are indicative and subject to change without notice.

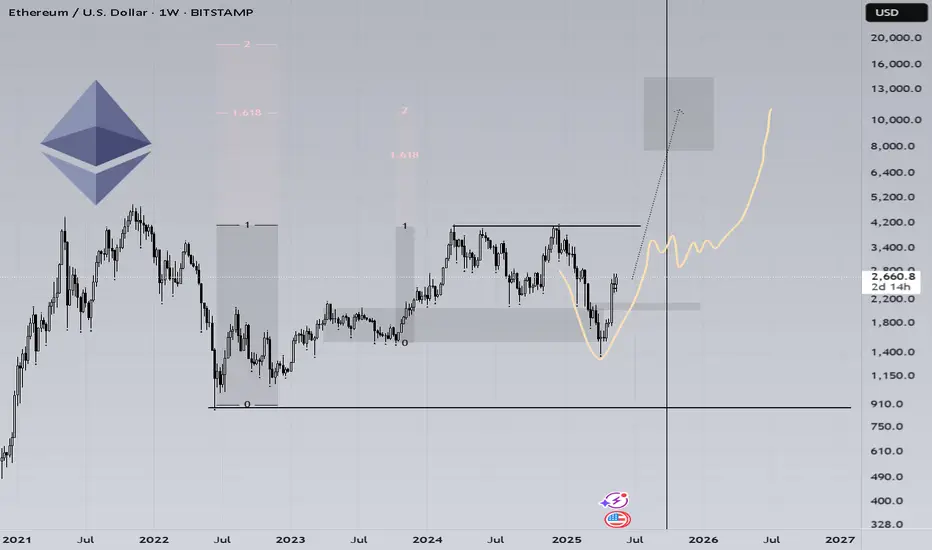
ETH 10 000$ soonAs for me, the fractial is the same)
Flashcrash in the preles of accumulation, the same good fast V-shaped reversal. BTC made 1.6 and 2 fib level, if copy paste it on ETH, it could be 10k$ easily. The dominance on the TOP, ETH/BTC on historical bottom. The cyclicality of the cryptocurrency market persists.
I would like to see June growth, going sideways at higher values closer to August. And starting in the fall to make the final movement.
They’re still laughing at $ETH.They’re still laughing at $ETH.
But the chart is screaming bullish.
Multi-year base + clean pennant = launch setup.
$8,000 is just the beginning.
Don’t fade it.

ETHEREUM FINAL PUMP INCOMINGETHEREUM FINAL PUMP INCOMING
The breakout is in.
Every cycle, CRYPTOCAP:ETH breaks ATH… then goes vertical.
This time won’t be different.
Don’t fade the final pump.

ETHEREUM FINAL PUMP INCOMINGETHEREUM FINAL PUMP INCOMING
The breakout is in.
Every cycle, CRYPTOCAP:ETH breaks ATH… then goes vertical.
This time won’t be different.
Don’t fade the final pump.

ALTCOIN ROADMAP: REVISITED!!! Ethereum vs NvidiaOne of the most insightful ratio charts that provides a remarkable glimpse into the vitality of Altcoins and the appetite for risk is when Ethereum outshines one of the fastest rising stars in the stock market, #NVDA!
The conventional Altcoin index indicates how many of the top 100 Altcoins are outperforming #BTC.
This is indeed a valuable metric that we can rely on for identifying peaks.
However, I believe that if we broaden our perspective and examine the ETH ratio against a Tech Titan, we can truly pinpoint the timing of the banana zone. When it starts and when it is confirmed violent uptrend.
My interest in this ratio was sparked when ETH was still a proof of work coin, validated through GPUs; it seemed like a natural starting point to assess whether the ETH price was overvalued or undervalued.
Even after the transition to POS, I still think it’s worth analysing, as shown by the recent double bottom on the ratio!
The next crucial question is when we can break the multi-year downtrend to genuinely confirm the Banana zone. Because without ETH, there’s no party.
If we enter a big strong banana zone, I believe the ratio could swiftly trend towards 100, so we will be keeping a close eye on it!

ETH weekly consolidationETH currently trading in a weekly balance range. Looking like some bullish consolidation for a major move up back to 4k. Idea may take some more time to play out, but the longer it takes, the better the move. ETH to $4000

H&S should lead the breakout Very simple but the dip inside Head and shoulders or buy near the breakout formation.
Ethereum should finally tise and break Resistance #1 and reclaim 2585 then lastly to break above 2650 #2 Resistance

ETH/USD_ CUP AND HANDLE FORMATION ON 4H Chart This chart displays a classic "Cup and Handle" pattern forming on the Ethereum (ETH/USD) 4-hour timeframe. The pattern suggests a bullish continuation setup following a strong upward trend. The cup is smoothly rounded, indicating consolidation after an uptrend, while the handle shows a brief downward channel before breakout. The price has approached the resistance zone, and a breakout above it could confirm the pattern, signaling bullish momentum. The Ichimoku cloud also supports potential upside movement as the price is breaking through it, adding confluence to the bullish setup.
Entry: 2535
Target Points:
1st Target: 2700
2nd Target: 2800
3rd Target: 2900

Ethereum H4 | Approaching a swing-low supportEthereum (ETH/USD) is falling towards a swing-low support and could potentially bounce off this level to climb higher.
Buy entry is at 2,364.35 which is a swing-low support.
Stop loss is at 2,250.00 which is a level that lies underneath an overlap support.
Take profit is at 2,693.55 which is a multi-swing-high resistance.
High Risk Investment Warning
Trading Forex/CFDs on margin carries a high level of risk and may not be suitable for all investors. Leverage can work against you.
Stratos Markets Limited (tradu.com ):
CFDs are complex instruments and come with a high risk of losing money rapidly due to leverage. 63% of retail investor accounts lose money when trading CFDs with this provider. You should consider whether you understand how CFDs work and whether you can afford to take the high risk of losing your money.
Stratos Europe Ltd (tradu.com ):
CFDs are complex instruments and come with a high risk of losing money rapidly due to leverage. 63% of retail investor accounts lose money when trading CFDs with this provider. You should consider whether you understand how CFDs work and whether you can afford to take the high risk of losing your money.
Stratos Global LLC (tradu.com ):
Losses can exceed deposits.
Please be advised that the information presented on TradingView is provided to Tradu (‘Company’, ‘we’) by a third-party provider (‘TFA Global Pte Ltd’). Please be reminded that you are solely responsible for the trading decisions on your account. There is a very high degree of risk involved in trading. Any information and/or content is intended entirely for research, educational and informational purposes only and does not constitute investment or consultation advice or investment strategy. The information is not tailored to the investment needs of any specific person and therefore does not involve a consideration of any of the investment objectives, financial situation or needs of any viewer that may receive it. Kindly also note that past performance is not a reliable indicator of future results. Actual results may differ materially from those anticipated in forward-looking or past performance statements. We assume no liability as to the accuracy or completeness of any of the information and/or content provided herein and the Company cannot be held responsible for any omission, mistake nor for any loss or damage including without limitation to any loss of profit which may arise from reliance on any information supplied by TFA Global Pte Ltd.
The speaker(s) is neither an employee, agent nor representative of Tradu and is therefore acting independently. The opinions given are their own, constitute general market commentary, and do not constitute the opinion or advice of Tradu or any form of personal or investment advice. Tradu neither endorses nor guarantees offerings of third-party speakers, nor is Tradu responsible for the content, veracity or opinions of third-party speakers, presenters or participants.

Weekly trading plan for EthereumIn this idea I marked the important levels for this week and considered a few scenarios of price performance
The price is near the Pivot point, if the price breaks it and cannot go back above, we can expect a deep correction
Write a comment with your coins & hit the like button and I will make an analysis for you
The author's opinion may differ from yours,
Consider your risks.
Wish you successful trades ! mura

$ETH and $TSLA run hardest with cheap moneySentiment has grown increasingly negative on TSLA and ETH in recent months.
I believe while frustrations could be high, they still have a place in your portfolio. The catch with ETH and TSLA is that they need low interest rates to truly run.
This chart shows ETHUSD on the top, 2wk candles. You can see that it’s forming a large pennant on the chart. Since we entered the pennant from below, we are most likely to continue out of the top of the pennant— but we won’t know until it is confirmed with a breakout and retest.
Below that, I have the RSI indicator, which is also clearly consolidating and ready for a breakout.
The pink line is TSLA, a stock that I thought performed similarly to ETH and wanted to analyze. Finally the last line is the Federal Funds Rate. I inserted a vertical line where the rate hit zero effectively- and you can see how they both began to go parabolic shortly thereafter.. just a coincidence? What are some other stocks that have this similar of a correlation?
High CAGR stocks and commodities can chop for what feel like painfully long periods.. patience!

ETH is moving within the 2495.00 - 2735.00 range👀 Possible scenario:
Despite recent price weakness, Ether ETPs saw $326M in inflows last week - the fifth consecutive week of gains following the May 7 Pectra upgrade. ETH briefly hit $2,720 before correcting. A breakout above resistance could push it toward $2,800-$2,850 soon.
The buy/sell pressure delta remains negative, showing sellers still dominate short term. But recent metrics point to a weakening bearish trend, hinting at a potential reversal ahead. Data-driven investors are spotting early signs of change. Liquidity clusters near $4,400 and $1,700 suggest volatility is imminent—levels that often trigger sharp price swings. While risks stay elevated, improving signals indicate Ethereum may be gearing up for a rebound.
✅ Support and Resistance Levels
Support level is now located at 2,495.00.
Now, the resistance level is located at 2,735.00.

$ETH - Ethereum enters buy zoneHey traders!
How is your portfolio doing? Trump is shaking us!
After all these months in 2025 I've tried to project a new scenario (bullish/bearish) that clarifies our next outlook.
Not an easy job. As you see day by day, markets are in high volatility due to trade war and (not trying to be pesimistic) could be worse.
However, In my opinion Ethereum (and altcoin markets) are entering into a golden opportunity. that has to be taken 100%. Don't know where is the bottom for CRYPTOCAP:ETH on a short scenario. But, what I can certainly say is that won't fall as a stone for too long.
Ranges between 1400 - 2000 USD are gold prices to make progressives buys. Although it could fall even more ( 900 - 1200 USD) I think this is a high Risk reward buy.
But, timing is not on time. Shouldn't I sell, expecting a bear market( you know Halving and Posthalving ideas). Times have changed as the macro scenario has not been the same as the previous bullruns.
So, it's time to accumulate and expect a possible expansion cycle in 2026.. That could lead Ethereum to prices never seen before. Yes, the range between 8.000 - 15.000 USD.
As I always say. Just my opinion. Stay safe!

#ETH/USDT#ETH
The price is moving within a descending channel on the 1-hour frame, adhering well to it, and is on its way to breaking it strongly upwards and retesting it.
We are seeing a rebound from the lower boundary of the descending channel, which is support at 2313.
We have a downtrend on the RSI indicator that is about to break and retest, supporting the upward trend.
We are looking for stability above the 100 moving average.
Entry price: 2400
First target: 2466
Second target: 2512
Third target: 2602

Eth Big PictureThis gives you an idea of the Ethereum Big Picture.
As you can see its stil in the lower 30% of activity in the past five years.
This is a positive sign that there is definitely more liquidity to come.
Ethereum has always been a solid backbone for transactions through the web
and also where gaming and nft's are concerned. It is lightning speed fast, and
has shown its ecosystem to be reliable. It's not Bitcoin. It's Ethereum.
It's used as a power horse to do all transactions on the blockchain.
Love it or hate it Ethereum is here to stay.

ETHUSD📊 1H Analysis – ETHUSD
Strategy: 🐊 Alligator Strategy
Trend: 📈 Strong Uptrend
📝 Trade Plan
🎯 Entry Point (EP): 2577
🛡️ Stop Loss (SL): 2514.76
💰 Take Profit 1 (TP1): 2645.46
🚀 Take Profit 2 (TP2): 2706.17
🔄 Execution:
Open two trades at the Entry Point (2577)
When TP1 hits, move SL to EP for the remaining trade
Let the second trade ride to TP2 or more

ETHUSD📊 1D Analysis – ETHUSD
Strategy: 🐊 Alligator Strategy
Trend: 📈 Strong Uptrend
📝 Trade Plan
🎯 Entry Point (EP): 2577
🛡️ Stop Loss (SL): 2514.76
💰 Take Profit 1 (TP1): 2645.46
🚀 Take Profit 2 (TP2): 2706.17
Open two trades When TP1 hits move your SL to Entry point for and ride TP2.

ETHUSDTThis chart illustrates Ethereum’s price action on the daily timeframe, showcasing a clear structural outlook based on historical price behavior and major resistance zones.
Ascending Trendline Support: ETH is currently respecting a long-term ascending trendline (white and blue lines), which has acted as dynamic support since mid-2022. Despite temporary breakdowns, price has re-entered this channel, suggesting bullish momentum is attempting a recovery.
Key Resistance Zones:
$4,000 – $4,800: This is the nearest major resistance area, highlighted by past cycle tops. ETH must decisively break above this zone to confirm a macro bullish continuation.
$6,800 – $7,600: A significant mid-cycle resistance from historical price action, likely to serve as the next major target upon breakout.
$9,200 – $10,000: The final upper target zone on this chart, representing psychological and technical resistance if ETH enters a strong bull market phase.
Current Price: As of today, ETH is trading around $2,580 with a +1.09% daily gain, suggesting a potential continuation towards the first resistance zone.
This analysis suggests that Ethereum is attempting a macro reversal, and reclaiming the ascending channel strengthens the bullish case. However, multiple resistance levels remain overhead, which will require strong volume and market sentiment to overcome.
