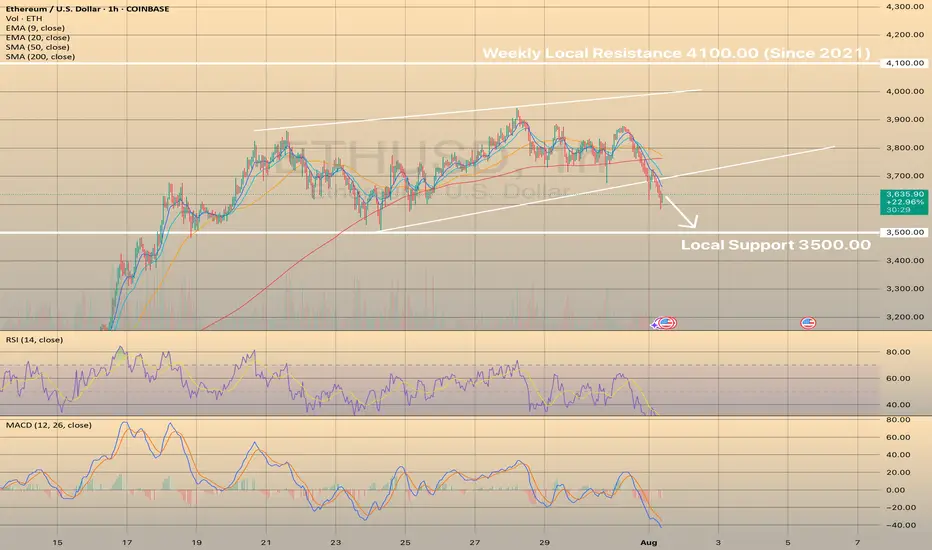
ETHUSD BROKE THE LOWER BORDER OF THE WEDGE. PRICE IS MOVING TOWAETHUSD BROKE THE LOWER BORDER OF THE WEDGE. PRICE IS MOVING TOWARDS THE LOCAL SUPPORT.
Yesterday, Ethereum saw its largest monthly increase since July 2022, thanks to strong inflows into exchange-traded funds and increased activity in the Ethereum treasury. US exchanges are working to obtain regulatory approval for a standardized framework for listing crypto funds. Coinbase and JPMorgan have joined forces to provide Chase customers with access to crypto products.
Despite these positive developments, the short-term outlook does not indicate a bullish setup. It appears that all the information has already been factored into the price. The pair moves towards the local support of 3,500.00. However, in the long term, these developments are favorable for investment.
ETHUSD trade ideas
$ETH to $6.45k USD - 2024's Crescendo CRYPTOCAP:ETH is showing strong signs of an impending breakout to the $6.4k–$8k range, backed by two key technical indicators:
Cup & Handle Formation: ETH has recently broken out of a textbook cup and handle pattern, confirming the breakout with a solid retest over this past week of VOL. This is a classic bullish signal pointing to higher targets.
Bull Pennant: Since the 2021 rally, ETH has been consolidating within a massive bull pennant. This long-term structure suggests Ethereum is coiled and ready for a significant move upward.
1.618 Fib: Also layering in a Fibonacci retrace, if ETH is indeed heading for ATHs and price discovery, the 1.618 FIB is a common level that traders are very familiar with. It just so happens to be right in the middle of our target box at ~$7k!
Momentum is building— we will need to keep an eye on volume and follow-through for confirmation.
To boot, bearish sentiment for ETH is near all time highs. I think it might be time for a most-hated rally. I have a short term allocation in AMEX:ETHT to ride this momentum, NFA DYOR

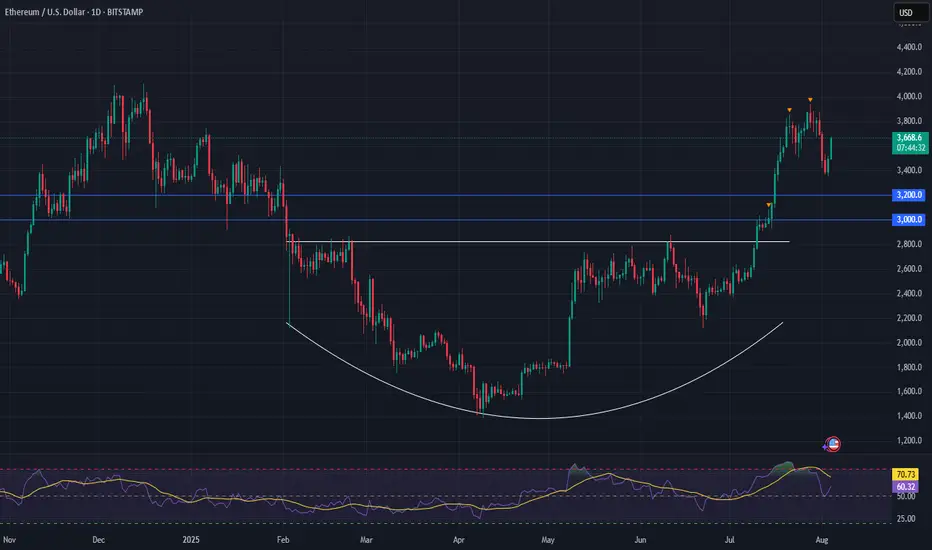
Ethereum (ETH) is setting up for a powerful moveFollowing a strong breakout, ETH has entered a healthy consolidation phase—setting the stage for its next leg higher.
Momentum remains firmly on the bulls’ side, with the breakout from a long-term saucer pattern fueling continued upside pressure.
📈 Technical Highlights:
✅ Short-term target: $4,000+ (breakout continuation)
✅ Long-term potential: $7,000+
🛡️ Key support: $3,000–$3,200 (bullish as long as this holds)
📣 Takeaway:
Ethereum is showing classic bullish structure. With higher-lows forming and strong support below, pullbacks are likely to offer high-probability entries for both traders and long-term holders.
#Ethereum #ETHUSD #Crypto #Trading #TechnicalAnalysis #CryptoTrading #EthereumPrice #Altcoins #Bullish #Breakout
$Eth Bearish Divergence Alert – Correction Ahead?#ETHUSDT is approaching the $4000 zone, but momentum indicators signal caution 🧨
🔸 Bearish divergence spotted on RSI – price making higher highs, while RSI makes lower highs
🔸 MACD is showing signs of weakening bullish momentum
🔸 Stochastic RSI reflects fading buyer strength, hinting at possible seller dominance
If correction plays out, key support zones to watch are $3000 – $3200 👀
That range may offer a bounce opportunity, but if broken, deeper downside is possible ⚠️
Trade wisely and always manage risk 🎯
#Ethereum #CryptoAnalysis #BearishDivergence #CryptoSignals

Ethereum Long: Using Log Chart to Analyze, Target $6600In this video, I go through the analysis using the log chart for Ethereum and shows the potential of this cryptocurrency where I expect the price to reach new high in the coming days with a longer-term target of $6600.
For shorter-term trading, I recommend placing the stop a distance below recent support on the daily chart, around $3372.
Good luck!

ETH BUY SETUP ,Bought From $3830ETH BUY SETUP
Currently $3830
Bought From $3830
(Trading plan If ETH go down ,
to $3700 will add more longs)
Expecting target $3890 OR ABOVE
Stoploss at $3470
In the event of an early exit,
this analysis will be updated.

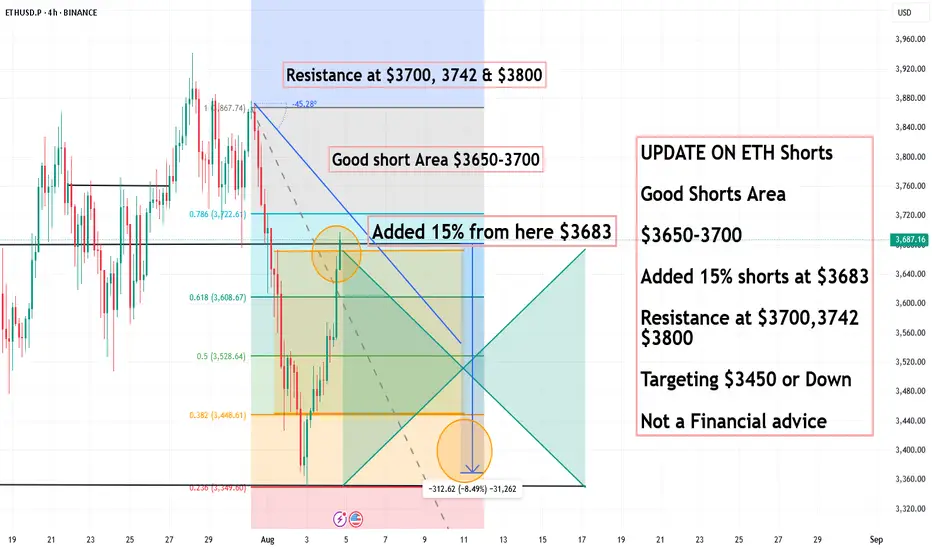
UPDATE ON ETH Shorts, Good Shorts Area $3650-3700UPDATE ON ETH Shorts
Good Shorts Area
$3650-3700
Added 15% shorts at $3683
Resistance at $3700,3742
$3800
Targeting $3450 or Down
Not a Financial advice
ETH potential reenteryHELLO THERE)
imma post here again
lemme know in what type of content ur intrested most
Ive been trading all that time
almost 8 years atm
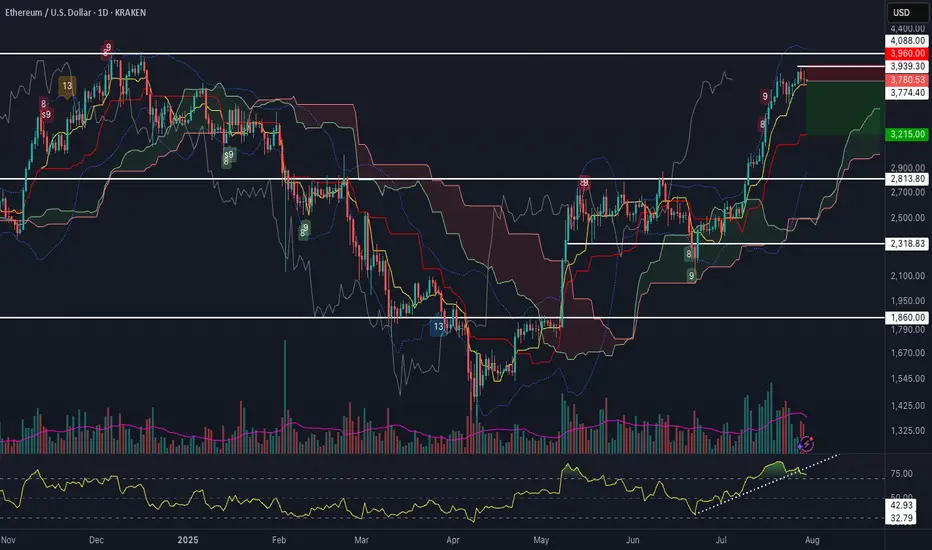
ETH Potential Swing ReversalAfter a strong leg higher, Ethereum is flashing a confluence of short-term reversal signals:
1. RSI trendline break on the daily, with bearish divergence building
2. %B Bollinger Band divergence, following three consecutive upper band taps during this move
3. Demark 9
4. Formation of a Doji candle at resistance, showing indecision near a key level
A clean break here opens room towards Ichimoku cloud support at $3,215.
🧠 Thoughts welcome!
ETH Reposition Play – VolanX DSS Sentiment Filter Active📉 ETH Reposition Play – VolanX DSS Sentiment Filter Active
🧠 VolanX DSS Triggered a Long Watchlist Signal
The ETH/USDT daily chart shows price stalling near the 0.786 Fib zone after a strong rally. Our proprietary DSS (Decision Support System) now monitors sentiment misalignment to prepare for the next institutional push.
🔍 Key DSS Observations:
Retail Sentiment: Fearful — retail bias flipped to short.
News Headlines: Negative — VADER sentiment ≈ –0.45.
Funding Rates: Flipped to negative across major exchanges.
Fear & Greed Index: 28 (deep fear zone).
📊 All 4 signals confirm contrarian long opportunity in “Reposition Zone” (≈ 3566–3280). Smart Money often absorbs panic exits before triggering the next leg.
🎯 DSS Strategy:
✅ Wait for confirmation at 3,280 or wick flush to 3,061.
📈 Potential upside target = 5,033 (1.618 Fib extension)
🛡️ DSS Sentiment Filter = ✔ Passed (4/4 bearish crowd indicators)
“When the crowd panics, liquidity positions. VolanX knows this.” – WaverVanir Protocol
📡 Signal monitored via VolanX Alpha Engine
🔒 Institutional tracking | AI-guided logic | DSS Probability Matrix
#ETH #Ethereum #Crypto #WaverVanir #VolanX #SmartMoney #SentimentTrading #AlphaProtocol #DSS #Reposition

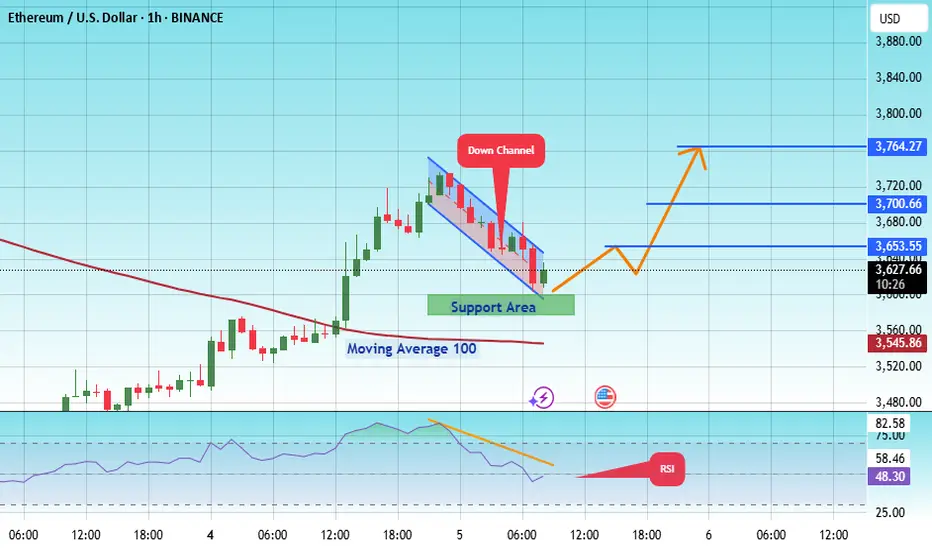
#ETH/USDT : Price is going as expected in previous ideas on eth#ETH
The price is moving within an ascending channel on the 1-hour frame, adhering well to it, and is on track to break it strongly upwards and retest it.
We have support from the lower boundary of the ascending channel, at 3593.
We have a downtrend on the RSI indicator that is about to break and retest, supporting the upside.
There is a major support area in green at 3582, which represents a strong basis for the upside.
Don't forget a simple thing: ease and capital.
When you reach the first target, save some money and then change your stop-loss order to an entry order.
For inquiries, please leave a comment.
We have a trend to hold above the 100 Moving Average.
Entry price: 3626.
First target: 3653.
Second target: 3700.
Third target: 3764.
Don't forget a simple thing: ease and capital.
When you reach your first target, save some money and then change your stop-loss order to an entry order.
For inquiries, please leave a comment.
Thank you.
Eth/Usd Possible pathEthereum declared a possible bullish move that pends a retest. Depending on the momentum of the market, the market is likely to retest today or tomorrow in order to keep the week bullish.
ETHUSD The Week Ahead Key Support and Resistance Levels
Resistance Level 1: 3677
Resistance Level 2: 3752
Resistance Level 3: 3833
Support Level 1: 3485
Support Level 2: 3400
Support Level 3: 3316
This communication is for informational purposes only and should not be viewed as any form of recommendation as to a particular course of action or as investment advice. It is not intended as an offer or solicitation for the purchase or sale of any financial instrument or as an official confirmation of any transaction. Opinions, estimates and assumptions expressed herein are made as of the date of this communication and are subject to change without notice. This communication has been prepared based upon information, including market prices, data and other information, believed to be reliable; however, Trade Nation does not warrant its completeness or accuracy. All market prices and market data contained in or attached to this communication are indicative and subject to change without notice.

ETHUSD bullish consolidation supported at 3,485The ETHUSD remains in a bullish trend, with recent price action showing signs of a corrective pullback within the broader uptrend.
Support Zone: 3,485 – a key level from previous consolidation. Price is currently testing or approaching this level.
A bullish rebound from 3,485 would confirm ongoing upside momentum, with potential targets at:
3,800 – initial resistance
3,855 – psychological and structural level
3,930 – extended resistance on the longer-term chart
Bearish Scenario:
A confirmed break and daily close below 3,485 would weaken the bullish outlook and suggest deeper downside risk toward:
3,372 – minor support
3,240 – stronger support and potential demand zone
Outlook:
Bullish bias remains intact while the ETHUSD holds above 3,485. A sustained break below this level could shift momentum to the downside in the short term.
This communication is for informational purposes only and should not be viewed as any form of recommendation as to a particular course of action or as investment advice. It is not intended as an offer or solicitation for the purchase or sale of any financial instrument or as an official confirmation of any transaction. Opinions, estimates and assumptions expressed herein are made as of the date of this communication and are subject to change without notice. This communication has been prepared based upon information, including market prices, data and other information, believed to be reliable; however, Trade Nation does not warrant its completeness or accuracy. All market prices and market data contained in or attached to this communication are indicative and subject to change without notice.

ETHUSD – Holding the LineETH is flirting with breakout mode, reclaiming its 200 SMA at $3,477 and pushing to $3,569. RSI is recovering from a dip and regaining upside pressure. Momentum holds above $3,525.

ETHUSD - CURRENT OUTLOOK ON ETHEREUMI am currently expecting the dollar to slowly regain strength, and while this is happen, I expect institutions/large funds to begin profit taking from these price ranges.
"May fortune attend thee, and thy trade prosper." .......L2Earned

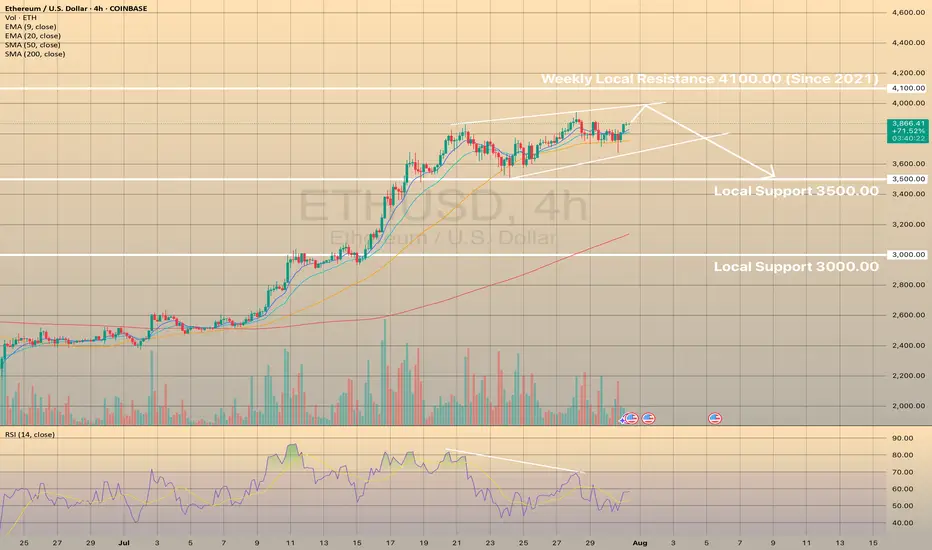
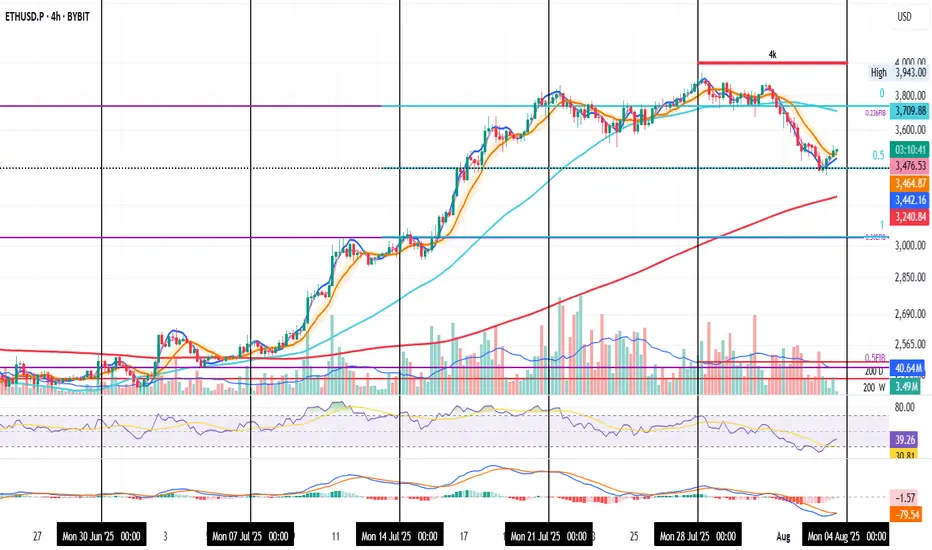
ETHUSD MAY FORM THE BEARISH WEDGE. THE PRICE IS GETTING READY TOETHUSD MAY FORM THE BEARISH WEDGE. THE PRICE IS GETTING READY TO DROP.
ETHUSD has been moving bullish since July 8. However since July 21 the price started to form the bearish wedge with bearish divergence on RSI on 4-h timeframe.
A bearish wedge is a bearish reversal pattern in an uptrend, where the price forms higher highs and higher lows within converging upward trendlines, signaling weakening bullish momentum and a potential downward reversal. To trade, identify the wedge with declining volume and confirm with RSI or divergence. Sell or short on a breakdown below the lower trendline with a volume spike. Set a stop-loss above the recent high or upper trendline. Target the wedge’s height projected downward from the breakdown or the next support level with a 1:2 risk-reward ratio.
We expect that the price will establish another bullish momentum and the price will go towards upper border of the wedge, slightly below the 4,100.00 resistance level and will decline towards 3,500.00 support level afterwards.
ETH 4H Mid-Zone BounceETH on the 4H
ETH found support right at the midpoint between the 0.382 and 0.236 Fib levels — exactly at yesterday’s close.
Price closed above the BB center, and the SMA is also holding above it — early signs of recovery.
RSI formed a double bottom in the oversold zone and has now crossed above its moving average.
MACD is about to flip bullish.
I remain bullish and still holding my long, but with tight risk management.
Always take profits and manage risk.
Interaction is welcome.
Bearish revrsal?The Ethereum (ETH/USD) is rising towards the pivot and could reverse to the 1st support.
Pivot: 3,760.94
1st Suport: 3,372.83
1st Resistance: 3,936.31
Risk Warning:
Trading Forex and CFDs carries a high level of risk to your capital and you should only trade with money you can afford to lose. Trading Forex and CFDs may not be suitable for all investors, so please ensure that you fully understand the risks involved and seek independent advice if necessary.
Disclaimer:
The above opinions given constitute general market commentary, and do not constitute the opinion or advice of IC Markets or any form of personal or investment advice.
Any opinions, news, research, analyses, prices, other information, or links to third-party sites contained on this website are provided on an "as-is" basis, are intended only to be informative, is not an advice nor a recommendation, nor research, or a record of our trading prices, or an offer of, or solicitation for a transaction in any financial instrument and thus should not be treated as such. The information provided does not involve any specific investment objectives, financial situation and needs of any specific person who may receive it. Please be aware, that past performance is not a reliable indicator of future performance and/or results. Past Performance or Forward-looking scenarios based upon the reasonable beliefs of the third-party provider are not a guarantee of future performance. Actual results may differ materially from those anticipated in forward-looking or past performance statements. IC Markets makes no representation or warranty and assumes no liability as to the accuracy or completeness of the information provided, nor any loss arising from any investment based on a recommendation, forecast or any information supplied by any third-party.

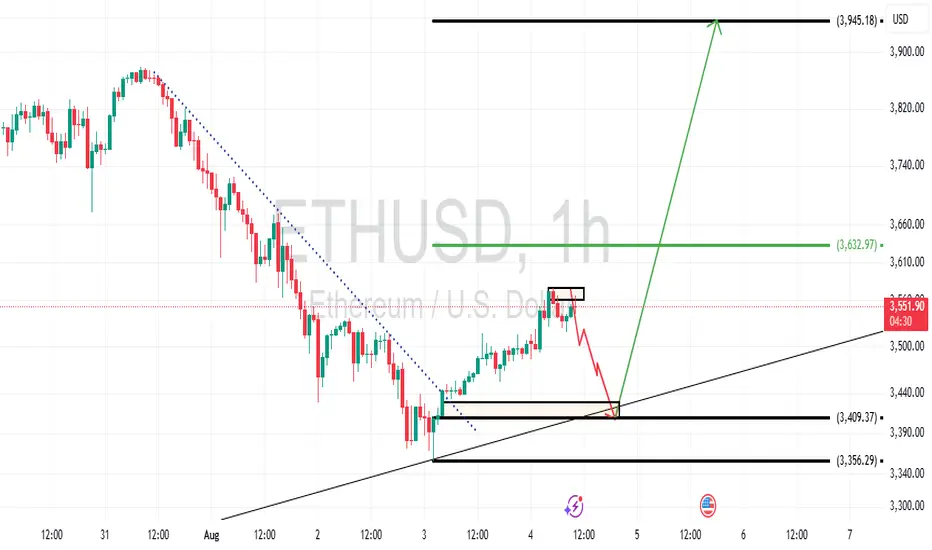
ETHUSD: How I see 15 min chart. Technical Context
Price completed a 5-wave decline into Wave 4 support at $3,246 (1.236 Fib extension of Wave 3) within a rising pitchfork channel
Expect a multi-leg accumulation between the orange lower pitchfork line and the red median line before resuming the up-trend
Accumulation Trajectory
Initial Leg: Bounce off $3,246 → rally to $3,563 (0.618 Fib of the entire drop)
Secondary Pullback: Retrace toward the orange trendline (~$3,400)
Subsequent Rallies: Series of higher lows along orange support, testing channel median at ~$3,600–3,650
Final Shakeout: Quick flush toward $3,300–3,350 to clear weak hands before impulsive leg
Intraday Trade Plan
Entry Zones
Tier 1: Near $3,260–3,280 (first swing low)
Tier 2: Along orange rising support (~$3,350 on strength)
Targets
Partial at $3,563 (0.618 retracement)
Full exit near red median line (~$3,625–3,650)
Stop-Loss
Below $3,230 (just under accumulation low)
Position Sizing
Risk ≤ 0.5% of account per leg; scale in on confirmation candles
“Fear in China might prompt a sell-off; use these dips to accumulate for the next impulsive wave.”
References
Murphy, J. J. (1999). Technical analysis of the financial markets. New York, NY: New York Institute of Finance.
Prechter, R. R., & Frost, A. J. (2005). Elliott wave principle: Key to market behavior (10th ed.). New Classics Library.

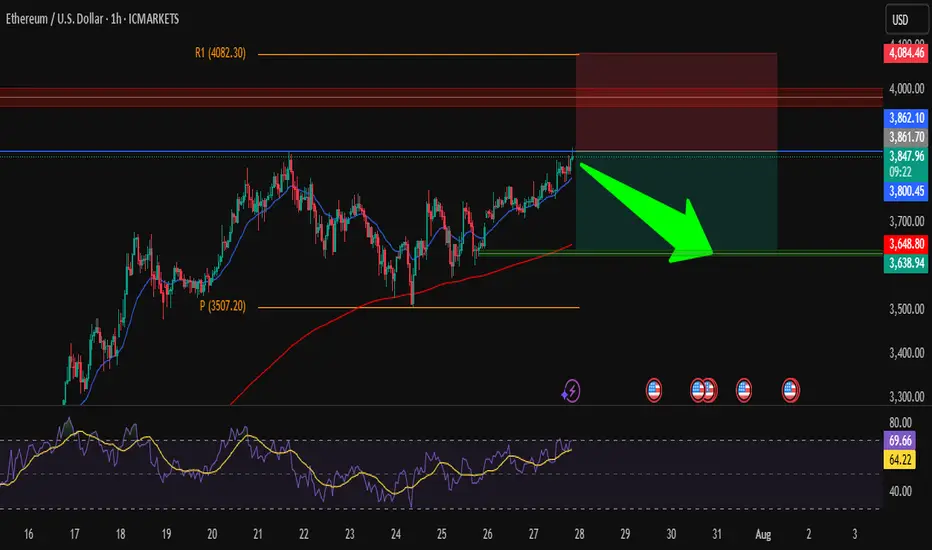
ETH/USD – Short from ResistanceHi traders ! , I opened a short position on ETH/USD as price is hitting a strong resistance zone.
Entry: 3850
SL: 4084.46
TP: 3638.94
📌 Why I took this trade:
Price is testing a strong resistance zone around 3860, RSI is overbought, and we could see a pullback toward the support area around 3640.
Nice risk/reward setup, keeping it simple.
This is just my analysis, not financial advice.
What’s your view — drop or breakout?
ETHUSD: Bearish Divergence + Double TopHi everyone!
Ethereum – Double Top with Bearish Divergence
On the 4H chart, ETH is forming a clear double top while MACD prints a strong bearish divergence, signaling momentum loss.
📉 Neckline: $3,500 – this level acts as the key trigger.
🔻 Target: $3,000 – aligns with the 0.618 Fibonacci retracement and previous demand zone.
A confirmed break below $3,500 would validate the pattern and open the way to a deeper correction into the $3,000 area. As long as price stays under the second top, the bearish setup remains active.

Trendline break The price has broken out of a trendline followed by a pullback and now the price looks to go short
WE ONLY TRADE PULLBACKS
