Pectra Breakout to Unleash a New All-Time High? Ethereum’s Breakout Moment – Pectra to Unleash a New All-Time High?
Post with Emojis:
💎🚀 Ethereum’s Breakout Moment – Pectra to Unleash a New All-Time High? 🚀💎
Hey Traders!
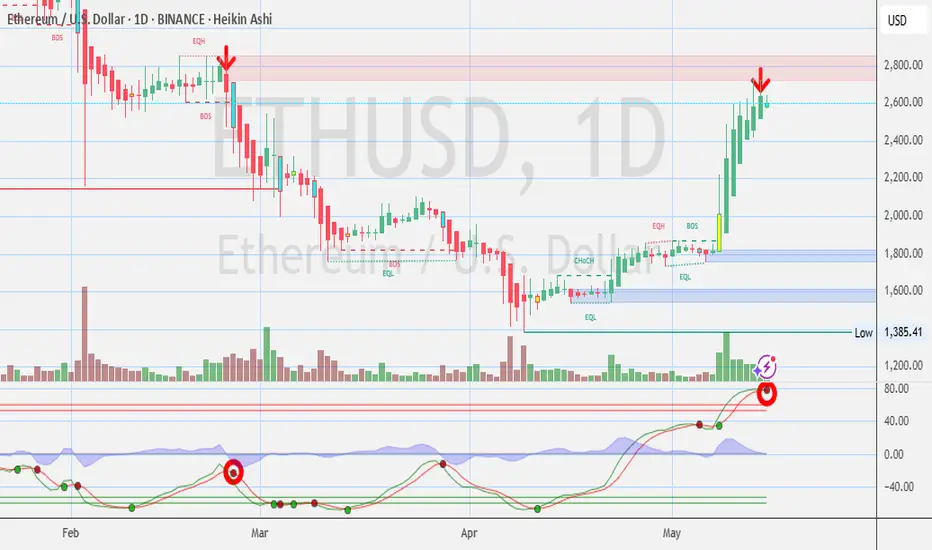
Ethereum is standing at the gates of its next legendary move! With price holding strong above $2,531 and the Pectra upgrade just around the corner, all the stars are aligning for what could become one of the biggest rallies since The Merge. Are you ready for the breakout of the year?
📊 Key Levels to Watch:
📍 Support: $2,531 – Bulls holding the line perfectly.
🚀 Breakout Levels: $2,805 – $2,848 – The historic ‘Clashing Rocks’ resistance zone.
🎯 Immediate Targets: $3,200 – $3,500 🚀
🏆 Ultra Bullish Target: $4,000+ All-Time High Breakout Incoming!
📚 Why This Is NOT Just Another Pump:
🔧 Pectra Upgrade is a Game Changer:
💡 Smarter Wallets: No more annoying popups—seamless transactions!
⚡ Frictionless UX: Say goodbye to endless “approve + confirm” loops.
📉 Cheaper Transactions: Blobs scaling kicks in—lower fees, even in the craziest market conditions!
🌱 Staking Revolutionized: Bigger validator caps, faster deposits, smart contract withdrawals.
🔓 Unlocking $490B in Trapped Value: Capital flows freely—fueling the next bull run!
Ethereum is no longer just an asset—it’s transforming into the most efficient and user-friendly financial platform ever built.
💬 Question for You:
Are you already on board this rocket, or are you still watching from the sidelines? Which level will break first—$2,805 or $3,200?
Remember: When history and technology collide, markets explode. This is that moment.
One Love,
The FXPROFESSOR 💙
ps Trump bringing money from all over the place dominate news: for sure some ends up in Ethereum
ETHUSD trade ideas

ETH - Daily Chart ETH DAILY CHART LOOKS LIKE TURNING DOWN? OPINIONS?
Thanks
Not for financial advice
Not for recommendations to buy sel any Stocks, crypto or FX.
DYOR
ETH - Ethereum Daily Chart No Positions
Not for financial advice
Not for recommendations to buy sel any securities, stocks, crypto or FX.
Just for fun charting hobby stuff
DYOR

ETH sub $1k coming soonCRYPTOCAP:ETH is rejecting resistance here. Unless we can flip it as support, then it looks like new lows are coming.
I think the most likely level to find support is at $753, however I marked off other levels that are important incase we find support there.
You'll want to bid these levels because they'll be the buy of the decade, should we get down there.

I'm calling for $10,000 per Ethereum.I think Ethereum could reach $10,000 or even $20,000 if we really go parabolic in wave 5.
We are potentially gearing up for the biggest crypto bull market in human history, and Ethereum should be a major player in this move.
As always, stay profitable.
– Dalin Anderson

ETH small short before new highETH small short before new high.
I believe the price will fall and resume rising very soon.

ETH short than longLooking at Ethereum right now, $2760 is showing solid resistance. I’ve taken a short position there, expecting a pullback as momentum fades.
If price drops significantly, I’ve got a buy order waiting at $1870 — a key level from previous structure and a potential bounce zone if the market overreacts.
No emotions, just levels. Manage your risk and let the trade come to you. 👇
Short: $2760
Buy Limit: $1870

Ethereum - Bull run over Ethereum Weekly Chart Analysis (as of May 14, 2025)
1. Breakdown of M-Pattern:
Ethereum has clearly formed and broken down from a large M-pattern, indicating a bearish double-top structure.
This breakdown suggests weakness and the potential for a deeper correction if critical support levels fail.
2. Retest of Triangle Pattern:
After the breakdown, ETH has retested the lower boundary of a previously broken ascending triangle.
This retest aligns with the $2,746–$2,370 zone, which is now acting as a strong resistance cluster.
3. Current Price Zone – No Trading Zone:
Ethereum is currently trading around $2,587, right in a no-trading zone (highlighted in the chart box).
This zone represents indecision — neither a clear breakout nor breakdown — suggesting traders should wait for confirmation.
4. Bearish Scenario – Pin Zone Break:
A break below $2,370, the key horizontal support (also the neckline of the M-pattern), would likely confirm renewed bearish momentum.
If this level is decisively broken, expect a strong downward move.
5. Downside Targets:
First major support: $1,410 – previous swing low.
Final bearish target (highlighted in purple): $1,000–$1,004 — a psychological and historical support level.
6. Upside Scenario (less probable currently):
ETH would need to reclaim $2,746 and break back into the triangle to invalidate the bearish setup.
Only then could the long-term target of $5,391 be reconsidered.
Conclusion:
Ethereum is in a critical decision zone. While the macro pattern signals bearish continuation, confirmation will come on a break below $2,370. If that happens, a drop toward $1,000 is highly likely. Traders should remain cautious and avoid new positions until a decisive move occurs.

Midweek breakdown 14.5.2025Markets are shaping up for some nice moves across the board.
Implementing an abundance mindset is my main goal for this quarter

FXAN & Heikin Ashi Trade IdeaBINANCE:ETHUSD
In this video, I’ll be sharing my analysis of ETHUSD, using FXAN's proprietary algo indicators with my unique Heikin Ashi strategy. I’ll walk you through the reasoning behind my trade setup and highlight key areas where I’m anticipating potential opportunities.
I’m always happy to receive any feedback.
Like, share and comment! ❤️
Thank you for watching my videos! 🙏

Ethereum H4 | Overlap support at 23.6% Fibonacci retracementEthereum (ETH/USD) is falling towards an overlap support and could potentially bounce off this level to climb higher.
Buy entry is at 2,455.05 which is an overlap support that aligns close to the 23.6% Fibonacci retracement.
Stop loss is at 2,250.00 which is a level that lies underneath an overlap support.
Take profit is at 2,846.25 which is a multi-swing-high resistance.
High Risk Investment Warning
Trading Forex/CFDs on margin carries a high level of risk and may not be suitable for all investors. Leverage can work against you.
Stratos Markets Limited (tradu.com):
CFDs are complex instruments and come with a high risk of losing money rapidly due to leverage. 63% of retail investor accounts lose money when trading CFDs with this provider. You should consider whether you understand how CFDs work and whether you can afford to take the high risk of losing your money.
Stratos Europe Ltd (tradu.com):
CFDs are complex instruments and come with a high risk of losing money rapidly due to leverage. 63% of retail investor accounts lose money when trading CFDs with this provider. You should consider whether you understand how CFDs work and whether you can afford to take the high risk of losing your money.
Stratos Global LLC (tradu.com):
Losses can exceed deposits.
Please be advised that the information presented on TradingView is provided to Tradu (‘Company’, ‘we’) by a third-party provider (‘TFA Global Pte Ltd’). Please be reminded that you are solely responsible for the trading decisions on your account. There is a very high degree of risk involved in trading. Any information and/or content is intended entirely for research, educational and informational purposes only and does not constitute investment or consultation advice or investment strategy. The information is not tailored to the investment needs of any specific person and therefore does not involve a consideration of any of the investment objectives, financial situation or needs of any viewer that may receive it. Kindly also note that past performance is not a reliable indicator of future results. Actual results may differ materially from those anticipated in forward-looking or past performance statements. We assume no liability as to the accuracy or completeness of any of the information and/or content provided herein and the Company cannot be held responsible for any omission, mistake nor for any loss or damage including without limitation to any loss of profit which may arise from reliance on any information supplied by TFA Global Pte Ltd.
The speaker(s) is neither an employee, agent nor representative of Tradu and is therefore acting independently. The opinions given are their own, constitute general market commentary, and do not constitute the opinion or advice of Tradu or any form of personal or investment advice. Tradu neither endorses nor guarantees offerings of third-party speakers, nor is Tradu responsible for the content, veracity or opinions of third-party speakers, presenters or participants.

ETHEREUM (ETHUSD): Retest of $3000 Soon!Ethereum has successfully violated and closed above a significant daily horizontal resistance level.
The bullish momentum appears to be ongoing, and the price is likely to soon test the psychological level of $3000 mark.
Following this test, a breakout is expected, potentially driving prices to new heights.

ETHEREUM, the big catch-up has finally begun!Introduction: In our previous TradingView analyses, we defended the bullish recovery of the crypto market since the beginning of April, particularly for the bitcoin price. The latter seems to be positively correlated with the global liquidity trend (you can reread all our latest crypto analyses in our analysis history directly from the main page of our TradingView profile).
In this new analysis, we discuss the return of Ethereum's outperformance of Bitcoin.
1) ETH/USD bullish cycle: what are the theoretical price targets highlighted by technical analysis of the financial markets?
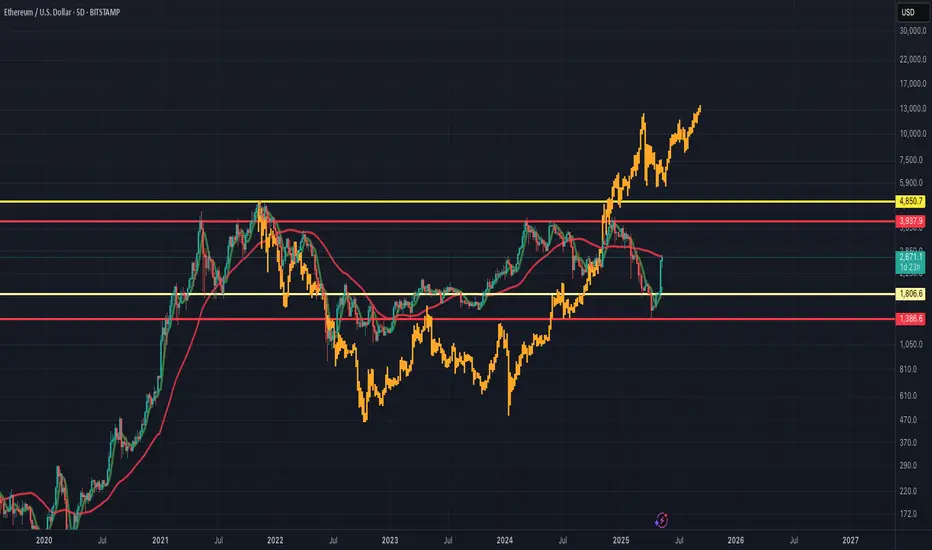
The current bullish cycle for ETH/USD began in the summer of 2022, with prices rebounding from the all-time high of the penultimate cycle, which peaked at $1150 in January 2018. A chartist base for a bullish reversal had developed between July and November 2022, before the uptrend began shortly after the FTX bankruptcy.
A well-constructed uptrend then took place until March 2024, with an intermediate high reached at $4,000, a resistance that three times produced a bearish rejection effect. The ETH/USD rate finally rallied back above major support at $1150/1350 and now appears to have resumed a bullish bottom trajectory in alignment with the bitcoin price.
2) Ethereum VS Bitcoin, the great catch-up may have begun
The question investors are now asking is whether or not Ethereum is in a position to outperform bitcoin in the coming weeks. To answer this question, we need to look at both fundamental and technical aspects.
On the fundamental level, the very recent “Pectra” update considerably improves the functioning of the Ethereum blockchain, notably by reducing transaction costs. This update could be the fundamental element underpinning a return to Ethereum's outperformance of Bitcoin.
In terms of technical analysis, it is the ETH/BTC ratio that helps determine Ethereum's cycles of outperformance and underperformance against Bitcoin. Technical analysis of the ETH/BTC ratio highlights the presence of long-term chart support, which seems to have enabled a clear rebound in the ETH/BTC rate.
Consequently, if this major support remains preserved over the coming weeks, then yes, it's becoming increasingly likely that ETH/USD will do better than BTC/USD over the next few weeks on the crypto-currency market. This market view would be invalidated in the event of a breakout of the major support mentioned and which is represented on the chart below.
DISCLAIMER:
This content is intended for individuals who are familiar with financial markets and instruments and is for information purposes only. The presented idea (including market commentary, market data and observations) is not a work product of any research department of Swissquote or its affiliates. This material is intended to highlight market action and does not constitute investment, legal or tax advice. If you are a retail investor or lack experience in trading complex financial products, it is advisable to seek professional advice from licensed advisor before making any financial decisions.
This content is not intended to manipulate the market or encourage any specific financial behavior.
Swissquote makes no representation or warranty as to the quality, completeness, accuracy, comprehensiveness or non-infringement of such content. The views expressed are those of the consultant and are provided for educational purposes only. Any information provided relating to a product or market should not be construed as recommending an investment strategy or transaction. Past performance is not a guarantee of future results.
Swissquote and its employees and representatives shall in no event be held liable for any damages or losses arising directly or indirectly from decisions made on the basis of this content.
The use of any third-party brands or trademarks is for information only and does not imply endorsement by Swissquote, or that the trademark owner has authorised Swissquote to promote its products or services.
Swissquote is the marketing brand for the activities of Swissquote Bank Ltd (Switzerland) regulated by FINMA, Swissquote Capital Markets Limited regulated by CySEC (Cyprus), Swissquote Bank Europe SA (Luxembourg) regulated by the CSSF, Swissquote Ltd (UK) regulated by the FCA, Swissquote Financial Services (Malta) Ltd regulated by the Malta Financial Services Authority, Swissquote MEA Ltd. (UAE) regulated by the Dubai Financial Services Authority, Swissquote Pte Ltd (Singapore) regulated by the Monetary Authority of Singapore, Swissquote Asia Limited (Hong Kong) licensed by the Hong Kong Securities and Futures Commission (SFC) and Swissquote South Africa (Pty) Ltd supervised by the FSCA.
Products and services of Swissquote are only intended for those permitted to receive them under local law.
All investments carry a degree of risk. The risk of loss in trading or holding financial instruments can be substantial. The value of financial instruments, including but not limited to stocks, bonds, cryptocurrencies, and other assets, can fluctuate both upwards and downwards. There is a significant risk of financial loss when buying, selling, holding, staking, or investing in these instruments. SQBE makes no recommendations regarding any specific investment, transaction, or the use of any particular investment strategy.
CFDs are complex instruments and come with a high risk of losing money rapidly due to leverage. The vast majority of retail client accounts suffer capital losses when trading in CFDs. You should consider whether you understand how CFDs work and whether you can afford to take the high risk of losing your money.
Digital Assets are unregulated in most countries and consumer protection rules may not apply. As highly volatile speculative investments, Digital Assets are not suitable for investors without a high-risk tolerance. Make sure you understand each Digital Asset before you trade.
Cryptocurrencies are not considered legal tender in some jurisdictions and are subject to regulatory uncertainties.
The use of Internet-based systems can involve high risks, including, but not limited to, fraud, cyber-attacks, network and communication failures, as well as identity theft and phishing attacks related to crypto-assets.

EthusdtThis move from the lows has been incredibly strong
Probably test the highs in coming months..
Successful pectra upgrade
Might see aths

ETHWonder will Eth catch back up to the last cycle.Getting tricky here at this point sure after this FED meeting we will see a clear picture of price action.
ETH Testing Red Resistance – Breakout Potential!🚀 CRYPTOCAP:ETH Testing Red Resistance – Breakout Potential! 📈
CRYPTOCAP:ETH is currently testing the red resistance zone. If the price breaks through, the first target could be the green line level! 📊
Let’s watch this breakout unfold! 💼💸
