ETHUSD | Breakout Watch Above $3,040Ethereum has surged above the critical $2,530 resistance zone and is now challenging $3,040, a key structure level. A daily close above this could open the path toward $3,537 and even $4,056 in the mid-term.
Support at: 2,530 / 2,100 / 1,830 🔽
Resistance at: 3,537.93 / 4,056.40 🔼
🔎 Bias:
🔼 Bullish: Holding above 2,530 confirms breakout structure; a clean break above 3,040 targets higher zones.
🔽 Bearish: Failure to stay above 3,040 may invite a retest of 2,530.
📛 Disclaimer: This is not financial advice. Trade at your own risk.
ETHUSD trade ideas

Ethereum Weekly Recap & Gameplan | 27.07.2025📈 Market Context:
ETH followed the broader crypto market momentum led by Bitcoin, supported by institutional demand and positive macro policies in the U.S.
Last week’s plan played out cleanly — we saw strong gains from the 1H demand zone.
🧾 Weekly Recap:
• Price swept 4H swing liquidity and formed a 1H bullish BOS
• Created a solid 1H demand zone, from which price bounced strongly
• Momentum remained bullish as forecasted in last week’s post
📌 Technical Outlook:
→ Expecting a short retracement into 4H liquidity levels around 3761$ or 3702$
→ Then a continuation move towards ATH zone
🎯 Setup Trigger:
What I’m watching:
✅ Sweep of 4H liquidity
✅ Bullish BOS on 15M–30M
→ This will serve as the confirmation for long entries
📋 Trade Management:
• Stoploss: Below the confirmation swing low
• Target: 4100$
💬 If you found this helpful, don’t forget to like, comment, and follow — I share setups like this every week!

#ETH/USDT SETUP ,Bought From $4003#ETH
The price is moving within an ascending channel on the 1-hour frame, adhering well to it, and is on track to break it strongly upwards and retest it.
We have support from the lower boundary of the ascending channel, at 3700.
We have a downtrend on the RSI indicator that is about to break and retest, supporting the upside.
There is a major support area in green at 3711, which represents a strong basis for the upside.
Don't forget a simple thing: ease and capital.
When you reach the first target, save some money and then change your stop-loss order to an entry order.
For inquiries, please leave a comment.
We have a trend to hold above the 100 Moving Average.
Entry price: 3811.
First target: 3867.
Second target: 3936.
Third target: 4003.
Don't forget a simple thing: ease and capital.
When you reach your first target, save some money and then change your stop-loss order to an entry order.
For inquiries, please leave a comment.
Thank you.

#ETH/USDT SETUP ,Bought From $3696#ETH
The price is moving within a descending channel on the 1-hour frame, adhering well to it, and is on its way to breaking strongly upwards and retesting it.
We have support from the lower boundary of the descending channel at 3640.
We have a downtrend on the RSI indicator that is about to be broken and retested, supporting the upside.
There is a major support area in green at 3600, which represents a strong basis for the upside.
Don't forget a simple thing: ease and capital.
When you reach the first target, save some money and then change your stop-loss order to an entry order.
For inquiries, please leave a comment.
We have a trend to hold above the Moving Average 100.
Entry price: 3696.
First target: 3764.
Second target: 3826.
Third target: 3904.
Don't forget a simple thing: ease and capital.
When you reach your first target, save some money and then change your stop-loss order to an entry order.
For inquiries, please leave a comment.
Thank you.

ETHEREUM (ETHUSD): Bullish Move After BreakoutIt looks like Ethereum has completed its bearish correctional movement.
Analyzing the price movement on a 4H timeframe, the market formed an inverted head and shoulders pattern on a retest of a horizontal support.
The neckline of this pattern is broken, which suggests a strong likelihood of a bullish trend resuming, with the price expected to reach the psychological level of 4000 soon.

ETH/USD – Macro Wave Map to $10,000? ETH/USD – Macro Wave Map to $10,000? 🚀🔥
Ethereum has broken out of its prolonged corrective structure, moving decisively above the equilibrium zone (~$3,500) and signaling the start of a potential macro impulsive wave (Elliott Wave 3 of 5).
Key Observations (Weekly Chart)
Wave Structure: The corrective (W)-(X)-(Y)-(Z) phase is complete, with ETH now forming the early stages of a wave (3) targeting $8,500–$9,000.
Equilibrium Flip: Price reclaimed the premium zone (~$3,500), indicating smart money accumulation.
Macro Target: If wave (3) plays out fully, wave (5) could extend toward $10,000+ by 2026.
Volume Spike: Sustained institutional demand confirms the bullish pivot.
Levels to Watch
Support (Re-entry Zone): $3,200 – $3,500 (previous resistance, now strong support) 🛡️
Primary Targets: $5,000 – $6,800 (wave 3 mid-range) 🎯
Extended Targets: $8,500 – $10,000 (wave 5 completion) 🏆
VolanX Macro Signal
Bias: Bullish as long as ETH stays above $3,200.
Risk Marker: A drop below $2,900 (200-week EMA) would invalidate this impulsive scenario.
Accumulation Strategy: DCA between $3,200 – $3,600 targeting $5,000+ in 2026.
VolanX View:
Ethereum’s current structure is primed for a multi-year expansion cycle, with smart money targeting untouched liquidity above $5K and potentially $10K. The roadmap remains bullish as long as we hold the reclaimed base zones.

ETH | USDHello! This is my bearish scenario for ETH. If we get a weekly or monthly candle close below the red lines above, I’ll be expecting a downward phase toward the 1930 levels within 1–2 months. However, if we can close July above 3725, then my bullish outlook will remain intact.
CRYPTO:ETHUSD BINANCE:ETHUSDT BINANCE:ETHUSDT.P CRYPTOCAP:ETH.D BINANCE:ETHBTC CRYPTOCAP:ETH INDEX:ETHUSD BINANCE:ETHUSDT

ETHUSD : Good luck :-)A lot of people get carried away easily.
It is ALWAYS a MISTAKE to buy at the TOP. You have already missed the boat.
Trade with common sense, not with emotion.
Good luck.

ETH Breakout and potential bullishness expected for a monthETH has broken out from downtrend and market sentiment has turned bullish overall. So it is expected to go up until it reaches 4000$ (70%) where a long term resistance is found.
Any further bullishness post 4000$ depends on future market conditions and price action at that point of time, as it is a long term resistance which would be more difficult to break.
Fibonacci retracement is used to find potential temporary selloffs in this up move. This move could potentially end the medium term bearish sentiments in ALT Coins.
Note: For educational purposes only. DYOR before investing or trading.

YOU ARE NOT BULLISH ENOUGH ON ETHEREUM! ethereum linear chart 3m timeframe major resistance level breakout occurred. if it continues to maintain the current area in the coming period, the major will continue to rise

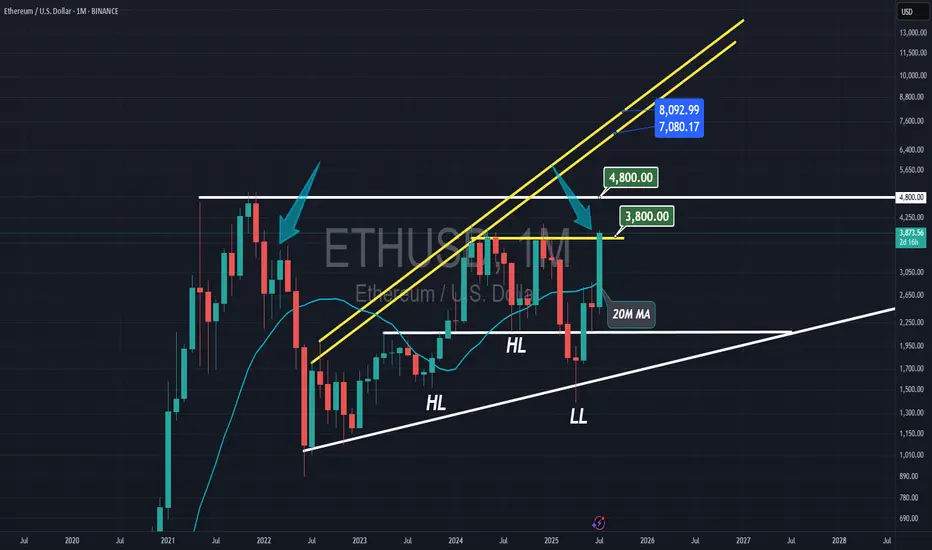
Ethereum the HIGHEST MONTHLY CANDLEEthereum is closing its highest monthly candle since 2021, signaling very bullish months ahead, with $8,000 as the resistance.
Ethereum Long: Using Log Chart to Analyze, Target $6600In this video, I go through the analysis using the log chart for Ethereum and shows the potential of this cryptocurrency where I expect the price to reach new high in the coming days with a longer-term target of $6600.
For shorter-term trading, I recommend placing the stop a distance below recent support on the daily chart, around $3372.
Good luck!

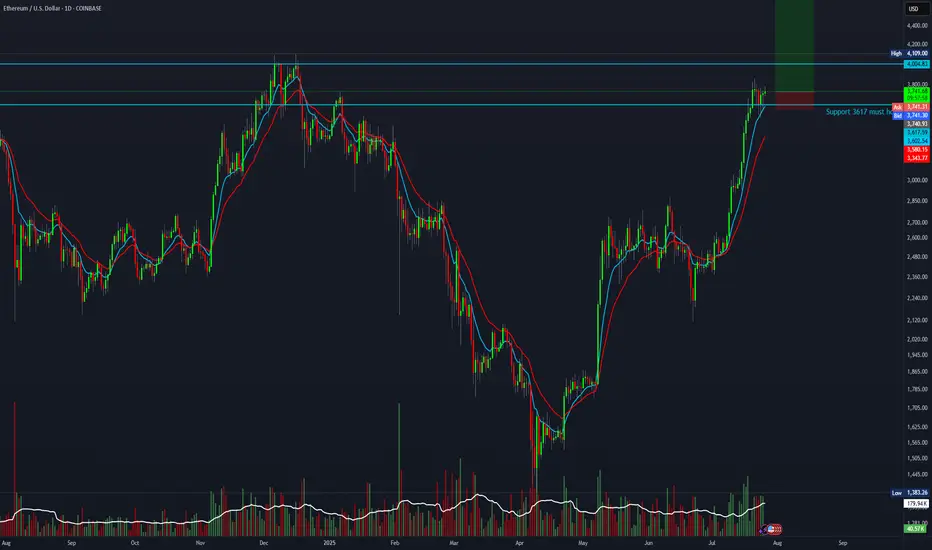
ETHUSD Will Go Down From Resistance! Sell!
Here is our detailed technical review for ETHUSD.
Time Frame: 1D
Current Trend: Bearish
Sentiment: Overbought (based on 7-period RSI)
Forecast: Bearish
The market is testing a major horizontal structure 3,641.87.
Taking into consideration the structure & trend analysis, I believe that the market will reach 2,871.15 level soon.
P.S
Overbought describes a period of time where there has been a significant and consistent upward move in price over a period of time without much pullback.
Disclosure: I am part of Trade Nation's Influencer program and receive a monthly fee for using their TradingView charts in my analysis.
Like and subscribe and comment my ideas if you enjoy them!

Ethereum Price Eyes $5K as Frenzy Fuels Supply ShockEthereum's Ascent: A Perfect Storm of Institutional Frenzy, Dwindling Supply, and Shifting Market Dominance
A palpable sense of anticipation is building in the cryptocurrency market, and its focal point is increasingly not on the reigning king, Bitcoin, but on its heir apparent, Ethereum. A confluence of powerful forces—ranging from bullish proclamations by Wall Street titans and an unprecedented institutional buying spree to compelling on-chain metrics and a shifting market structure—is painting a picture of a potential paradigm shift. The world's second-largest cryptocurrency is not just rallying; it appears to be on the precipice of a significant breakout, with some analysts eyeing targets that would shatter its previous all-time highs. This is not merely a story of price appreciation but a narrative of a "quiet takeover," where Ethereum's fundamental strengths and evolving role in the digital asset economy are finally being recognized by the world's largest financial players.
The chorus of bullish voices has grown louder in recent months, led by influential figures like billionaire investor and Galaxy Digital CEO, Mike Novogratz. A long-time crypto proponent, Novogratz has become increasingly vocal about his conviction that Ethereum is poised to outperform Bitcoin in the near future. He has repeatedly stated that Ethereum has a "really powerful narrative" and that market conditions are aligning for a significant upward move. Novogratz's thesis is built on a simple yet potent economic principle: a demand shock colliding with an already constrained supply. He predicts that Ethereum could outperform Bitcoin in the next three to six months, a bold statement given Bitcoin's own impressive performance.
The catalyst for this potential outperformance, according to Novogratz, is the flood of institutional capital now targeting Ethereum. This isn't just speculative interest; it's a strategic shift by major companies to hold ETH as a treasury reserve asset. This trend, he argues, is creating a supply crunch that will inevitably drive prices higher. The billionaire has identified the $4,000 mark as a critical psychological and technical level. In his view, a decisive break above this price point would launch Ethereum into a phase of "price discovery," where past resistance levels become irrelevant and the asset's value is determined by the sheer force of market demand. Novogratz believes Ethereum is "destined" to repeatedly challenge this $4,000 ceiling, suggesting that a breakout is a matter of when, not if.
This bullish sentiment from one of crypto's most respected voices is not occurring in a vacuum. It is underpinned by a dramatic and sustained price rally that has seen Ethereum's value surge by an astonishing 75% since late June. This powerful uptrend is not fueled by retail FOMO alone; rather, it is the result of a verifiable and accelerating wave of institutional adoption.
The primary engine behind this rally has been the launch and subsequent success of spot Ethereum Exchange-Traded Funds (ETFs). These regulated financial products have opened the floodgates for institutional investors to gain exposure to ETH without the complexities of direct custody. The inflows have been nothing short of staggering. In one remarkable instance on July 25th, Ethereum ETFs registered a net inflow of $452.8 million in a single day, with BlackRock's ETHA fund accounting for the lion's share at $440.1 million. This figure represents a dramatic escalation from the sub-$100 million daily inflows seen in early July, indicating a multifold jump in institutional buying pressure. In a single week, these ETFs absorbed a massive $2.18 billion, showcasing the voracious appetite of big money for a piece of the Ethereum network.
The impact of these ETF inflows is being magnified by a phenomenon known as a "supply shock." Analysts have noted that in a three-week period, ETFs purchased an amount of ETH equivalent to what the network would issue over 18 months. This aggressive absorption of the available supply from the open market, at a time when supply is already constrained due to staking and other factors, creates a powerful upward pressure on price.
The institutional frenzy is not limited to passive ETF investments. A new and significant trend has emerged: the rise of the "Ethereum treasury company." Mirroring the strategy pioneered by MicroStrategy with Bitcoin, corporations are now beginning to add substantial amounts of ETH to their balance sheets, viewing it as a strategic asset and a yield-bearing investment through staking.
Leading this charge is SharpLink Gaming, an online technology company that has made headlines with its aggressive accumulation of Ether. The company recently purchased an additional 77,210 ETH, worth approximately $295 million, in a single transaction. This purchase alone was more than the total net issuance of new Ether over the preceding 30 days. Following this acquisition, SharpLink's total holdings soared to over 438,000 ETH, valued at more than $1.69 billion. This makes SharpLink one of the largest corporate holders of Ethereum, second only to Bitmine Immersion Tech.
SharpLink's strategy is clear and ambitious. The company has filed to increase its stock sale from $1 billion to $6 billion, with the majority of the proceeds earmarked for further ETH purchases. The appointment of Joseph Chalom, a 20-year veteran of the world's largest asset manager, BlackRock, as its new co-CEO, lends further institutional credibility to its crypto-centric strategy. The company has also been vocal about its belief in the Ethereum network, with a recent social media post declaring, "Banks close on weekends. Ethereum runs 24/7." This sentiment captures the essence of why institutions are drawn to the programmable, always-on nature of the Ethereum blockchain.
Other companies, such as BitMine Immersion Technologies and the upcoming Ether Machine, which plans to list on Nasdaq, are also amassing significant ETH treasuries. BitMine has reported holdings of over 566,000 ETH, worth more than $2 billion. Collectively, these corporate players are creating a significant and sustained source of demand, locking up large portions of the circulating supply. This corporate buying spree is a powerful vote of confidence in Ethereum's long-term value proposition, extending far beyond its utility as a digital currency.
The torrent of institutional capital and corporate accumulation is vividly reflected in Ethereum's on-chain data. The network is buzzing with activity, providing a transparent window into the scale of the current buying pressure. One of the most telling metrics has been the explosion in on-chain volume. Over a recent three-week period, on-chain ETH volume surged by an incredible 288%, reaching a staggering $10.38 billion. This indicates a deep and liquid market with robust participation.
Even more compelling is the activity of large holders, colloquially known as "whales." Analysis of blockchain data reveals a sharp increase in the number of "mega whale" addresses—those holding 10,000 ETH or more. Since early July, over 170 new mega whale addresses have appeared on the network. This trend strongly suggests that the massive inflows from ETFs are not just being held by custodians but are being translated into direct, long-term accumulation by large, well-capitalized entities. These are typically "strong hands" that are less likely to sell in response to short-term market fluctuations, providing a stable base of support for the price.
Furthermore, the weekly volume of large transactions, defined as those exceeding $100,000, has hit its highest level since the peak of the 2021 bull run, totaling more than $100 billion in a single week. This explosion in whale activity, coinciding with Ethereum's price breakout into the high $3,000s, confirms that "smart money" is actively and aggressively positioning itself in the market. This is not the speculative froth of a retail-driven rally but the calculated maneuvering of institutional players.
Adding another layer to Ethereum's bullish case is a significant shift in the broader cryptocurrency market landscape: the steady decline of Bitcoin's dominance. Bitcoin dominance, which measures BTC's market capitalization as a percentage of the total crypto market cap, has been trending downwards. This indicates that capital is beginning to flow out of Bitcoin and into alternative cryptocurrencies, or "altcoins," with Ethereum being the primary beneficiary.
This phenomenon, often referred to as a "quiet takeover," signals growing confidence in Ethereum's relative strength. While Bitcoin has already set new all-time highs in the current cycle, Ethereum has yet to surpass its 2021 peak, suggesting it has more room to run. Analysts note that as Bitcoin's momentum has somewhat stalled, investors seeking higher returns are rotating into Ethereum, which offers a compelling combination of a strong narrative, institutional adoption, and significant upside potential.
The outperformance is stark when looking at recent returns. In the last 30 days, while Bitcoin posted respectable gains of around 11%, Ethereum surged by over 61%. This divergence is a classic sign of a market beginning to favor altcoins, a period often dubbed "altcoin season." Ethereum, as the leader of the altcoin pack, typically paves the way for broader rallies across the ecosystem. A rising Ethereum price and declining Bitcoin dominance create a fertile ground for other altcoins to flourish, with some analysts predicting double-digit returns for many smaller projects if Ethereum can successfully break the $4,000 barrier.
From a technical perspective, Ethereum's price chart is flashing multiple bullish signals, suggesting that the recent rally could be the start of a much larger move. Analysts are closely watching several key formations that have been developing over a long period. One of the most significant is a massive consolidation pattern. After a prolonged period of trading within a range, a breakout from such a pattern often leads to a powerful and sustained trend. Some analysts believe a breakout is imminent, with initial price targets set between $4,800 and $5,000.
Even more compelling is the challenge to a 3.7-year descending trendline. This long-term resistance has capped Ethereum's upward movements for years. A decisive weekly close above this trendline would be a major technical victory for the bulls, invalidating the long-term bearish structure and opening the door for a parabolic advance. Technical analysts often view the breach of such a long-standing trendline as a powerful signal of a major trend reversal and the beginning of a new bull market phase.
Should Ethereum successfully break out of its current consolidation and clear the $4,000 to $4,200 resistance zone, chart analysis suggests there is very little historical resistance until the $4,800 to $5,000 range. Some of the more bullish forecasts, looking at the ETH/BTC trading pair and other long-term models, even project potential targets between $7,300 and $10,000 in this market cycle.
Despite the overwhelmingly bullish picture, the path to new all-time highs is unlikely to be a straight line. The $4,000 level has proven to be a formidable barrier. Recently, Ethereum's price was firmly rejected near this psychological milestone, leading to a period of cooling volatility and raising concerns about a potential short-term selloff. The failure to break through has caused some buying pressure to weaken, and on-chain data has shown a temporary decrease in large whale transactions following the rejection.
This price action highlights the classic tug-of-war between buyers and sellers at a key resistance level. Some traders who have enjoyed the 75% run-up may be tempted to take profits, creating selling pressure. The Relative Strength Index (RSI), a momentum indicator, has also shown signs of being "overheated," suggesting that a period of consolidation or a minor correction could be healthy and necessary before the next leg up.
However, a key positive sign is that despite the rejection, buyers have not given up much ground. The price has continued to consolidate just below the resistance area, indicating that dips are being bought and that underlying demand remains strong. This type of price action, where an asset persistently hovers near a major resistance level without a significant pullback, is often a precursor to an eventual breakout.
Crucially, while retail sentiment and short-term trading metrics might show some hesitation, the institutional tide shows no sign of ebbing. Spot ETF inflows have remained consistently positive, providing a steady stream of buying pressure that counteracts short-term selling. This suggests that while there may be some turbulence in the immediate future, the larger, more powerful trend is being driven by long-term institutional accumulators who are less concerned with short-term price swings.
In conclusion, Ethereum finds itself at a historic crossroads, propelled by a perfect storm of fundamental and technical tailwinds. The narrative is no longer just about its technological promise as a world computer but about its emergence as a mature, institutional-grade asset. The vocal support of financial titans like Mike Novogratz, the verifiable flood of institutional capital through ETFs, and the strategic shift by corporations to hold ETH in their treasuries are creating a demand shock of unprecedented scale.
This is being met with a supply that is increasingly constrained, thanks to staking and the aggressive accumulation by these new, large players. On-chain data confirms this story, with volumes and whale activity reaching levels not seen since the last bull market peak. As Bitcoin's dominance wanes, Ethereum is stepping into the spotlight, ready to lead the next phase of the market cycle.
While the $4,000 resistance remains a key hurdle to overcome, and short-term volatility is to be expected, the underlying forces at play suggest a powerful current pulling Ethereum towards new horizons. The "quiet takeover" is becoming louder by the day. A breakout above $4,000 could unleash a wave of price discovery, potentially pushing Ethereum to $5,000 and beyond, and in the process, reshaping the very landscape of the digital asset ecosystem. The stage is set for Ethereum's ascent, and the world is watching.


20:1 R:R setup for Ethereum.The train is about to leave the station if BTC breaks above 120K. This setup offers a favorable risk for a 20:1 R:R.
Entry: 3,750
Stop-loss: 3,580
Target: 7,000
ETH SELL SETUP ,Sold From 3853ETH SELL SETUP
Currently $3853
Sold From 3853
(Trading plan ETH go up to $3920
will add more shorts)
Expecting target $3780 OR DOWN
In the event of an early exit,
this analysis will be updated.
Its not a Financial advice

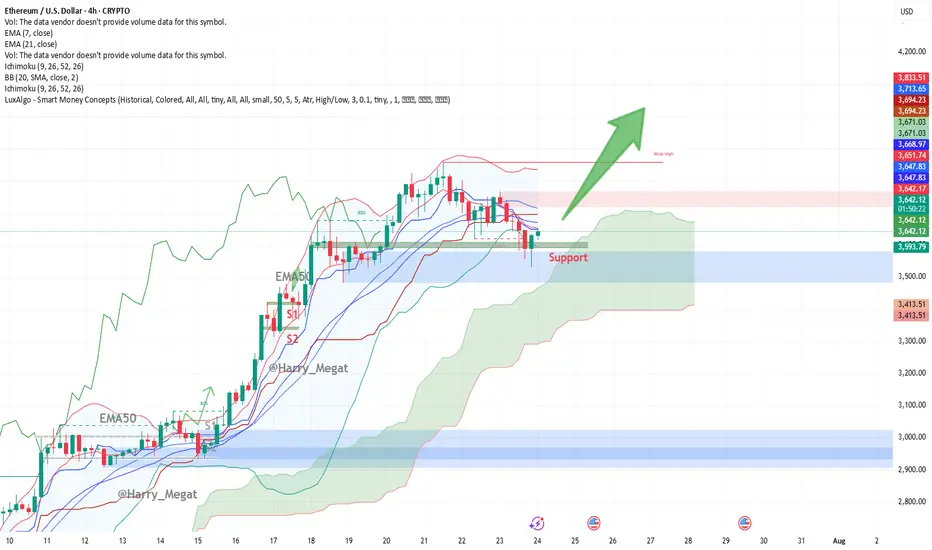
Ethereum (ETH/USD) 4-hour chart Technical AnalysisThis Ethereum (ETH/USD) 4-hour chart presents a **bullish setup**. Let’s break it down:
**Chart Overview:**
* **Price at the time of chart:** \~\$3,650
* **Support Zone:** \~\$3,615–3,630 (highlighted in green box)
* **Indicators:**
* **EMA 7 (Red):** \~\$3,653.87
* **EMA 21 (Blue):** \~\$3,669.75
* **Bullish Signal:** Large upward green arrow suggests expectation of a breakout rally from current support.
**Technical Analysis:**
**1. Bullish Bounce at Support**
* ETH tested the **horizontal support zone** multiple times, showing strong demand.
* The recent candle shows a **wick rejection** from the support zone — indicating buyer strength.
**2. Moving Averages**
* Price is trying to reclaim above the **EMA7**, with EMA21 nearby (\~\$3,670).
* A **bullish crossover** or strong candle close above both EMAs could confirm upside continuation.
**3. Structure**
* Previous resistance (\~\$3,615) has turned into **new support** — a classic bullish flip.
* The large green arrow projects a **potential breakout move**, targeting higher highs possibly above **\$3,750+**, then **\$3,900+**.
**Trade Setup Idea:**
| Type | Entry | Stop Loss | Take Profit 1 | Take Profit 2 |
| Long | \$3,655–3,660 | Below \$3,600 | \$3,750 | \$3,900+ |
**Watch Out For:**
* Rejection near EMA21 (\$3,670)
* False breakout if volume is weak
* Macro risk or sudden BTC movement dragging ETH
**Conclusion:**
The chart signals a **bullish bias** if ETH maintains above the support zone and reclaims both EMAs. A clean break above \~\$3,670–3,700 could spark further upside toward \$3,900+.
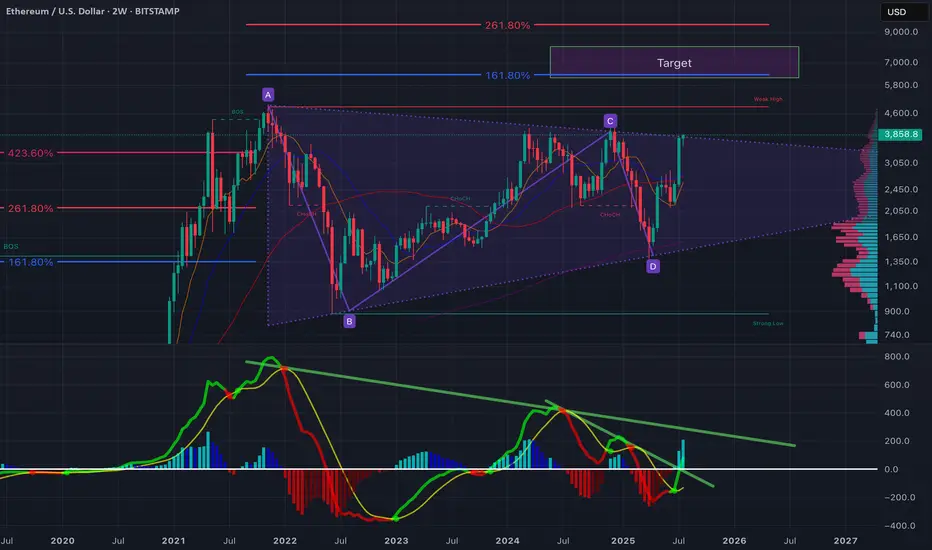
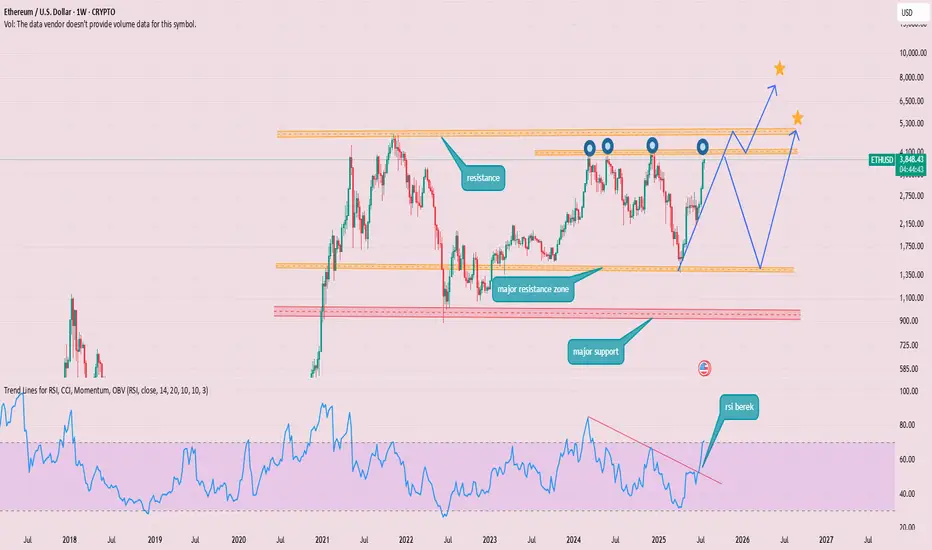
$ETH - Nothing has changedEthereum is showing a significant breakout setup after years of consolidation within a large symmetrical wedge structure (A–B–C–D pattern). The price has just tested the upper boundary of the wedge, and momentum indicators suggest a potential mid-term bullish continuation.
Key Observations:
ABCD Harmonic Structure: Price has respected the harmonic range with D forming a strong higher low near $1,500–$1,600, showing buyer absorption at key demand levels.
Fibonacci Confluence:
The 161.8% extension aligns with ~$5,800, forming the first major target.
A 261.8% extension pushes towards ~$7,000, aligning with the marked "Target" zone.
Volume Profile: Heavy accumulation between $1,500–$2,500 with low resistance above $4,000 suggests a breakout could accelerate quickly.
MACD/RSI Divergence: The momentum oscillator shows a triple bullish divergence (higher lows on momentum vs. lower lows on price), and the downtrend line on the MACD histogram has been broken—often a precursor to sustained upside.
Moving Averages: The 50/100 EMA crossover on the 2-week chart is imminent, historically a strong macro signal.
Bullish Scenario:
A clear close above $4,000 confirms wedge breakout.
Short-term targets: $4,600 (weak high) and $5,800 (Fib 161.8%).
Macro target: $7,000+ if bullish momentum holds through Q4.
Bearish Risk:
Failure to hold $3,500 could lead to retests of $2,500 or even $2,000 (mid-wedge support).
Watch for macroeconomic shocks (rate cuts, liquidity shifts) which have previously caused retracements in crypto markets.
What’s next?
ETH is approaching a make-or-break moment. If the breakout holds, this could be the start of the next major leg up. A strong weekly close above $4,000–$4,200 is critical for validation.
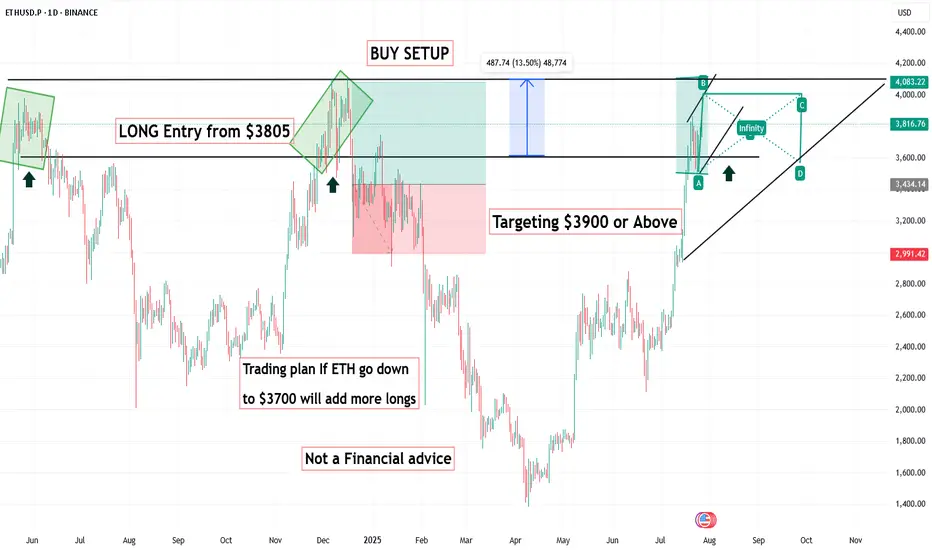
ETH BUY SETUP ,Bought From $3805ETH BUY SETUP
Currently $3805
Bought From $3805
(Trading plan If ETH go down
to $3700 will add more longs)
Expecting target $3900 OR ABOVE
In the event of an early exit,
this analysis will be updated.
Its not a Financial advice
ETH ANALYSIS💲💲 #ETH is trading between support and resistance area. There is a potential rejection again from its resistance zone and pullback from support zone. If #ETH breaks the major resistance zone then we would see a bullish move
ETHUSD: Strong Bullish Sentiment! Long!
My dear friends,
Today we will analyse ETHUSD together☺️
The recent price action suggests a shift in mid-term momentum. A break above the current local range around 3,826.1 will confirm the new direction upwards with the target being the next key level of 3,883.6 and a reconvened placement of a stop-loss beyond the range.
❤️Sending you lots of Love and Hugs❤️

ETHUSDBroke above H4 resistance and retested multiple times. Also broke above minor H1 resistance with a retest. Looking at 4,000 as main target
