ETH to $3700 Before a Major Bounce?Ethereum has been showing signs of exhaustion after its recent rally. I'm watching the $3700 level closely — it's a key support zone that has acted as both resistance and support in the past.
🟦 If ETH pulls back to this area, I expect it to find strong buying interest, potentially leading to a significant bounce and continuation of the bullish trend.
📌 Scenario I'm Watching:
🔻 Pullback to the $3700 support zone
📉 Shakeout or stop hunt below previous lows
💚 Followed by a strong bullish reversal — possible move toward $4000+
Why $3700?
Confluence of previous highs/lows
Psychological round number
Potential liquidity pocket
Not Financial Advice!
This is a scenario I'm tracking, not a guarantee. As always, wait for confirmation (e.g. bullish engulfing, RSI divergence, volume spike) before jumping in.
📉 If $3700 fails decisively, I'll reassess — next support likely around $3550–3600.
ETHUSD trade ideas

DaxPrime: BlackRock Exec Move Signals SharpLink’s $1.3B ETH ShifIn a development that is drawing attention across both institutional finance and the crypto ecosystem, a senior executive from BlackRock’s digital assets division has transitioned to SharpLink Gaming — a rising Ethereum whale and sports betting infrastructure player now managing over $1.3 billion in ETH-based assets. At DaxPrime, we see this move not as an isolated career shift but as a strategic signal of deepening convergence between traditional asset management and Web3-native businesses.
The Move: From Wall Street to Web3 Execution
According to sources familiar with the matter, BlackRock’s former Head of Digital Asset Strategy, Daniel Wexler, is joining SharpLink Gaming as its Chief Digital Officer. Wexler played a critical role in shaping BlackRock's crypto ETF initiatives and oversaw early-stage partnerships with Ethereum ecosystem projects.
His transition comes at a time when SharpLink — originally focused on B2B sports betting technologies — has evolved into a key player in decentralized infrastructure, integrating smart contracts, Layer-2 analytics, and tokenized in-game markets. The company currently holds over $1.3 billion in Ethereum, making it one of the largest corporate ETH holders in the entertainment-tech sector.
DaxPrime’s View: Strategic Talent Realignment
At DaxPrime, we interpret this as more than just a personnel update. It reflects a broader realignment where institutional talent is gravitating toward firms that offer speed, flexibility, and a native role in the decentralized economy.
“The move illustrates a trend we’ve tracked since early 2024: legacy finance professionals are increasingly pivoting toward operational roles in Web3-native companies, particularly those with real assets and strong ETH exposure,” says Michaela Strobel, Senior Analyst at DaxPrime.
SharpLink’s use of Ethereum spans beyond treasury holdings. The firm is building proprietary smart contract infrastructure for real-time sports data feeds, NFT-linked fantasy games, and decentralized betting protocols — signaling a broader use-case than speculative ETH storage.
Ethereum as a Strategic Asset
Wexler’s decision also underscores Ethereum’s growing importance as a corporate strategic asset, not merely an investment vehicle. Ethereum’s programmable layer and widespread developer adoption make it the backbone of emerging digital business models — including SharpLink’s.
DaxPrime’s July 2025 ETH Treasury Index reveals that more than 18 publicly listed firms now hold over $500 million in Ethereum each, compared to just five a year ago. This uptick is particularly concentrated in sectors like digital media, AI-gaming convergence, and decentralized finance tooling.
“Ethereum’s shift from an investment to infrastructure asset is well underway,” Strobel notes. “Wexler’s move brings boardroom-grade credibility to a company operating deep within that transformation.”
What It Means for Investors
For investors, this move signals two critical developments:
Institutional Validation of Web3 Business Models: Wexler’s transition lends credence to firms building around Ethereum-based infrastructure, rather than just speculating on token prices.
New Pathways for ETH Utility: SharpLink’s planned integration of ETH staking, yield strategies, and decentralized oracles into its sports gaming vertical could set new standards for how consumer-facing platforms leverage blockchain.
DaxPrime’s Conclusion
The decision by a senior BlackRock executive to join an Ethereum-native company like SharpLink Gaming is not a one-off anomaly. It reflects a rapidly maturing industry where the center of gravity is shifting from financial speculation to operational integration.
At DaxPrime, we continue to monitor executive movements as a leading indicator of sector confidence and capital rotation. As Ethereum evolves from “store of value” to “platform for value,” such strategic appointments signal where the smart money is going — and what the next phase of crypto utility will look like.
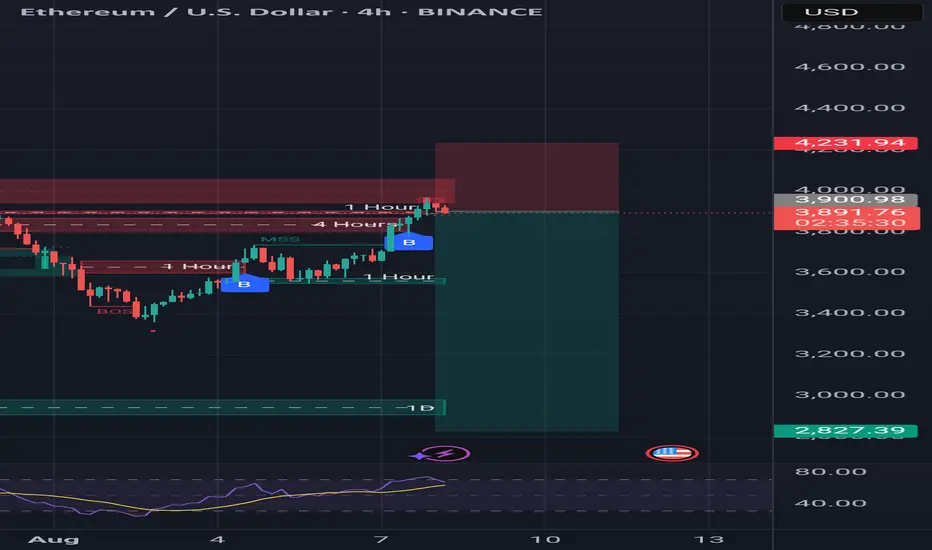
shortly bearish closed my trade at ~3750.
healthy retracement and 3 key levels for me to watch out. Next hours maybe a few days bearish, in my opinion a high chance to reach this targets.
Overall still bullish. Also watch out my post on ETH/BTC.


Possibility of further upside for Ethereum"There is a possibility that the green zone gets broken, followed by a pullback, and then the uptrend may resume toward the orange zone. The orange zone is significant and will likely determine the continuation of Ethereum’s trend. Keep in mind that this analysis is based on the daily timeframe. We still need confirmation before entering a position."
Looking for trading signals? Join our Telegram channel today!
t.me/zibayicrypto

Ethereum is too high and overbought? Eth should crash below $3k for the bearish August and September month's. We are topped out and already liquidated enough people so now a down trend should start.
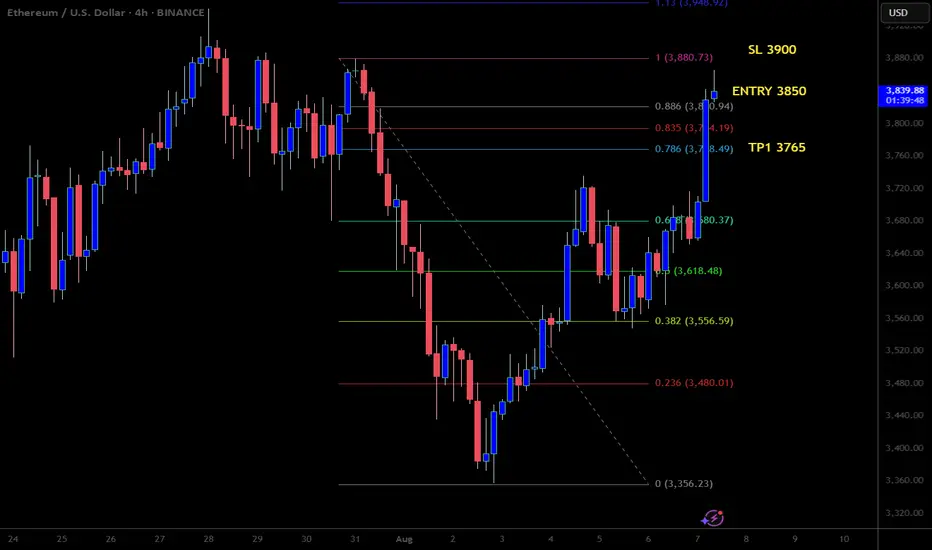
ETH Charging at $4K
ETH on the 4H
And just like that, ETH is knocking on the $4K door again. This move is absolutely beautiful.
After losing the 0.236 Fib last week and bouncing from the 0.5, ETH made another attempt earlier this week — got rejected — then broke above 0.236 like it was nothing.
Now, price is retesting yesterday’s close (black dotted line), which aligns with last week’s highs and is acting as short-term support. It’s gathering strength for the next push at $4K.
All signals align:
• MLR > SMA > BB Center
• PSAR flipped bullish
• RSI is cooling off
• MACD is fully bullish
Structure remains strong. Momentum is building.
ETH-related bullish news and stablecoin narratives are flooding the timeline.
I’ve started scaling back in and am watching how price reacts to the $4K resistance.
This part takes patience and focus — I’ll keep updating this idea as it evolves.
Always take profits and manage risk.
Interaction is welcome.

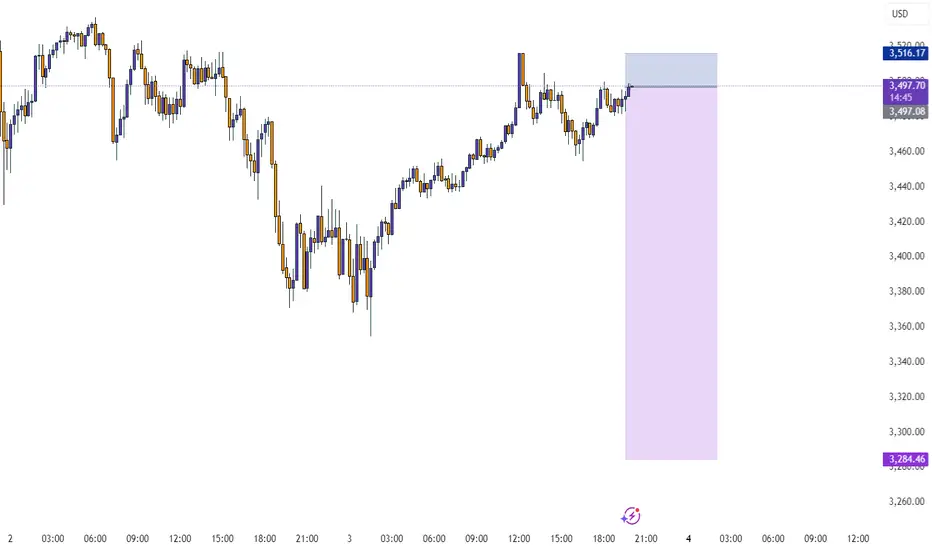
ETHUSD scalp sellLooking for a quick sell here. This also give us added confirmation on our previous eth sell swing trade from the previous analysis on the weekly timeframe.
ETHUSD Market Structure and TrendMarket Structure and Trend
ETH has risen from around $2900 to around $3800 in July, breaking the important $4000 resistance level that has previously failed to be broken three times in 2024
ETH is trading in a tight price range of $3650–$3704, with the price above the EMA(25) ($3460), confirming the medium-term bullish trend
Indicators and Signals
EMA(7): $3739 — price below → short-term weakness signal; but above EMA(25) and EMA(99) (~$2832) → trend remains bullish
Stochastic RSI (6): ~1.6 — oversold level, signaling a possible rebound
RSI (according to TipRanks): around 76.7 — overbought, partially limits growth
ADX (14-day) on Barchart: around 17–23 — weak trend and consolidation
Support and resistance levels
Support:
$3616 — 3650 zone (lower boundary of the range and EMA(25)),
then $3460 (EMA25) and then $3460–$3300 if broken below
Resistance:
$3739 (EMA7),
above $3800,
key level $4000 — psychological and technical barrier,
further — historical maximum around $4800
Possible scenarios
Bulls
If the price holds above $3650 and stochastic RSI bounces up — growth to $3739 → $3780–$3800 is expected.
Breakthrough and holding above $3800 will open the way to $4000–$4100, and potentially higher, up to $4800+ if the market turns in favor of ETH
Bears
Consolidation below $3616 → possible movement to $3460 and lower to $3300+ with increased selling and weak volume
RSI above 70 may foreshadow a correction in the absence of further momentum.

ETH - next 10 days longHello traders :) My technical analysis according to market sentiment.
~~~ 4000 USD for ETH is crucial to cross and stay above
(ratio for this price is 0.035 BTC/ETH and BTC 115 000k ~~~
BTC.D -> going down 61.66% (we touch PoC 65% and now going slowly down, we need to go down below 60% for real altcoin season )
BTC/ETH is going up (currently we reached PoC - 0.032, targets 0.05-0.08),
USDT.D -> going down (PoC - 4.25 %, should be arround 2.2% when we peak bull market - can be extended to 2026)
BTC.D
ETHUSD
USDT.D
ETHBTC
If ratio for BTC/ETH is arround 0.05 and BTC has value 135000 USD , then ETH can reach 6800USD which is very reasonable price to reach.
BTC goes sideways 110k-118k , ETH need to go up and cross main resistance 4000 USD.
We can continue bull market for next 2-4 months.
Write me if you want what do you think about this progress ?
Best regards
Norbert


ETH: Ready to ride a powerful long-term wave from the bottomETH: Ready to ride a powerful long-term wave from the bottom
.
A necessary backtesting phase — to take profits, to rest, to strengthen the trend, to assess supply and demand, and to accumulate more positions in preparation for a long-term move... So, is a correction a risk or an opportunity?
.
US STOCKS- WALL STREET DREAM- LET'S THE MARKET SPEAK!

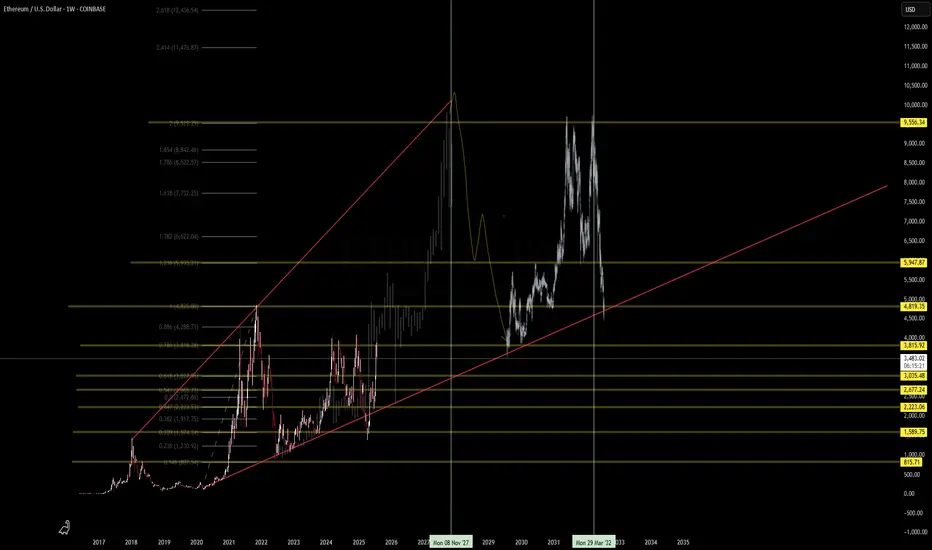
ETH: VOLANX Pattern Projector Predicts 10K by 2030. It's 2025!Notes:
Multi-Timeframe Liquidity Reaction Framework
Define Your Timeframes
Higher-TF (Daily / 4-hour)
Map major liquidity zones (daily highs/lows, order-block clusters).
Note structural breaks and fair-value gaps around $3,200–$3,300 and $3,800–$4,000 (Murphy, 1999).
Mid-TF (1-hour)
Observe zone tests: wick‐rejections, two‐bar reversals, volume spikes.
Tag each test as “acceptance” (close within zone) or “rejection” (long wick through zone) (Bulkowski, 2008).
Lower-TF (15-/5-minute)
Fine-tune entries: look for micro-order-blocks, VWAP pullbacks, or oscillators divergences immediately post-test.
Set Up Your Research Template
Zone (TF) Date/Time Price Level Test Type Volume %Δ Next Move (pips / %) Notes
Daily Highs (D) 2025-08-03 07:00 $3,800 Rejection +45% +2.5% ↑ Bearish wick test
Order Block (4H) 2025-08-02 16:00 $3,250 Acceptance +30% +1.8% ↑ Smooth retest
… … … … … … …
Measure & Analyze
Wick Length vs. Zone Width: Wick ≥ 50% zone width → higher-prob rejection.
Volume Delta: Spike > 30% above 20-period average → institutional activity.
Post-Test Trend: Record 1-bar, 3-bar, and 6-bar returns after zone interaction.
Iterate & Refine
Review which zones yield reliable continuations versus false breaks.
Adjust zone boundaries (expand/contract by ATR) based on statistical edge.
Incorporate into your DSS for automated alerts when high-prob setups appear.
“By systematically logging zone interactions and subsequent moves, you’ll quantify which liquidity tests offer the best risk-reward and tune your entries for optimal efficiency.”
References
Bulkowski, T. N. (2008). Encyclopedia of candlestick charts. John Wiley & Sons.
Murphy, J. J. (1999). Technical analysis of the financial markets. New York Institute of Finance.
ETH/USD: Legacy coin. Let's see what we get in the hrly, I plan to study the move and make my decision.

ETH/USD: Now I will architect a strat to run my HFT. Macro Thesis
BTC & ETH “side by side” since 2017–18; both stalled in a multi-year base
Renewed institutional inflows & Fed policy divergence set the stage for a parabolic squeeze
If BTC can trade toward $100 K as a store-of-value, ETH has clear path to $50 K
Technical Setup
Key Resistance: Descending trendline at $3,800–4,000
Confluence Support: $3,200–3,300 (0.618 Fib + rising trendline)
Momentum: Daily close above $3,800 triggers acceleration
Trade Plan
Entry: Break & retest above $3,800
Targets:
T1: $5,000 (round number + regression line)
T2: $10,000 (psychological) ⇨ ultimate stretch T3: $50,000
Stop-Loss: $3,100 (below 0.618 Fib zone)
Risk Management: 1% per trade; adjust with DSS signals
Note: ETH is a new asset class for me; DSS will filter optimal entries and sizing. Always watch macro drivers before committing.
#Ethereum #CryptoMacro #TradingView #SmartMoneyConcepts #VolanX #DSS

Sequence Analysis on ETH/USD, WE could break out !Sequence Analysis on ETH/USD
Primary Impulse (June 2022–Nov 2023)
Wave 1: Bottom ≈ $989 → top ≈ $2,688
Wave 2: Retrace to ≈ $1,492 (≈ 61.8% Fib of Wave 1)
Wave 3: Advance to ≈ $3,550 (strongest, longest wave)
Wave 4: Pullback to ≈ $2,300 (above Wave 1 high—validates impulse)
Wave 5: Extension to ≈ $5,080 (completes 5-wave structure)
Complex Correction (Dec 2023–June 2025)
W–X–Y Double Zigzag
W: Down from $5,080 → $2,678
X: Relief rally to $3,800
Y: Final decline to $1,155 (below Wave 4 low)
Rule check: Y-wave breaches Wave 4 territory, confirming an expanded correction (Prechter & Frost, 2005).
Current New Impulse (June 2025–ongoing)
Wave (1): Low ≈ $1,155 → $2,400
Wave (2): Shallow retrace to $2,271 (≈ 38.2% Fib)
Wave (3): Strong leg to $3,800+ (exceeds Wave 1 by ratio ≈ 1.61)
Wave (4): Correction to $3,300 (above Wave 1 high, valid)
Wave (5) (projected): Expected to drive above $5,800, targeting regression-line confluence
Key Rules & Ratios
Wave 3 cannot be shortest (here, it is longest)
Wave 4 must not overlap Wave 1 territory (confirmed)
Fibonacci alignments at 38.2–61.8% retracements guide entry zones (Prechter & Frost, 2005)
References
Prechter, R. R., & Frost, A. J. (2005). Elliott wave principle: Key to market behavior (10th ed.). New Classics Library.
Sources

ETH/USD: We in? Not yet!Macro
FOMC held rates at 4.25–4.50% for the fifth consecutive meeting, stressing a data-dependent stance amid mixed economic signals (Reuters, 2025a).
White House to publish a pro-crypto policy report, signaling potential regulatory clarity and institutional inflows ahead (Reuters, 2025b).
Ether has doubled over the past three months and gained 4.5% in the last week, reflecting strong momentum and market breadth (Reuters, 2025c).
Risk Management
Stop-loss: Below key support at 3,237 (0.618 Fib + trendline confluence).
Position sizing: Risk ≤ 1% of account equity per trade.
Risk/Reward:
Target 1: 4,372 (1.236 Fib) → RR ≈ 1.5
Target 2: 5,080 (regression line projection) → RR ≈ 2.5
Trade Setup
Entry: On a daily close above the ascending trendline near 3,400–3,500 with bullish confirmation (e.g., hammer or engulfing candle).
Targets:
Partial profit at 4,372 (1.236 Fib)
Full exit at 5,080 (regression line)
Stop-loss: 3,200–3,230 zone (below 0.618 Fib).
Sentiment Filter: “Here or no trade” — only engage if price respects confluence support.

Potential 4H Head and shouldersA potential h&s could be shaping, the daily trend is down but the weekly chart is looking for support.

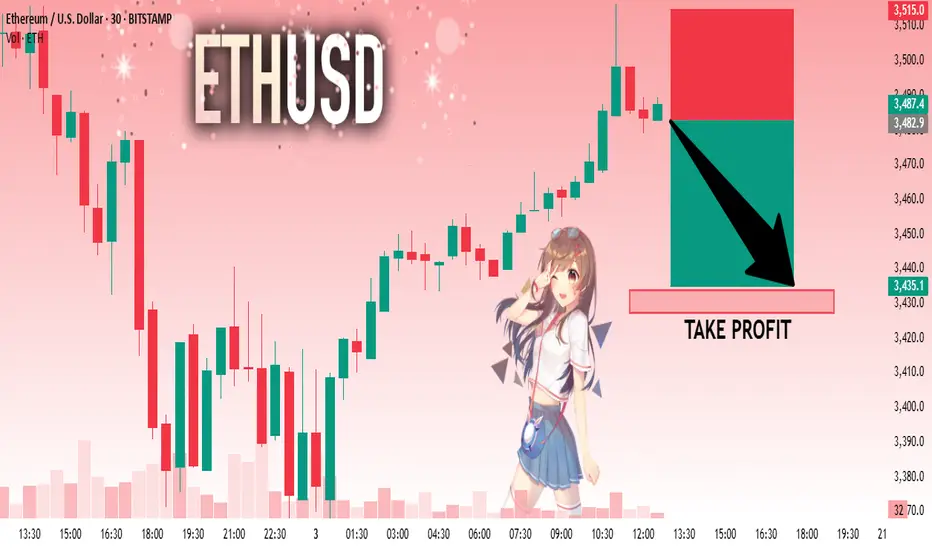
ETHUSD: Absolute Price Collapse Ahead! Short!
My dear friends,
Today we will analyse ETHUSD together☺️
The price is near a wide key level
and the pair is approaching a significant decision level of 3,482.9 Therefore, a strong bearish reaction here could determine the next move down.We will watch for a confirmation candle, and then target the next key level of 3,433.9..Recommend Stop-loss is beyond the current level.
❤️Sending you lots of Love and Hugs❤️
Using my PAR indicator for swings Using my PAR indicator for swings - Watching multiple time frames squeeze together to get the best trades.

Seven topics explaining why Ethereum might be heading towards atSeven topics explaining why Ethereum might be heading towards at least $4,500 after returning to its trend:
1. Market Sentiment and Bullish Reversal
When Ethereum breaks out of a consolidation phase or a downtrend, it often signals a shift in market psychology. A bullish reversal can be triggered by technical patterns such as ascending triangles, breakouts above key resistance levels, or bullish candlestick formations. Positive news (e.g., regulatory clarity, major partnerships, or favorable market reports) enhances investor confidence. Once traders recognize a trend reversal, it leads to increased buying momentum, further propelling ETH higher. This shift in sentiment often acts as a self-fulfilling prophecy, attracting more capital into the asset.
2. Institutional Adoption and Investment
Institutional investors, including hedge funds, asset managers, and pension funds, play a crucial role in cryptocurrency price dynamics. Large-scale investments, ETFs, or custodial solutions designed for institutional clients can generate significant buy pressure. Notable endorsements from major financial firms or integration of Ethereum-based products into mainstream financial platforms can serve as a validation, encouraging broader participation. This institutional involvement often brings stability and confidence, supporting sustained upward movement towards higher targets like $4,500.
3. DeFi and NFT Growth
Ethereum's ecosystem is the backbone of the decentralized finance (DeFi) sector and NFTs. The expanding adoption of DeFi applications (lending, borrowing, staking) and booming NFT markets increase demand for ETH, since it is essential for transaction fees and smart contract execution. As new projects and use cases emerge, the utility of ETH grows, directly impacting its value. Additionally, mainstream adoption of DeFi and NFTs draws more retail and institutional investors into the ecosystem, contributing to price appreciation.
4. Network Developments
Ethereum continues to undergo significant upgrades to address scalability, security, and sustainability. Ethereum 2.0, with features like proof-of-stake (PoS) consensus, shard chains, and Layer 2 scaling solutions (like Rollups), greatly enhance network efficiency. These upgrades improve user experience and reduce transaction costs, making Ethereum more attractive for developers and users. The improving technology infrastructure can result in increased transaction volume, user activity, and investor confidence, which collectively drive the price upward.
5. Macro and Cryptocurrency Market Factors
Broader macroeconomic conditions influence Ethereum’s price. A declining dollar, inflation concerns, or global economic uncertainty can push investors toward alternative assets like cryptocurrencies. Bitcoin’s market movement often correlates with ETH, and a bullish Bitcoin trend can lift ETH prices as well. Additionally, positive regulatory developments or a general rally in the crypto market can create a favorable environment, supporting Ethereum’s ascent to higher levels.
6. Technical Indicators
Traders rely heavily on technical analysis. Breakouts above significant resistance levels (e.g., previous highs around $3,500 or $4,000), increased trading volume, and bullish chart patterns such as flags or bullish divergence reinforce the upward trend. These technical signals attract momentum traders and institutional players, which accelerate the price increase. Consistent bullish technicals contribute to a self-sustaining upward trajectory toward the $4,500 target.
7. Supply Dynamics
Ethereum's supply mechanics significantly influence its price. The implementation of EIP-1559 introduced a fee-burning mechanism that reduces circulating supply over time, creating a deflationary pressure. When network activity is high, more ETH is burned, decreasing supply and potentially increasing scarcity. Furthermore, the transition to Ethereum 2.0's proof-of-stake reduces issuance, limiting new ETH supply entering the market. These supply-side dynamics, combined with growing demand, can lead to significant appreciation, moving ETH toward and beyond the $4,500 level.

ETH to + $4,5007 topics explaining why Ethereum might be heading towards at least $4,500 after returning to its trend:
1. Market Sentiment and Bullish Reversal
When Ethereum breaks out of a consolidation phase or a downtrend, it often signals a shift in market psychology. A bullish reversal can be triggered by technical patterns such as ascending triangles, breakouts above key resistance levels, or bullish candlestick formations. Positive news (e.g., regulatory clarity, major partnerships, or favorable market reports) enhances investor confidence. Once traders recognize a trend reversal, it leads to increased buying momentum, further propelling ETH higher. This shift in sentiment often acts as a self-fulfilling prophecy, attracting more capital into the asset.
2. Institutional Adoption and Investment
Institutional investors, including hedge funds, asset managers, and pension funds, play a crucial role in cryptocurrency price dynamics. Large-scale investments, ETFs, or custodial solutions designed for institutional clients can generate significant buy pressure. Notable endorsements from major financial firms or integration of Ethereum-based products into mainstream financial platforms can serve as a validation, encouraging broader participation. This institutional involvement often brings stability and confidence, supporting sustained upward movement towards higher targets like $4,500.
3. DeFi and NFT Growth
Ethereum's ecosystem is the backbone of the decentralized finance (DeFi) sector and NFTs. The expanding adoption of DeFi applications (lending, borrowing, staking) and booming NFT markets increase demand for ETH, since it is essential for transaction fees and smart contract execution. As new projects and use cases emerge, the utility of ETH grows, directly impacting its value. Additionally, mainstream adoption of DeFi and NFTs draws more retail and institutional investors into the ecosystem, contributing to price appreciation.
4. Network Developments
Ethereum continues to undergo significant upgrades to address scalability, security, and sustainability. Ethereum 2.0, with features like proof-of-stake (PoS) consensus, shard chains, and Layer 2 scaling solutions (like Rollups), greatly enhance network efficiency. These upgrades improve user experience and reduce transaction costs, making Ethereum more attractive for developers and users. The improving technology infrastructure can result in increased transaction volume, user activity, and investor confidence, which collectively drive the price upward.
5. Macro and Cryptocurrency Market Factors
Broader macroeconomic conditions influence Ethereum’s price. A declining dollar, inflation concerns, or global economic uncertainty can push investors toward alternative assets like cryptocurrencies. Bitcoin’s market movement often correlates with ETH, and a bullish Bitcoin trend can lift ETH prices as well. Additionally, positive regulatory developments or a general rally in the crypto market can create a favorable environment, supporting Ethereum’s ascent to higher levels.
6. Technical Indicators
Traders rely heavily on technical analysis. Breakouts above significant resistance levels (e.g., previous highs around $3,500 or $4,000), increased trading volume, and bullish chart patterns such as flags or bullish divergence reinforce the upward trend. These technical signals attract momentum traders and institutional players, which accelerate the price increase. Consistent bullish technicals contribute to a self-sustaining upward trajectory toward the $4,500 target.
7. Supply Dynamics
Ethereum's supply mechanics significantly influence its price. The implementation of EIP-1559 introduced a fee-burning mechanism that reduces circulating supply over time, creating a deflationary pressure. When network activity is high, more ETH is burned, decreasing supply and potentially increasing scarcity. Furthermore, the transition to Ethereum 2.0's proof-of-stake reduces issuance, limiting new ETH supply entering the market. These supply-side dynamics, combined with growing demand, can lead to significant appreciation, moving ETH toward and beyond the $4,500 level.
