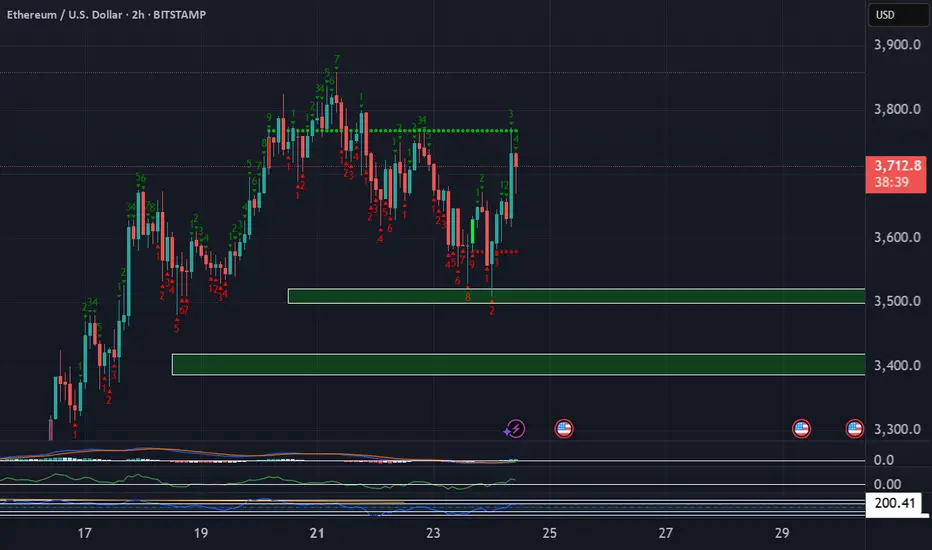
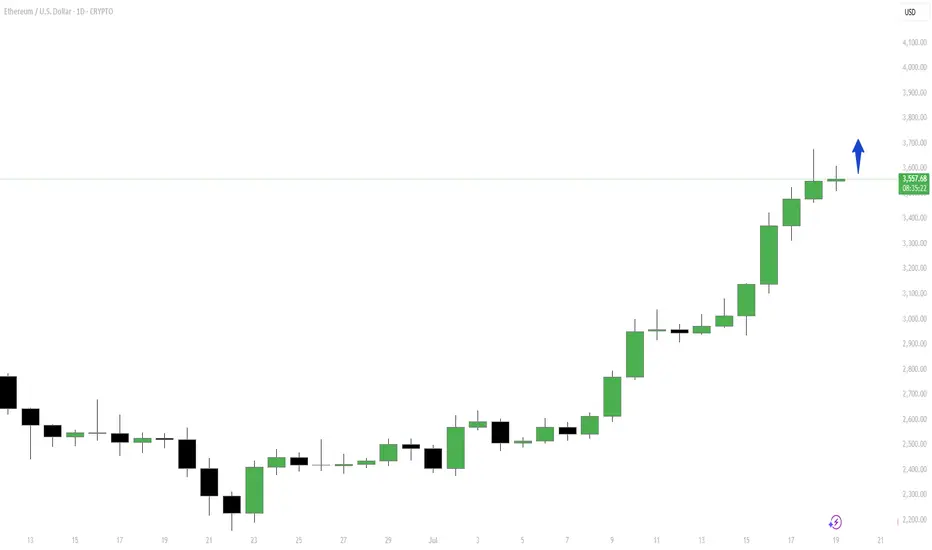
Ethereum heading towards $4000Ethereum heading towards $4000
Resistance lines across $4150 and $4200.
Due the growth of bitcoin we think ethereum could be next.
Based on the growing interest of defi.
Could also be a catalyst for mid and small cap altcoins.
Rsi = avg bullish
Stoch Rsi = avg bullish
Macd = avg bullish
ETHUSD trade ideas

ETH/USDT – Daily Chart | Bearish Harmonic Setup (Butterfly Patte@ Eth/USDT Daily time frame A potential Bearish Butterfly harmonic pattern is unfolding on the daily timeframe. Price is currently approaching the D point completion zone, projecting a reversal area near 4896.
📌 Trade Setup:
Buy Limit: 3450
Stop Loss: 2870
TP1: 3894
TP2: 4896
RSI is approaching overbought levels (currently 79.57), suggesting caution as price nears the harmonic resistance zone. If price completes the pattern near TP2, traders can watch for a potential bearish reversal opportunity.
Pattern aligns with historical RSI divergences and prior structure. Monitor price action closely as we approach the D point.

ETHUSDETH USD Conditional trade// High risk
Possible Head and shoulder in making
Wait for neck to break
Look for retest and bearish candle
then enter otherwise invalid

HAPPY BIRTHDAY Ethereum! Now let's go Looks like the move is about to happen right now. Target 10K !
ETH - 4444 - 5000 + Hello Traders,
Using Fibs, Elliot Waves, Trend Regression Channels, and an Inverse H&S Patterns I show some possible ETH price targets and dates. Lets see how this plays out

ETHUSDTAre the sellers willing
The buyers are exhausted 😕
Seeing how sluggish they've become
Price head back to the point they once sold off from.
Will the sellers dominate or there are going to be another drama
Eyes on short

EthusdIt looks bearish.I think we would see another bearish impluse wave, after breaking (d) of a 🔺️ triangle.
If price goes up and passes (c) , the pattern is then canceled.

Inverse head & shoulderPossibility by today or early hours GMT, this inverse head & shoulder can play play out, hitting the $4k mark.
Also a possibility is a correction after hitting potentially what is ATH, at which point a correction will come before ETH moves above the ATH towards the end of year bull run, 25/26.

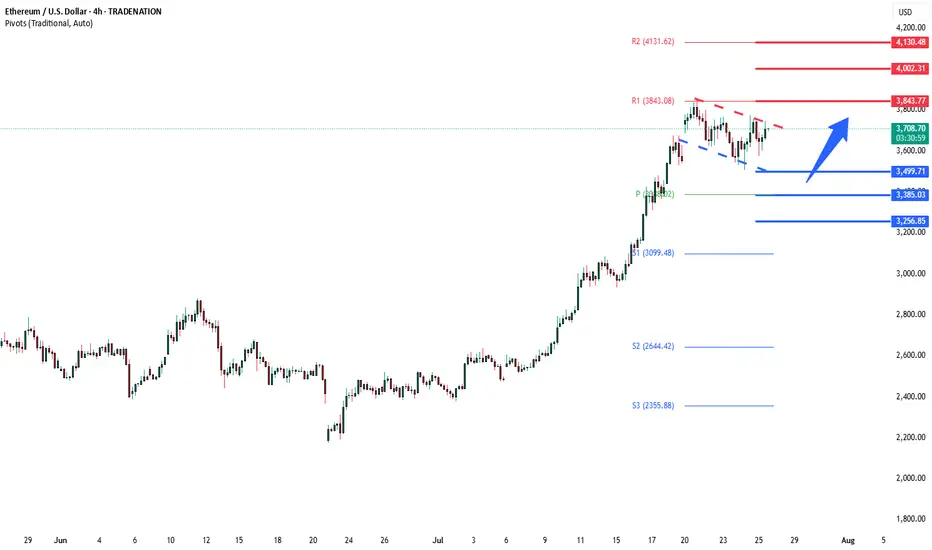
ETHUSD support at 3500The ETHUSD remains in a bullish trend, with recent price action showing signs of a corrective pullback within the broader uptrend.
Support Zone: 3500 – a key level from previous consolidation. Price is currently testing or approaching this level.
A bullish rebound from 3500 would confirm ongoing upside momentum, with potential targets at:
3842 – initial resistance
4000 – psychological and structural level
4130 – extended resistance on the longer-term chart
Bearish Scenario:
A confirmed break and daily close below 3500 would weaken the bullish outlook and suggest deeper downside risk toward:
3385 – minor support
3256 – stronger support and potential demand zone
Outlook:
Bullish bias remains intact while the ETHUSD holds above 3500. A sustained break below this level could shift momentum to the downside in the short term.
This communication is for informational purposes only and should not be viewed as any form of recommendation as to a particular course of action or as investment advice. It is not intended as an offer or solicitation for the purchase or sale of any financial instrument or as an official confirmation of any transaction. Opinions, estimates and assumptions expressed herein are made as of the date of this communication and are subject to change without notice. This communication has been prepared based upon information, including market prices, data and other information, believed to be reliable; however, Trade Nation does not warrant its completeness or accuracy. All market prices and market data contained in or attached to this communication are indicative and subject to change without notice.
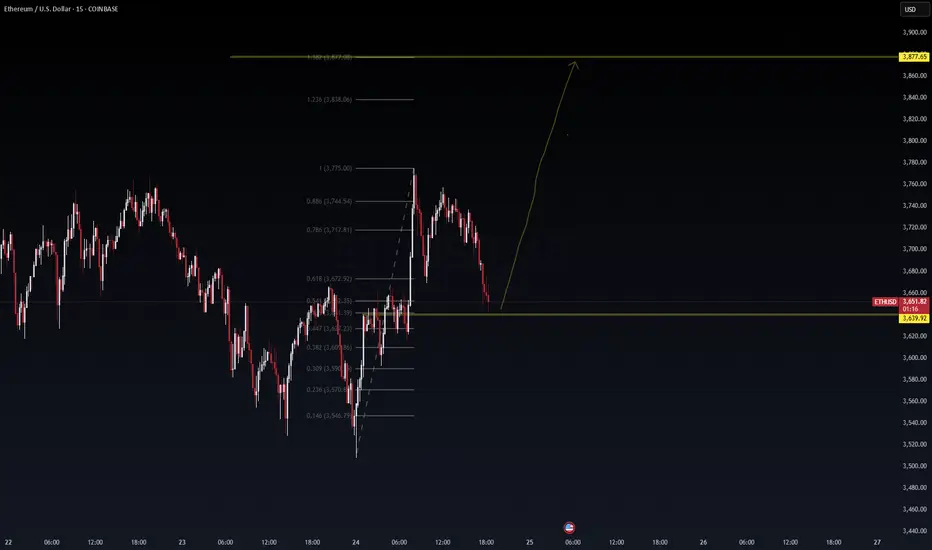
ETHUSD: Road to 4K today after a breakout. ETH/USD – 4H Outlook: Targeting $4,000+
Ethereum is coiling within a descending wedge, signaling potential breakout momentum. Volume compression indicates that once ETH breaks above the wedge resistance (~$3,750), it could accelerate toward the $4,000–$4,050 supply zone.
Key Levels:
Resistance: $3,750 → $4,000
Support: $3,650 → $3,550
Breakout Target: $4,007 (mid-term)
VolanX Protocol Insight:
Institutional liquidity clusters sit above $3,800. A clean breakout with strong volume could trigger stop runs and a swift rally to 4K.
Risk Management:
Entry after breakout retest above $3,750.
Stop-loss: Below $3,640.
Take-profit: $3,980–$4,050.

ETHUSD Inverse Head Shoulder 4hrRather self explinatory . Potential Inverse Head & Shoulder 4hr and 1hr . Target approx. 4,014 USD

ETH on the 1H
After rejecting the 0.236 Fib level, price found support at the 200MA.
RSI cooled off slightly, giving room for another move before hitting overbought.
MACD just flipped bullish, pushing price higher.
MLR > SMA > BB Center — structure confirms upward momentum.
Now price is back at the Fib level.
It looks fresher than yesterday, but needs clean closes above to build traction for a real breakout.
We’ll be here watching.
Always take profits and manage risk.
Interaction is welcome.

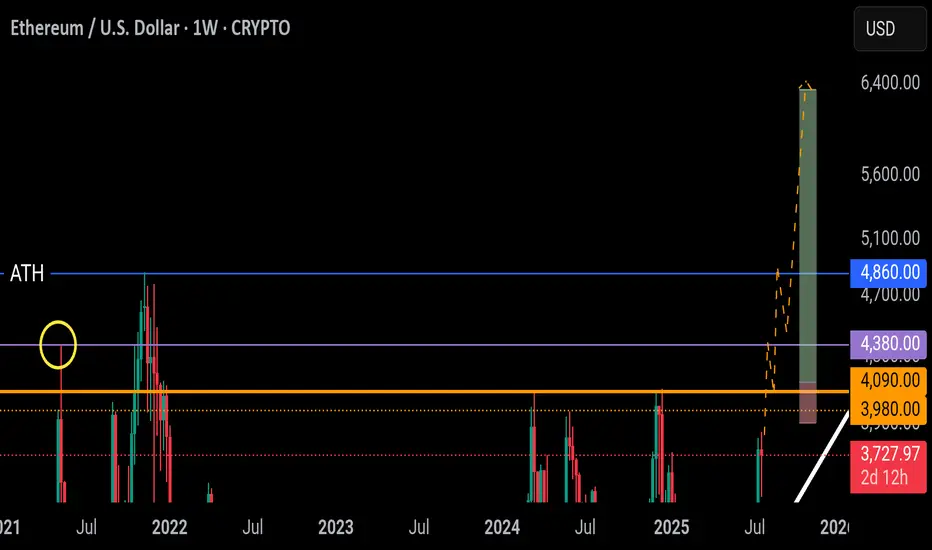
ETH key levels / fligh pathResistance zone @ 4,000 - 4,100
If Ethereum is able to break above this level the next price level likely to slow momentum / see a rejection is @ 4,400. A rejection from this price point could present a good long entry at the same Resistance zone @ 4k (flipping into support).
The ATH is likely to briefly act as resistance - saw a similar pattern with XRP/SOL/BNB/BTC - price does not naturally just "bust through" first time. Rejection/consolidation likely followed by a continued move into price/discovery.
Anticipate a new ATH to be printed toward the back end of Q4 📈
Strategy Idea: “React, Don’t Predict” ETH at Decision ZoneHey Traders, Ethereum recently made a strong move up to around $3,600. Now it’s slowing down, and we’re at a key decision point. Two things can happen from here:
Option 1 – Pullback:
If the price drops, watch the $3,200–$3,300 zone. That area could act as support. If a strong bullish candle forms there (on the daily or 4H chart), it could be a good buying opportunity.
Option 2 – Breakout:
If ETH stays above $3,550 and breaks the recent high with strong momentum, price could move toward $3,800 or even $4,000. Only buy if the breakout is clear and strong.
Basic Plan for New Traders:
Wait for confirmation before entering
Don’t buy the top
Use stop loss to manage risk
Only risk what you can afford to lose
Be patient. No setup = no trade
Reminder:
We don’t predict, we react. Let the chart show the move, then decide. Stay safe and stick to your plan.
Don't forget to follow me, boost this content, and comment if you like this strategy idea or have any questions.
-Neo
Ethereum gains momentum: SEC green light and Banks ShiftEthereum gains momentum: SEC green light and JPMorgan’s historic shift
By Ion Jauregui – Analyst at ActivTrades
Ethereum once again takes center stage in financial markets after a week full of positive signals: on one hand, the long-awaited clarification of its regulatory status by the SEC; on the other, the unexpected opening of JPMorgan to cryptocurrencies. All this in a context of growing institutional interest and corporate adoption.
Washington clears the path: ETH is a commodity
The chairman of the SEC, Paul Atkins, has resolved one of the biggest uncertainties in the crypto ecosystem: Ethereum will not be treated as a security, but as a commodity. In other words, it falls outside the scope of the SEC’s strictest regulations and is placed on the same level as bitcoin from a regulatory standpoint. This shift, which ends years of ambiguity, comes just as Ethereum spot ETFs begin to gain traction. On July 16 alone, these products recorded a net inflow of $726 million, reflecting strong demand from large investors. By way of explanation:
Security: A financial instrument representing a share in a company or a credit, such as a stock or bond. It is subject to financial market regulation (such as the SEC in the U.S.), especially regarding transparency, registration, and investor protection.
Commodity: A standardized tradable good, often raw, such as oil, gold... or bitcoin, according to regulators. It does not imply any ownership rights in a company and is not subject to the strict regulation applied to securities, but is instead overseen by other agencies like the CFTC.
JPMorgan breaks with the past and moves closer to cryptocurrencies
Jamie Dimon, CEO of JPMorgan and until recently a staunch critic of bitcoin, has made an unexpected move: the bank is studying the possibility of offering loans backed by cryptocurrencies like BTC and ETH. The system would allow clients to obtain liquidity in dollars without selling their crypto assets, by depositing them as collateral.
The bank would not directly custody these assets but would delegate that function to specialized providers such as Coinbase Custody. Although still in an exploratory phase, this represents a radical change in the relationship between big banking and the crypto world.
Trump Media, Western Union and Polymarket stoke the crypto narrative
It’s not just banks that are positioning themselves. Trump Media & Technology Group (TMTG) confirmed a $2 billion investment in bitcoin, making it the fifth publicly traded company with the largest BTC holdings in the world. The company is also preparing the launch of its own token on Truth Social, its social network.
Meanwhile, Western Union is exploring the use of stablecoins to improve the efficiency of international transfers, while Polymarket is studying the launch of its own stablecoin or a partnership with Circle (USDC). All this is happening after the recent approval of the GENIUS Act, which for the first time regulates these types of assets in the U.S.
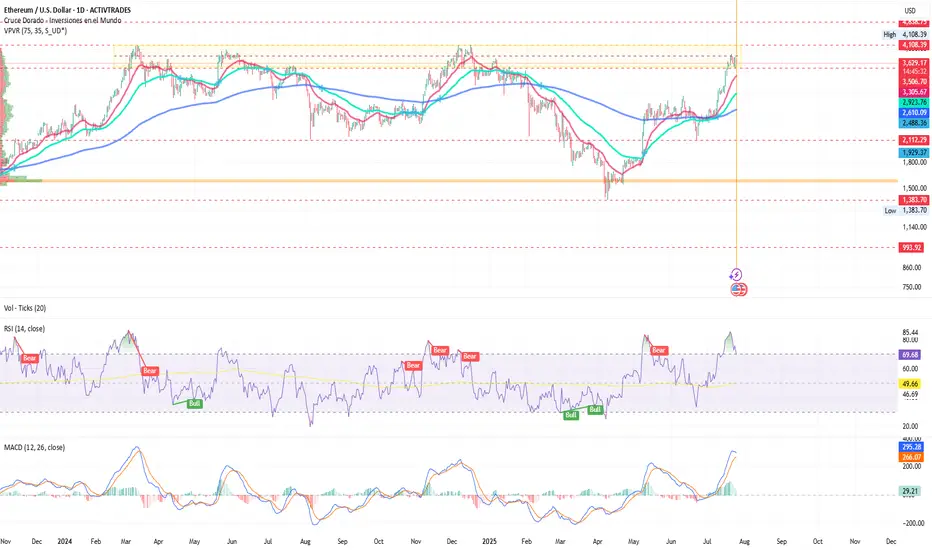
ETH/USD analysis: Beginning of a new bullish phase?
On the charts, Ethereum has responded to the macro and political environment with sustained recovery since April, entering a partial consolidation phase during several months this year. After holding the support level around $2,579, and since the golden cross on the 10th of this month, it has consolidated a price expansion leading it to test a new consolidation zone around $3,500. ETH now aims for more ambitious levels that could push the commodity towards recent highs of $3,857.67 and potentially break through to $4,000.
Currently, the price is within a range it has tested for the fourth time. If it fails to break out, we could see a pullback towards $2,700 or even a return to previous supports at $2,112 and the long-term point of control at $1,586.
Key support: $2,579
Immediate resistance: $3,857.67 (recent highs)
Target zone: $3,850 – $4,000 if a clean breakout occurs
Danger zone: Below $2,880, bearish pressure could return
Ethereum ready to make the leap
With the SEC’s legal backing, a recent surge in volume, the rise of spot ETFs, and the shift in traditional banking led by JPMorgan, Ethereum is cementing its role as a strategic asset in the new financial era, ready to lead the next phase of crypto adoption. This time, with Wall Street watching closely. Ethereum appears ready to play a leading role in the next stage of integration between traditional and digital finance — and it seems that big banks are betting heavily on ETH.
Ethereum is no longer in bitcoin’s shadow. Today, it stands as a key player in bridging traditional finance and the digital future.
*******************************************************************************************
The information provided does not constitute investment research. The material has not been prepared in accordance with the legal requirements designed to promote the independence of investment research and such should be considered a marketing communication.
All information has been prepared by ActivTrades ("AT"). The information does not contain a record of AT's prices, or an offer of or solicitation for a transaction in any financial instrument. No representation or warranty is given as to the accuracy or completeness of this information.
Any material provided does not have regard to the specific investment objective and financial situation of any person who may receive it. Past performance and forecasting are not a synonym of a reliable indicator of future performance. AT provides an execution-only service. Consequently, any person acting on the information provided does so at their own risk. Political risk is unpredictable. Central bank actions can vary. Platform tools do not guarantee success.
Ethereum Price Target $3,120 by Sunday?Ethereum short position Price Target $3,120 by Sunday ? Negative divergence on the hrly RSI.
Exhausted the 15 minute positive divergence when bouncing off the EMA 200 on the 1 Hour chart. First profit target is $3,350 second is $3,120. I am usually wrong with my estimations... I would recommend the opposite. So go long!

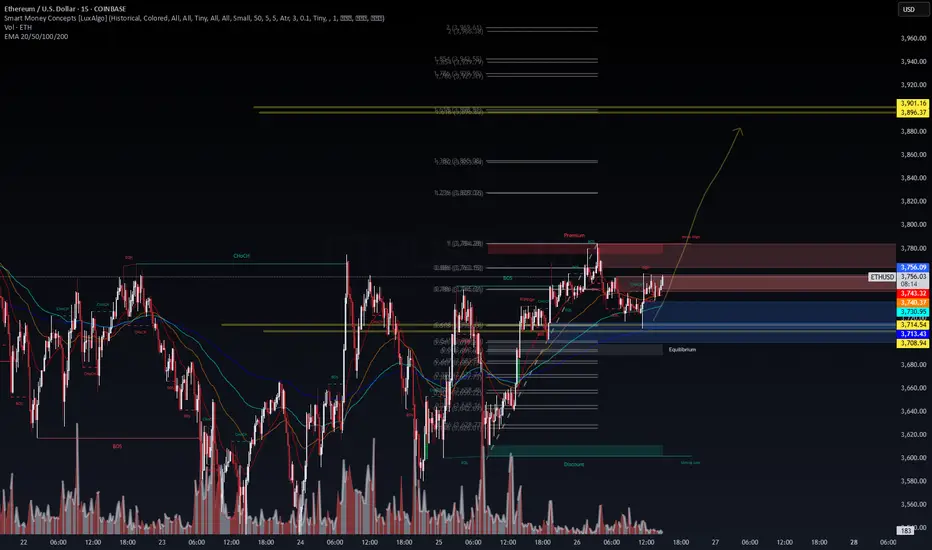
ETHUSD – Long Setup Activated | VolanX Protocol AlertEthereum (ETHUSD) is displaying strong bullish intent after reclaiming the VolanX Alert Line (~$3,659). Price action is forming higher lows with BOS (Break of Structure) signals, indicating that smart money is accumulating before a potential continuation rally toward the premium zones.
Key Levels & Zones:
Entry Zone: $3,660 – $3,680 (retest of equilibrium/alert line)
Target 1: $3,767 (weak high zone)
Target 2: $3,875 (premium zone)
Target 3: $4,000+ (extended bullish target)
Invalidation: Close below $3,620 (discount zone breach)
Rationale:
CHoCH → BOS → Retest Pattern: Multiple change-of-character moves followed by a BOS above $3,705 signal bullish market structure.
Liquidity Hunt Completed: Price swept the $3,540 discount zone and rebounded sharply, confirming smart money entry.
OPEX Volatility Catalyst: With options expiration tomorrow, volatility could drive ETH toward key liquidity zones. Favoring long bias as buy-side liquidity builds above $3,750.
Volume Surge: Breakout volume on 15m and 1H charts suggests institutional participation.
Trade Plan:
Long Entry: On a successful retest of $3,660–$3,680 zone with strong bullish candle confirmation.
Stop-Loss: Below $3,620 (structure invalidation).
Targets: Scale out at 3,767 → 3,875 → trail above $3,900.
Risk-Reward: ~1:3 or better, depending on execution and trailing strategy.
Disclaimer:
This analysis is for educational purposes only and not financial advice. Trade responsibly and use proper risk management.
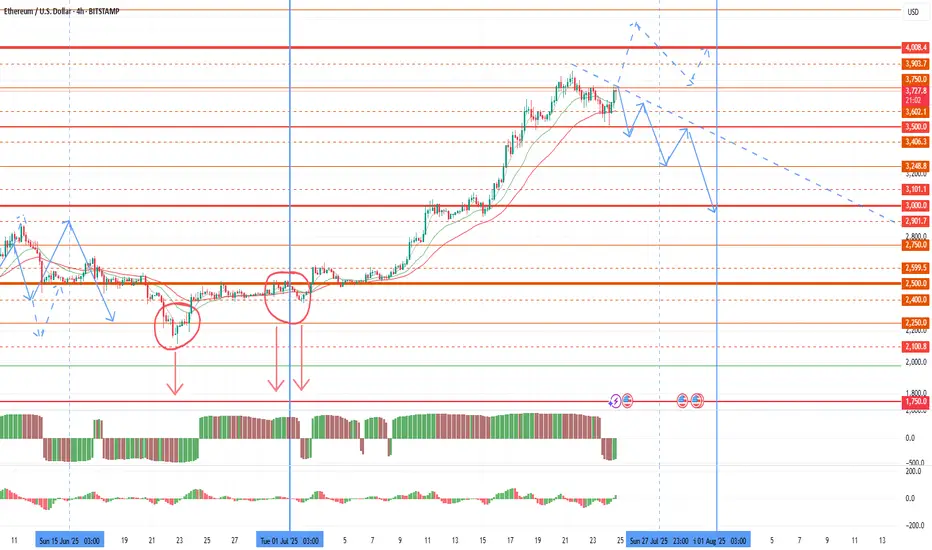
Possible market drawdown before the end of the monthToday I want to review the market and give a warning on further purchases. Since the last review, as expected, volatility in the market began to grow with a flat of about 2500 on ether until the half-year change. The growth of the euro and oil gave rise to a 4k retest in the new half of the year. However, the half-year has opened below 2,500, which is a technical selling signal that bears will use at the end of each major period. A large volume of sales was also left before the half-year change, which can be retested up to 2100-2250. The first pullback is already possible for the current monthly candle, with its pinbar reversal up to 2750-2900 on ether. This pullback started yesterday and is likely to accelerate in the last weekly candle of the month. Further sales are highly likely to continue in the first half of the new month as part of the shadow drawing for the new monthly candle. In an optimistic scenario, the bulls will be able to take 4,000 by the end of the week, in which case the pullback on the current monthly candle will be compensated.
Given the increased likelihood of sales in the market, I recommend fixing profits by the end of the week and reducing the number of coins in operation. The current rollback for some coins will also end with the assignment of the monitoring tag at the beginning of the month and a further collapse, which puts pressure on the coins.
Most of the coins that I considered for work provided good opportunities for making money, especially the growth impulses of pivx and data with sharp breakouts stood out. Adx fio chess cos token also showed growth, but at a smoother pace. The most negative dynamics was given by slf, which eventually received the monitoring tag, and I will not consider it in the future.
Despite the pleasant impulses of 50%+ for individual fantokens, this group as a whole shows extremely negative dynamics relative to the market, and remains in the most oversold position, even relative to coins with the monitoring tag. In an optimistic scenario, fantokens will become interesting to speculators against the background of the general decline of altcoins that has begun, and we can expect a good bull run on them before the end of the month. In a negative scenario, binance may be preparing to assign the monitoring tag to some tokens of this group or chz. In this regard, I leave such tokens as atm acm city porto Lazio as the most undervalued in a small lot. But at the beginning of the month, I also recommend keeping short stops on them in the first half of the day of the first week of the new month to insure against assigning the monitoring tag. Or temporarily sell them for a given period.
In addition to fan tokens, I will choose new coins for operation after assigning the monitoring tag in the new month.
ETH/USD Harmonics forecast. We are still studying it's trend, looks like the next move is going to be toward downwards, temporary.

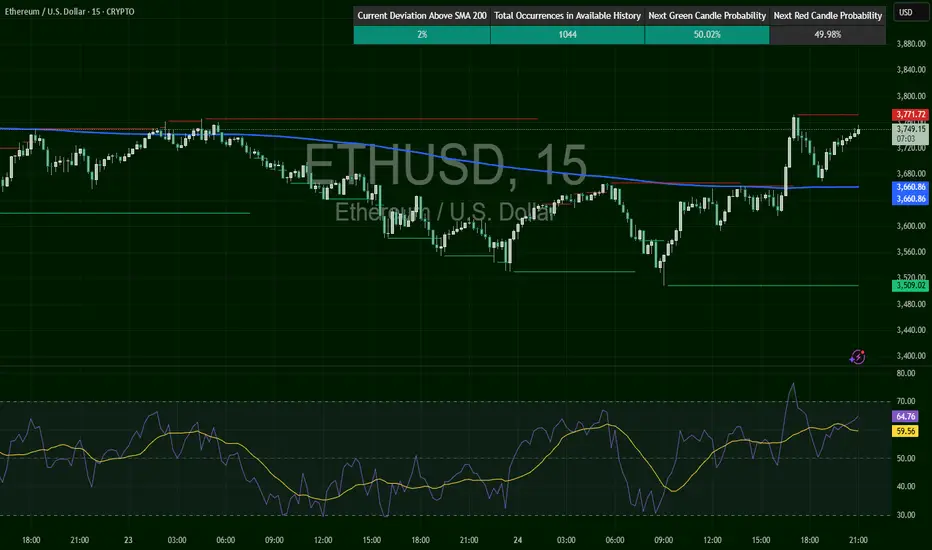
ETHUSD – From Breakdown to BreakoutETH reversed off a major demand near $3,510 and exploded past the 200 SMA into $3,747. Currently, price is resting just under resistance at $3,771, with RSI at 64.49 — strong and trending. If this resistance breaks, next leg up begins. If rejected, expect retest of $3,680–$3,700 range.
ETHEREUM Massive Triangle break-out ahead??Ethereum (ETHUSD) has been trading within a 4-year Triangle for the entirety of this Cycle. The recent post April rally has been the most aggressive since the parabolic rally that led to the Top of the previous Cycle.
The price is now almost on the top (Lower Highs trend-line) of the Triangle. A break above it, can initiate an aggressive Bullish Leg towards the 1.618 Fibonacci extension ($8000), which was the level that was marginally exceeded during ETH's first rally of this Cycle.
-------------------------------------------------------------------------------
** Please LIKE 👍, FOLLOW ✅, SHARE 🙌 and COMMENT ✍ if you enjoy this idea! Also share your ideas and charts in the comments section below! This is best way to keep it relevant, support us, keep the content here free and allow the idea to reach as many people as possible. **
-------------------------------------------------------------------------------
💸💸💸💸💸💸
👇 👇 👇 👇 👇 👇

ETHEREUM: THE NEW BOND OF THE DIGITAL WORLDPrice isn’t the goal. Price is the side effect.
Meanwhile, BlackRock - a black hole with a trust-backed logo - just absorbed 42,000 ETH more.
Yesterday, you may have read this "regular" headline:
BlackRock increases its Ethereum exposure to $4 billion, adding $109.5 million via ETFs.
But here’s what you missed: there are no random numbers on the market.
When a player like this moves - it’s not hype. It’s a blueprint for the future.
Ethereum is no longer an altcoin.
It’s no longer speculation. It’s a financial infrastructure, already recognized by law, exchanges, and institutions.
What does this mean?
💡 Ethereum is now a digital bond - with yield flowing from blocks.
Profit is no longer built on promises, but on the structure of the chain itself.
Trust lies not in faces, but in code.
Growth is not artificial — it’s architectural.
And here’s why this is terrifyingly beautiful:
While you sleep, they are building an era.
Each ETF purchase removes ETH from circulation - permanently. Because:
✅ This ETH is gone from the open market
✅ It won’t be panic-sold
✅ It becomes income-bearing collateral, not a speculative asset
Still waiting for an entry signal?
The big players are already in.
This is no longer crypto - this is cash flow infrastructure, embedded into the digital economy.
And when pension funds, insurers, and sovereign investors move into Ethereum - they will come via ETFs.
Not because it’s trendy, but because it’s regulated, stable, and profitable.
📉 When institutional demand meets vanishing supply - the price won’t simply rise. It will explode, not as growth, but as a structural liquidity shift.
Ethereum is:
💸 Staking = passive yield
🔗 Backbone of DeFi
🖼 Fuel for NFTs
⚙️ Millions of transactions per second
⚖️ A regulated ETF asset
This is the new digital bond system, where the bet isn’t on the dollar - it’s on ETH as an income-producing asset.
💥 While you're reading this, the game is already on.
ETFs are rewriting the rules of time-ownership.
No hype. Just filings. Just intention.
Best regards EXCAVO

Ethereum Long These zones are significant because they represent areas where large institutions and professional traders are likely to be active, potentially causing strong price movements when those orders are triggered. We want to enter trades that have minimal drawdown to maximize our buying power.