Ethereum Holds the Line – Is $2,300 the Key to the Next Rally?By examining the #Ethereum chart on the weekly (logarithmic) timeframe, we can see that after rising to $2,880, the price faced selling pressure and corrected down to $2,500. This upward move created a large Fair Value Gap (FVG) between $1,870 and $2,300, which is likely to be filled in the medium term if the price drops further.
However, as long as Ethereum continues trading above the $2,300 level and does not close below it, we can still expect further bullish movement.
ETHUSDT.3L trade ideas

ETH READY TO 3000$ ??? YES eth just about his support level eth can test from here 2450 than possible we can go 3k if iran or isreal war stop and at 18 june also here fomc meating where news about rate cut if not rate cut than possible market dump from here and btc or eth badly if rate cut done than also possible dump to liqudite longer for more deatile check bio
thanks for watching

HolderStat┆ETHUSD continues to accumulateOKX:ETHUSDT is catching bids at the 2.50 k rail after triangle retest, converting shakeout into upside continuation. Staying above 2.40 k keeps bias north; clearing 2.75 k releases the 3 k target rocket 🚀

ETH/USDT – 6 Weeks of Doji: The Calm Before the Storm?⏳ Summary:
Ethereum has been moving sideways for 6 straight weeks, printing back-to-back doji candles — a rare phenomenon in any market. Price is trapped, pressure is building, and volatility is near its breaking point. History shows: after this much indecision, a violent breakout is almost inevitable.
🚨 What’s Happening?
6 consecutive weekly dojis — this kind of tight-range compression hasn’t been seen on ETH in years.
Price is squeezed between $ 2,500 support and $ 2,620 resistance.
Volume has dried up, and momentum is fading (RSI flat, wedge breakdowns on 4H/1D).
Bulls and bears are in a deadlock… and that never lasts long.
The longer the coil, the harder the snap.
🎯 Trading Roadmap (No Fluff):
📈 Bullish Breakout Trigger: Weekly candle close above $ 2,620 → Potential rally to $ 2,745 and $ 2,880 (Fib zones).
📉 Bearish Breakdown Trigger: Daily or weekly close below $ 2,500 → Expect a flush to $ 2,300 and $ 2,120 support levels.
🎯 Manage risk tight. This setup offers clean invalidation and powerful upside/downside potential.
📊 Why This Matters:
Markets don’t go silent for 6 weeks without a reason. ETH is gathering energy like a coiled spring — and once direction is decided, it can move fast and far. This is the kind of setup traders wait weeks to catch.
🤔 What Do You Think?
Is ETH quiet before the pump, or are bears waiting to break it down hard?
🗨️ Drop your thoughts, charts, or counter-setups below!

My ETH Game plan of this week.Eth is being supported multiple times from a support area. It is, in fact, in a rising channel; despite being rejected multiple times, it is still making higher highs.
I am still bullish as long as it is above the support area.

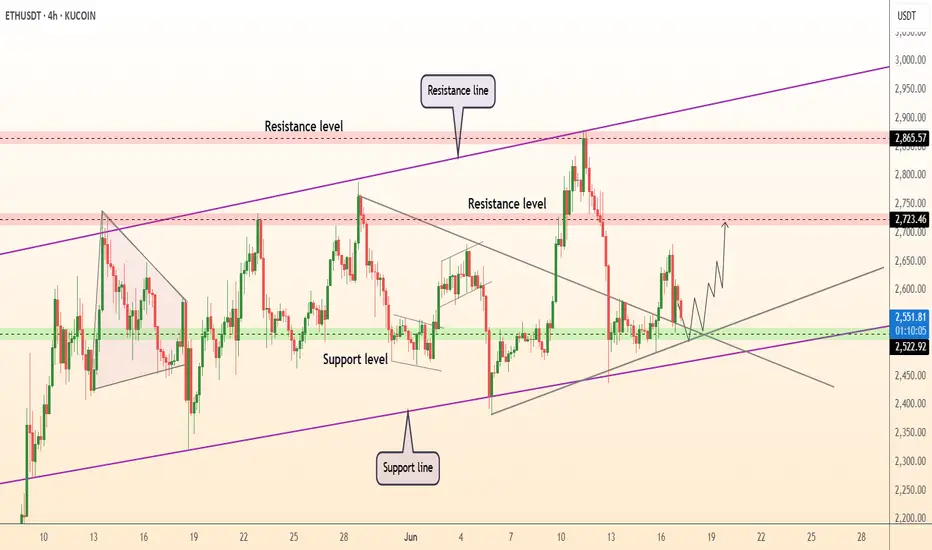
DeGRAM | ETHUSD held the trend line📊 Technical Analysis
● Price just printed a long-tailed rebound on the 4-month purple up-trend and the 2 520-2 560 demand strip, also reclaiming a broken pennant base—confirming a fake breakdown and locking the zone as fresh support.
● A higher-low sequence is compressing against the descending 2 650 trend cap; a 4 h close above it activates the 2 723 horizontal target and projects the channel-median swing toward 2 865.
💡 Fundamental Analysis
● Net staking deposits keep outpacing withdrawals while CME ether futures open-interest hit a six-week high, signalling renewed institutional hedging ahead of the spot-ETF ruling and supporting upside bias.
✨ Summary
Buy 2 540-2 580; clearance of 2 650 aims 2 723, stretch 2 865. Invalidate below 2 450.
-------------------
Share your opinion in the comments and support the idea with like. Thanks for your support!
Ethereum (ETH): Stonger Than Bitcoin For SureEthereum is doing much better compared to Bitcoin, that's for sure, but it does not mean that ETH is not struggling.
We see the pressure that sellers are putting on, trying to regain the control over the 200EMA, which is a crucial area for us right now.
So while we keep our target at $3000 (first target), we also keep close attention to that moving average, where if we lose dominance, we might be heading to lows here...
Swallow Academy

ETH: The Structure Remains BearishAs of now, the overall market structure for Ethereum still appears bearish.
Here's what I'm watching:
From the NY Open, I think there's a high possibility of a quick liquidity grab to the upside followed by a correction downward.
However, this sweep may not even happen. It will largely depend on geopolitical developments, particularly the Iran-Israel conflict, which remains a major market-moving factor.
I don’t know what kind of news could trigger this, but judging by the chart, there’s absolutely nothing bullish for now and honestly, it might even get uglier than it already was between Iran-Israel.
What’s below? A lot of liquidity.
On the chart, I’ve highlighted key downside targets:
Previous Day Low (PDL)
Previous Week Low (PWL)
One Day Fair Value Gap (1D FVG)
My personal expectation: a delivery of price into the 0.705 Fibonacci zone of the recent impulse.
This area also includes the Point of Control (POC) and completes the 1D FVG fill.
That’s where I’ll be looking for a potential bullish reversal.
Outlook for July
I'm still hopeful that the market tone shifts bullish in July.
Why? I expect a wave of positive narratives:
Trump’s proposed tariff adjustments
Multiple ETF approvals (especially altcoin-related)
Retail attention coming back
The setup is forming but for now, ETH remains under bearish pressure.
Stay tuned. Take care. More to come.

Ethereum: Is a Major Bullish Wave Coming?Ethereum: Is a Major Bullish Wave Coming?
Following our previous analysis, ETH dropped from $2,770 to $2,440, aligning with one of the anticipated price scenarios.
The support zone near $2,440 once again demonstrated its strength, pushing the price back up to $2,660. Given the strong accumulation pattern, the likelihood of a larger bullish wave is increasing.
A quick target for the current move stands near $2,800, and a breakout above the pattern could signal the start of the expected bullish trend, with the following key targets:
🎯 $3,300 🎯 $3,800 🎯 $4,500
You may find more details in the chart!
Thank you and Good Luck!
❤️PS: Please support with a like or comment if you find this analysis useful for your trading day❤️

ETh pump today back to $2680Opened a long position on ETH. Anticipating a pump back up to the highs of $2680, $2815 if breaks out impulsively.
Stop: $2549.08 or lower

Bitcoin Or Gold? Real Safe Haven In Middle East tension When the world shakes, where does money go— Bitcoin or gold ?
You may think crypto is the ultimate safe haven… but data tells a different story.
This breakdown compares digital dreams vs. physical trust —with charts, tools, and the psychology behind every move.
Hello✌
Spend 3 minutes ⏰ reading this educational material.
🎯 Analytical Insight on Bitcoin:
Contrary to common expectations, Bitcoin has shown relative resilience amid recent geopolitical tensions, refraining from a sharp sell-off.
This price behavior signals a potential shift in market psychology—something I’ll explore further in an upcoming educational post.
Based on my previous analyses, I continue to anticipate an upward breakout above the $110K resistance zone in the current structure.
Now , let's dive into the educational section,
📌 Gold: The Legacy of Trust
For thousands of years, gold has been the go-to safe asset. In wars, inflation, sanctions, and crashes—it remains the mental anchor of value. Tangible, historic, and out of government control.
🪙 Bitcoin: Revolutionary but Unstable
Bitcoin promises freedom, decentralization, and anti-inflation. But during actual crises, trust wavers. High volatility, regulatory risk, and lack of a long history make investors hesitate when fear hits hard.
🛠️ TradingView Tools That Reveal Where Smart Money Flows
One reason TradingView stands out is its wide set of tools that help you track market psychology—not just price action. When it comes to analyzing the Bitcoin-vs-Gold battle during global crises (like the Iran-Israel war), these tools are essential:
Correlation Coefficient: This shows how closely BTC and gold move together. In panic moments, it helps reveal where the real trust is flowing.
On-Balance Volume (OBV): Key for spotting where big money is headed. If OBV on gold rises while BTC’s falls, smart money isn’t betting on crypto just yet.
Fear & Greed Index Logic (DIY): While not a native TradingView tool, you can mimic it by combining volatility and volume indicators to reflect market emotion.
Overlay XAUUSD and BTCUSD: Place both on a single chart with “percentage scale” enabled. You’ll see exactly which one holds up better during chaos.
Marking Geo-Political Events: Tag key events (like missile strikes or sanctions) on your charts. Track how Bitcoin and gold react immediately after.
📊 How Investors React in Crisis
During events like an Iran-Israel war, data shows money often flows into gold—not BTC. When panic peaks, people run toward the “known,” not the “new.”
🧠 The Illusion of Crypto as Safe Haven
We want to believe BTC is the new gold. But the human mind—under threat—defaults to ancient instincts. Fear doesn’t innovate. It runs to what it knows: shiny, physical, historical gold.
💡 When Will Bitcoin Truly Compete?
When the next generation fully embraces digital assets. When institutions store BTC alongside gold. When BTC no longer crashes on scary headlines—that’s when the shift becomes real.
⚠️ Lessons from War
Wars reveal that markets don’t behave rationally in fear. Even if Bitcoin makes sense on paper, emotion drives flows. Right now, that flow still favors gold.
🔍 What to Watch Next
If, during a future conflict, Bitcoin drops less—or even rises while gold does—you may be witnessing a turning point. Until then, keep tracking both with your TradingView setups.
🧭 Final Takeaway
Gold still owns the trust game in a crisis. Bitcoin is on its way but hasn’t crossed that psychological line. If you’re a smart trader, know how to read both—and move before the herd does.
✨ Need a little love!
We put so much love and time into bringing you useful content & your support truly keeps us going. don’t be shy—drop a comment below. We’d love to hear from you! 💛
Big thanks,
Mad Whale 🐋
📜Please remember to do your own research before making any investment decisions. Also, don’t forget to check the disclaimer at the bottom of each post for more details.

Ethereum Wave Analysis – 16 June 2025
- Ethereum moving inside sideways price range
- Likely to rise to the resistance level 2754.00
Ethereum cryptocurrency recently reversed up from the support zone between the support level 2435,00 (lower border of the active narrow sideways price range from May), lower daily Bollinger Band and the 38.2% Fibonacci correction of the upward impulse from May.
The upward reversal from this support zone continues the active minor impulse wave 3 of the intermediate impulse wave (3) from last month.
Ethereum can be expected to rise to the next resistance level 2754.00 (upper border of the active sideways price range).

ETH TREND LINESIndicated all essential trend lines on ETH chart.
Long idea based on a bullish flag. 60/40%
Target price 3600$. Bullrun scenario.

ETH didn’t rally — it cleared inefficiency and pausedThis isn’t the move. This is the setup for the move.
ETH tagged 2658.22 — premium — and stalled right where Smart Money pauses before redistributing or rotating.
Here’s how this lines up:
Price swept into the 0 fib (2658.22), then hesitated — that’s not weakness, that’s precision
Just below sits a clean FVG at 2594–2575, right between the 0.382–0.5 fibs
Below that: OB near 2527–2492 — last line of defense before momentum flips
Right now, ETH is offering a reactive pullback opportunity. If bulls hold 2594–2575 with a bounce, we rotate higher again. But if they don’t — 2527 becomes the decision zone.
Execution lens:
Ideal re-entry zone: 2594–2575
Invalidation: sustained close below 2555 = expect OB tap
If FVG holds, expect revisit of 2658 → extension toward 2680s
This setup isn’t done. It’s developing. Wait for price to speak — not hope.
For more plays built like this — mapped in advance, not after the fact — check the profile description

BITCOIN; Is It Printing a Lower High?BITCOIN Is it printing a lower high?
Well by the way is moving (playing lazy) and knowing that its 4hrs Bullish TIME Cycle is near the end we can only say that if it doesn't turn on the boosters then it will be in trouble.
Next drop will start soon and once we see how low bears were able to push price down we will know if target price of $118k will be possible by end of month/first week of July or not.
$114K started to show up on radar but with the TIME bulls have left I don't think will be possible to get there . Will see how bulls play their last hand of the month.
We'll follow with updates so stay tuned.


Weekly trading plan for ETH In this idea I marked the important levels for this week and considered a few scenarios of price performance
Write a comment with your coins & hit the like button and I will make an analysis for you
The author's opinion may differ from yours,
Consider your risks.
Wish you successful trades ! mura

ETH Eyes Key Resistance — Bullish Structure Holds!🎯 Trading Plan:
Scenario 1 (Bullish Continuation):
Buy or hold as long as price holds above VWAP
Target move toward $3,000 –$3,430 (resistance zone)
If breakout above $3,430 — watch for acceleration
Scenario 2 (Rejection at Resistance):
Wait for confirmation of rejection (e.g., weekly SFP or bearish engulfing) in $3,000 –$3,430 zone
Consider short/hedge if rejection is confirmed, targeting a move back toward $2,600–$2,222
Invalidation:
Structure turns bearish only if price closes below $2,222
🔔 Triggers & Confirmations:
Uptrend intact as long as price is above VWAP
Confirmation required for shorts: look for SFP or clear reversal pattern at resistance
📝 Order Placement & Management:
🔼 Buy/Hold: While price is above $2,222
🛡️ Stop: Close below $2,222 (monthly close)
🎯 Targets: $3,150 → $3,430
🔻 Short/Hedge (optional): On confirmed weekly rejection at resistance
🎯 Short Target: $2,600–$2,222
🚨 Risk Warning:
Main structure is bullish; any shorts are strictly countertrend and require strong confirmation

ETH is holding the midrange supportETH tagged 50% of the down candle that took out local lows — textbook support zone for new longs.
Main risk: stops under $2,300 probably get swept before real reversal — watch for fakeout.
Holding above $2,400 keeps the bullish thesis alive, next target $2,780–2,800.
As always — manage risk, don’t get caught on the wrong side of a sweep.

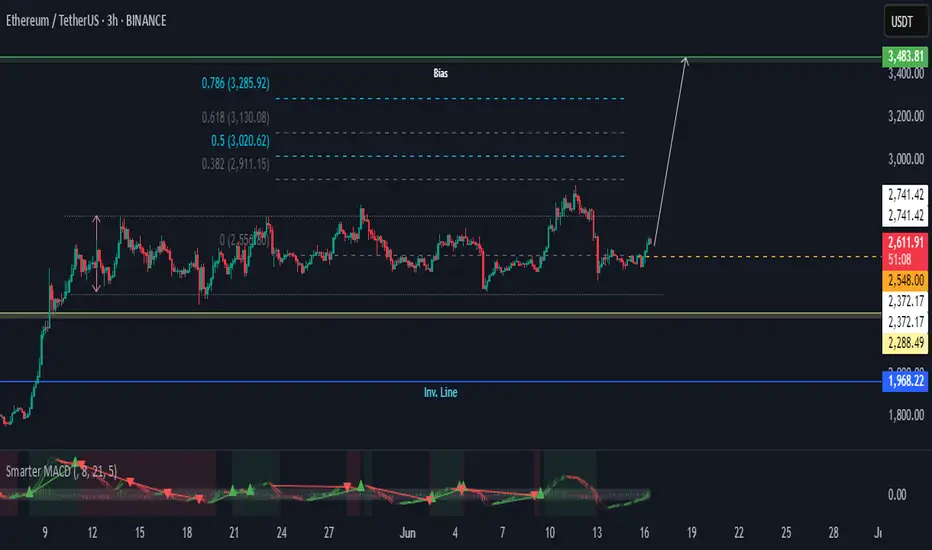
Ethereum TA: Bullish Momentum Signals Potential RallyHi there,
Ethereum shows bullish momentum with a positive MACD crossover while consolidating above key support levels, suggesting potential upward movement.
Ethereum’s price structure is strengthening, and if it clears the 2741.42 resistance, it could trigger a rally toward 3020.62–3285.92.
Happy trading
K.
Not trading advice.
ETH is doing it AGAIN!Hello TradingView Family / Fellow Traders. This is Richard, also known as theSignalyst.
📈ETH has been overall bullish trading within the flat rising channels marked in blue.
Moreover, the green zone is a strong support zone!
🏹 Thus, the highlighted blue circle is a strong area to look for buy setups as it is the intersection of support and lower blue trendlines acting as non-horizontal support.
📚 As per my trading style:
As #ETH approaches the blue circle zone, I will be looking for bullish reversal setups (like a double bottom pattern, trendline break , and so on...)
📚 Always follow your trading plan regarding entry, risk management, and trade management.
Good luck!
All Strategies Are Good; If Managed Properly!
~Rich

ETH/USDTEthereum (ETH/USDT) is currently maintaining its bullish momentum above a well-respected ascending trendline that has been active since early April. After a strong breakout above the 2347 level, the price entered a consolidation phase between 2600 and 2800, suggesting that the market is preparing for its next significant move. As of now, ETH is trading near 2627 and forming higher lows, which is a positive sign of buyer strength.
The key support zones are located at 2347 and 2266, while resistance levels to watch are 2768 and 2834. As long as the price holds above the ascending trendline, the bullish structure remains intact. A bounce from the current region, especially near the trendline, may present a favorable long opportunity. In such a scenario, a breakout above 2768 could open the path toward 2834 and potentially higher levels in the medium term.
A suitable long setup would involve entering around the 2620–2640 zone with a stop loss below 2347 to protect against trend invalidation. The first profit target can be set at 2768, and the second at 2834. However, traders should remain cautious: if ETH breaks below the trendline with strong bearish volume, the bullish outlook would weaken, and the price may revisit lower supports. Until then, the market structure favors buying the dips in alignment with the prevailing uptrend.

Ethereum (ETH): Time To See Proper Breakout | $3000 IncomingEthereum is still in a sideways channel on smaller timeframes, where we are looking for the price to reach the $2,834 area. Once there, we will be monitoring closely to see either the breakout from there or another rejection and smaller ride to lower zones.
Overall we are bullish on ETH; liquidity needs to flow here now.
Swallow Academy
