Momentum Reload: Next Scale-InHello traders,
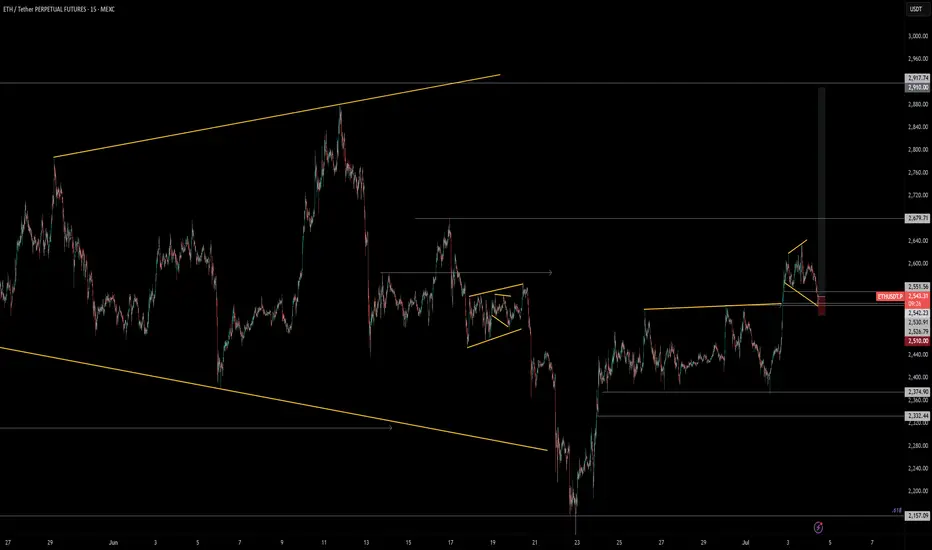
First position still floating. The scale-in has been executed. The structure is clear, and the positioning, sequence, and entry are all solid. I'm comfortable taking a potential loss on this position. Stops from the previous trade have been moved to the current stop-loss level, making the overall position risk-free.
I'll release a video soon to walk you through the details.
Stay safe chads! Peace
MEXC:ETHUSDT.P
BINANCE:ETHBTC
CRYPTOCAP:TOTAL
ETHUSDT.3L trade ideas
Ethereum (ETH): $2800 Is Next TargetEthereum had a good rally where buyers took control over EMAs, whereafter a successful retest, buyers are back in the game (hopefully).
We are starting to look for another long entry on the COINER at $2,600; once we see a proper BOS in this region, we will be opening a long position.
Swallow Academy
ETH.... You can do it. Get back into structure. ETH is struggling below resistance; however, an exchange of hands on lower timeframes can give the bulls a bit more wind. A break back into structure would be bullish. Don't mind me, I've been smoking that hopium.
Full TA: Link in the BIO

ETH 1D Analysis – Eyes on the 21EMAETH is currently hovering near $2,420, right above the key support at $2,415. Price is trying to reclaim the 21 EMA, which is crucial for bullish momentum.
🔹 Two Fair Value Gaps (FVGs) acting as demand zones
🔹 Daily close above 21 EMA = strong bounce expected
🔹 First major resistance at $2,740
🔹 Breakout could trigger a rally toward the $2,900+ zone
Bias: Bullish if reclaim confirmed
📌 Watch daily close – reaction from this level is key
NFA | DYOR
#ETH #Ethereum #Altcoins #Crypto #FVG #21EMA

ETH and iHnS SpeculationETH in candle stick mode create iHnS pattern
if we can hold above 2k its still positive if we can retest to 3.2k
ETH update 9.06.2025Hello everyone, many of you asked me to publish my vision for ETH.
Here you go!
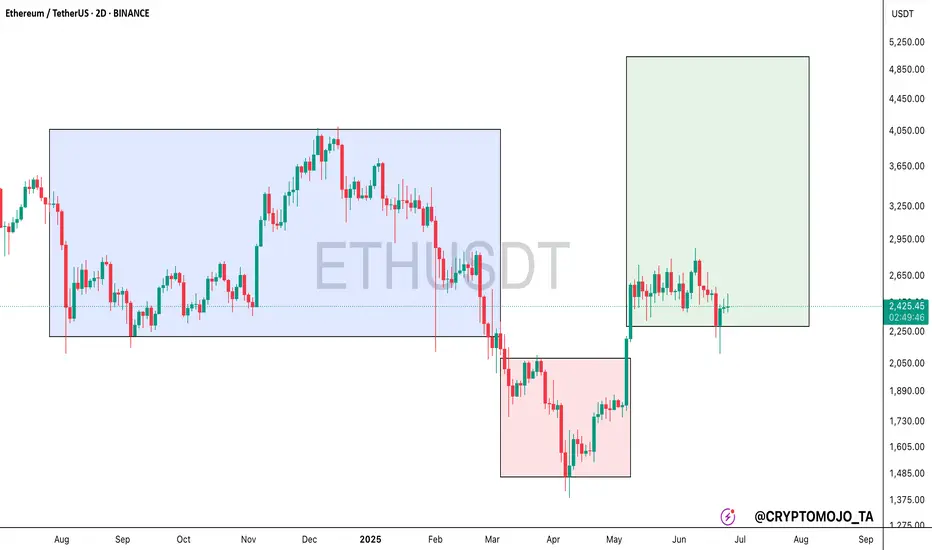
I believe that the previous impulse movement was only the first upward movement, and now we are in a sideways correction movement — call it what you will, but the fact is that the exit from this flat will be upward.
1. End of the year
2. ETH is accumulating on the Onchain
3. Liquidity overflow from BTC can be seen on the ETHBTC chart, and the overflow began at the very bottom
4. What else can large conservative players accumulate?
5. We are going after liquidity from above and should break 4100 by September
Best Regards EXCAVO

ETH New Analysis (12H)This analysis is an update of the analysis you see in the "Related publications" section
The previous analysis is still valid | its timeframe is higher, but in this update, we've moved to the lower timeframes.
It seems a valid bottom has been formed on Ethereum, and we may not see a lower low, provided that the price doesn't move higher first but instead drops directly into our support zone. If that happens, the price could potentially move upward from there.
Ethereum seems to be searching for a support zone to reach higher levels. The marked area could potentially launch the price upward.
In this analysis, the support zone, targets, and invalidation level have been updated.
For risk management, please don't forget stop loss and capital management
When we reach the first target, save some profit and then change the stop to entry
Comment if you have any questions
Thank You

$ETH is showing signs of a potential bullish move!CRYPTOCAP:ETH is showing signs of a potential bullish move.
The recent consolidation looks like it's building up for a strong breakout.
With market sentiment improving and growing interest in ETH-based projects, this could be a good time to accumulate before the next move up.
I’m watching the key resistance levels closely, if they break, we could see a fast rally.
#Ethereum
Ethereum Leveling Map — ETH/USDT 1DNo directional bias for Ethereum, but will use levels to spot entries for intraday.
Right now located at POC and seems balanced for both sides.
Potential Adam&Eve setup in development.
Quality levels for support $2150, 2000, 1800, 1500.
Resistances $2700, 3000, 3500, 4000
Keep in mind it will follow BTC price action by most of time.
Happy trading

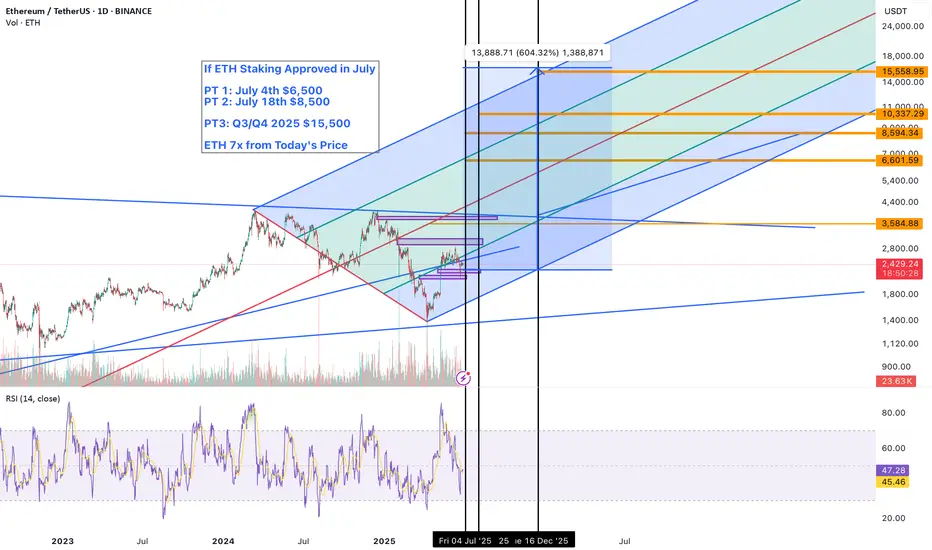
Ethereum’s $10K Breakout Is in Sight — BRock's Staking ETF July🚨 Ethereum’s $10K Breakout Is in Sight — BlackRock’s Staking ETF Could Trigger a Historic Supply Squeeze
All eyes are on the SEC’s pending decision regarding BlackRock’s Ethereum Staking ETF, and if approval lands in July 2025, it could trigger one of the most powerful supply-side shocks in Ethereum’s history.
This isn’t just about price speculation. It’s about structural demand meeting vanishing supply.
🟢 Why This ETF Is a Game-Changer
BlackRock isn’t just filing for an Ethereum ETF—it’s filing for a staking-enabled ETF. That’s a huge distinction. This means:
ETH held in the ETF will be staked, earning real yield
Staked ETH is locked and removed from circulation
Institutional capital gains exposure to yield + price upside
Ethereum becomes a yield-bearing digital commodity
It’s no longer just “digital oil.” It’s now digitized yield, and institutions are hungry for real yield in a low-rate environment.
📈 Technical Setup Is Bullish
ETH is coiling under its former ATH of ~$4,800
RSI shows no major bearish divergence
ETH/BTC ratio shows signs of breakout after long consolidation
Bitcoin dominance is peaking → altseason rotation imminent
Add a major ETF approval catalyst to this technical structure, and ETH could move explosively.
🔮 Ethereum Price Forecasts Post-Approval
Scenario Price Target Timeframe
Conservative $6,000–$7,000 2–4 weeks post-approval
Upside / Momentum $9,000–$10,000 Q3 2025
Supercycle Case $12K–$15K Q4 2025–Q1 2026
Why $10K ETH is Realistic:
Bitcoin’s ETF sparked $15B+ in inflows in <6 months
ETH has smaller market cap, so similar flows have outsized impact
Staking ETF removes ETH from float, making price reflexively bullish
TradFi gets exposure to yield + deflationary asset in one product
🔥 This Could Be Ethereum’s “GBTC Moment”
Remember how Grayscale’s GBTC product in 2020 created a reflexive premium and drove massive BTC inflows?
This is version 2.0, with yield attached. And instead of retail FOMO, we now have pension funds, RIAs, and endowments allocating via regulated ETF rails.
That’s not hype. That’s capital rotation—on-chain.
🛑 Risks to Watch
SEC delays or waters down staking component
Macro headwinds (rate volatility, geopolitical shock)
ETF approval gets front-run and sells the news
But even with these risks, the ETH supply structure is fundamentally stronger than during prior cycles. The burn is active. The float is tightening. And now TradFi wants in.
✅ Conclusion: July Could Be Ethereum’s Tipping Point
With a BlackRock staking ETF on deck, a macro environment ripe for a Fed rate cut, and Ethereum sitting under its ATH with rising momentum…
$10K ETH isn’t a moonshot—it’s the logical next leg.
If approved in July, Ethereum may never trade below $5,000 again.
🔔 Follow for updates on ETH ETF flows, ETH/BTC ratio breakouts, and altseason timing models.
📊 Comment below—what’s your Ethereum price target if the ETF is approved?
#Ethereum #ETHUSD #CryptoETF #BlackRock #Altseason #ETHAnalysis #CryptoNews #TradingView
EthusdttHis asset has presented my expectation information, in which my my sell confident level is 90% for now, while the 10% left can be defined by FA.
the entry zone is valid. but if price kick my stoploss then , i will like to see price seek little higher price to the zone i point magnifier.

Q3 Could Be Big for #ETH, Breakout Watch ON#ETH bounced exactly from the 0.5 level of Fib Retracement, as expected.
Now it appears to be gearing up for its next breakout move!
After weeks of chopping inside a falling channel, ETH is showing signs of strength. It's reclaiming key levels and slowly pushing toward the breakout zone near $2,520.
A breakout above this resistance could trigger a sharp move toward $2,880 and beyond.
However, bulls need to hold the $2,300 zone, a drop below might delay the pump.
Structure is bullish, just needs confirmation.
IMO, Q3 could be massive for ETH.
Like & retweet for more updates.
#Ethereum

$ETHUSDT: Uptrend signal in the daily timeframeEthereum is ready to move higher, as I anticipated when the BINANCE:ETHBTC signal flashed...
Best of luck lads!
Cheers,
Ivan Labrie.

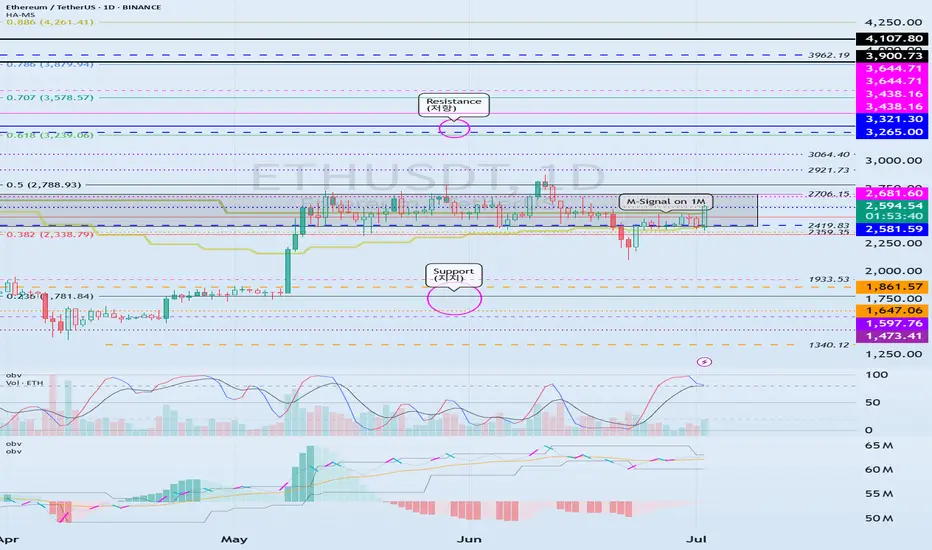
HolderStat┆ETHUSD fixed above the supportBINANCE:ETHUSDT broke out from a triangle and is holding above the 2,447 zone. The current ascending structure targets 2,700 in the near term. Reclaiming short-term resistances confirms a bullish reversal from recent lows, similar to past triangle breakouts.

Important Support and Resistance Areas: 2419.83-2706.15
Hello, traders.
Please "Follow" to get the latest information quickly.
Have a nice day today.
-------------------------------------
(ETHUSDT 1D chart)
The key is whether ETH can find support in the 2419.83-2706.15 area and rise.
This is because this section is the section that needs to be supported in order for a full-fledged uptrend to begin.
Therefore, if you are trading ETH, you can proceed with a purchase when support is confirmed in the 2419.83-2706.15 section.
-
Thank you for reading to the end.
I hope you have a successful transaction.
--------------------------------------------------
- Here is an explanation of the big picture.
(3-year bull market, 1-year bear market pattern)
I will explain the details again when the bear market starts.
------------------------------------------------------
Ethereum ETH price analysis💰 The price of CRYPTOCAP:ETH tested the strength of the bottom support and failed to consolidate above it.
This means that there will be another correction wave
🔥 Considering that #ETHETF is steadily "bying" every day, it would be a good idea for us/you to buy OKX:ETHUSDT in the range of $1850-1975 for investment portfolio before further growth.
👌 And you can also place a “bucket” with a pending order to buy #Ethereum at $1700, and maybe they will even "draw fall" the price at the moment to break all stops.
_____________________
Did you like our analysis? Leave a comment, like, and follow to get more

Ethereum Technical Analysis – Key Support Levels to Watch!🚨 Ethereum Technical Analysis – Key Support Levels to Watch!
After a strong rally in recent days, Ethereum (ETHUSDT) is now experiencing a healthy correction. The $2,440 zone is currently acting as a crucial support level that could determine the next move.
📉 If price breaks below this level, the next major support lies around $2,270, which could become a key area for bulls to step in again.
💡 All the important support and resistance levels are clearly highlighted on the chart. This is a must-watch zone for short-term traders!
🔔 Follow for more daily updates on Ethereum, Bitcoin, and altcoin setups!
#ETH #Ethereum #CryptoAnalysis #TradingView #TechnicalAnalysis #ETHUSDT

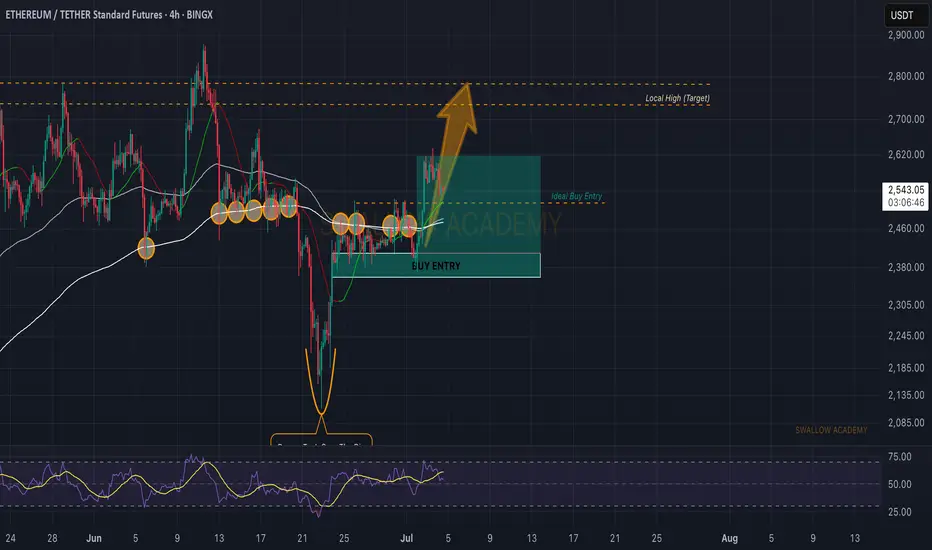
Ethereum (ETH): Hovering Near EMAs | Might Be Good Buying SpotEthereum is still hovering near local lines of EMAs, where we are expecting to see a volatile breakout very soon.
Now we have 2 buy entries, where the best option is after breaking the local resistance area, which is above the EMAs but overall, with the current buyside dominance we have had, we are seeing good chances for the price to reclaim the $2800 within days from here on.
Swallow Academy

ETH IN NO-MAN'S LANDEthereum is caught in no-man’s land. After a sharp rally in May that pushed price cleanly above the 200-week moving average, ETH has now slipped back between the 200 MA (around $2,400) and the 50-week MA (just under $2,600). It’s a classic case of being stuck in the middle – too weak to break higher, too strong to roll over completely. This is where momentum goes to die.
Until one of those moving averages gives way, expect more chop and indecision. A breakout above the 50-week could reignite bullish momentum, but a drop below the 200-week would bring $2,141 support back into play. For now, Ethereum’s just dancing between the lines.

ETHUSDTThis movement downtrend. If breake 2.790 movr to 3.500$ but breke 2.200 move trend to 1.500$.

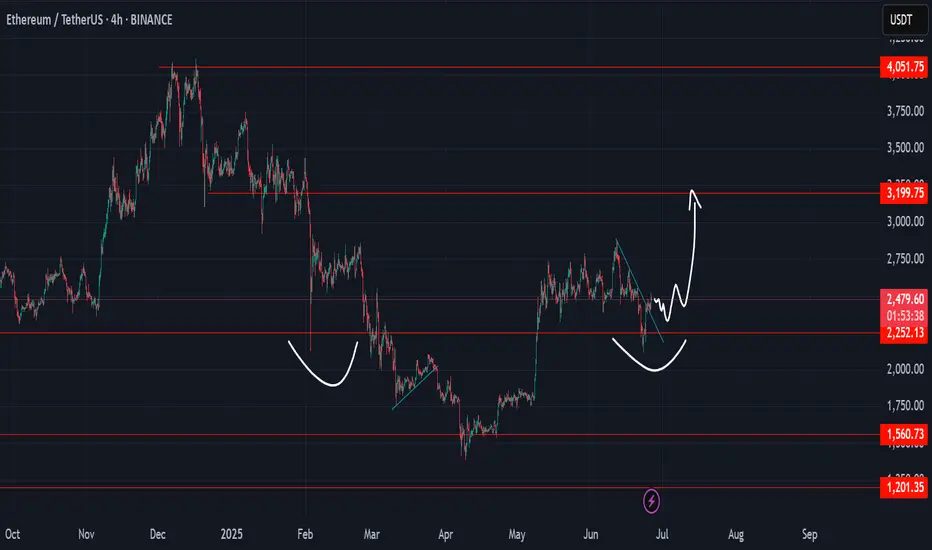
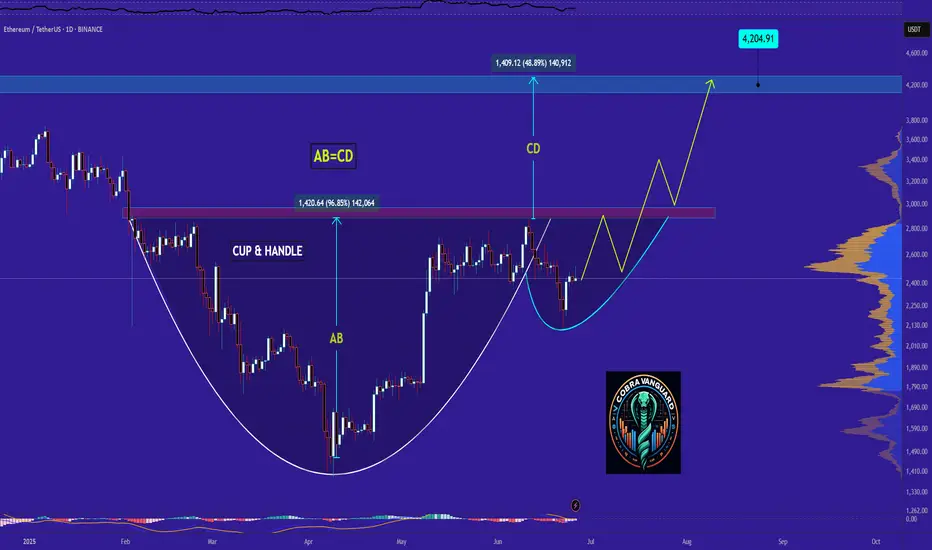
ETH It will grow soon...It can be said that the price has formed a cup and handle pattern, which it is completing soon. If the price follows this pattern, it can be expected that Ethereum will reach its peak again.
Best regards CobraVanguard.💚
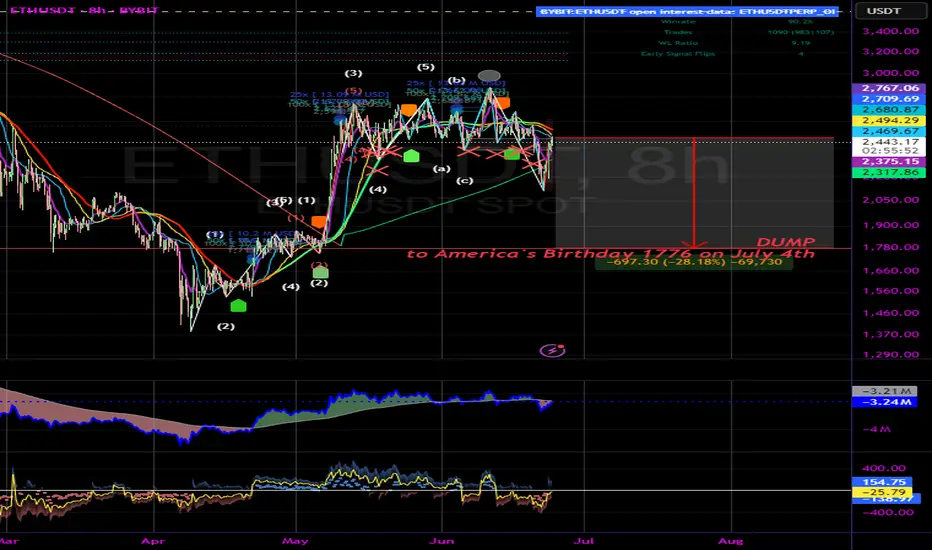
ETH Dumping to 1776 in honor of America's birthdayBART express incoming. Nice liquidity grab down there as well.
Not financial advice.
Happy July 4th!
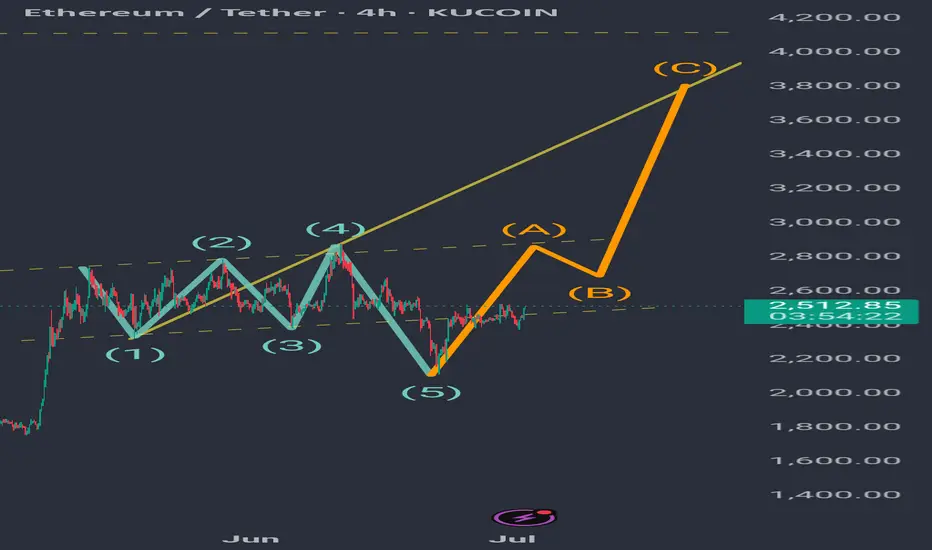
A probability: Bullish Wolve Wave on ethEth hit a low near $1,400 in early April and from there charted a sharp rise, doubling its price. Around $2,800, it clearly encountered resistance corresponding to the 0.5 Fibonacci of the previous downward movement. From that point, it moved sideways in a range whose downward breakout reached the 0.5 Fibonacci of the current upward movement, $2,113, where it found strong support and has returned to the range. So far, this appears to be forming a bullish Wolve wave, whose target would be reached at the yellow line, which is the projection of waves 1 and 4 connecting. If Eth manages to break through the range and consolidate above it, it is very likely to achieve that target.