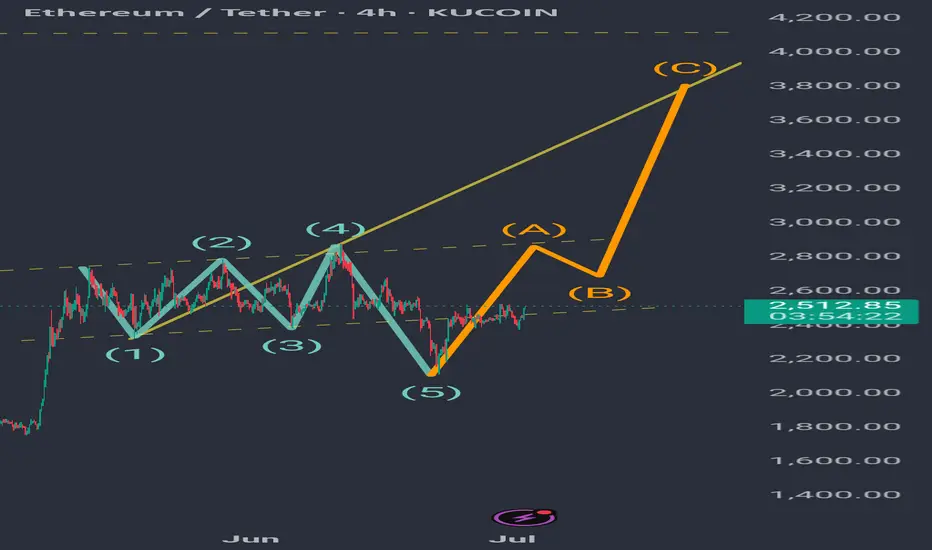
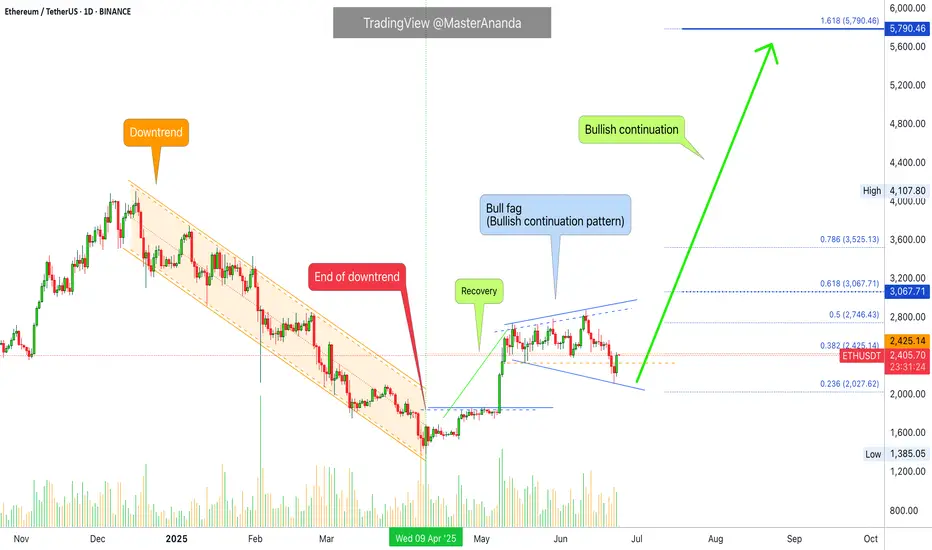
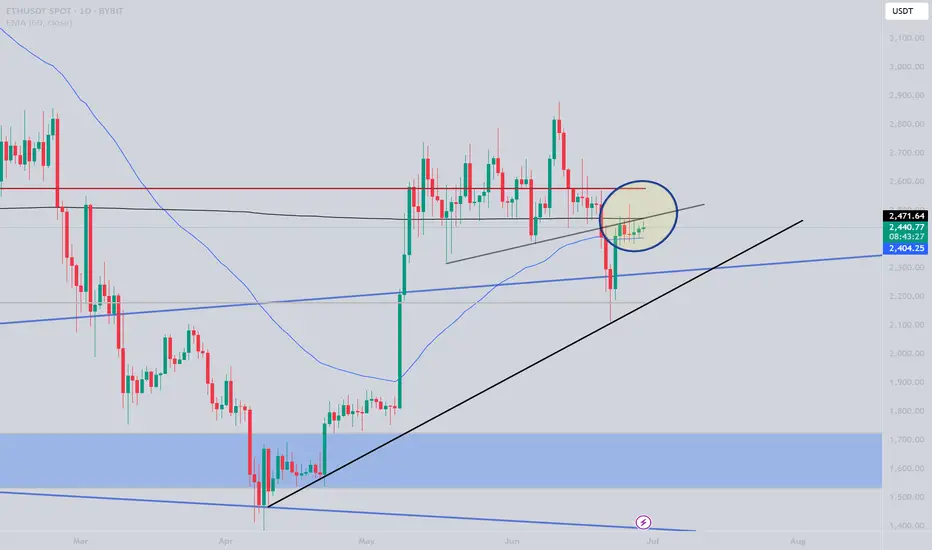
A probability: Bullish Wolve Wave on ethEth hit a low near $1,400 in early April and from there charted a sharp rise, doubling its price. Around $2,800, it clearly encountered resistance corresponding to the 0.5 Fibonacci of the previous downward movement. From that point, it moved sideways in a range whose downward breakout reached the 0.5 Fibonacci of the current upward movement, $2,113, where it found strong support and has returned to the range. So far, this appears to be forming a bullish Wolve wave, whose target would be reached at the yellow line, which is the projection of waves 1 and 4 connecting. If Eth manages to break through the range and consolidate above it, it is very likely to achieve that target.
ETHUSDT.3L trade ideas
ETHEREUM PRICEACTION TRADINGETHUSET have tested the broken demand floor and it looks like buyers are going for another .
if that level is broken ,it will be a wave of long which will hope to take profit on the supply zone .

$ETH: The 1-week chart is an absolute disaster!Once again, I want to make it clear: I’m naturally a bull. But I live in Thailand, far from the noise of influencers shouting "buy, buy, buy!" I’ve learned my lesson—when they scream buy, you get rekt. That’s why I rely solely on the charts.
Charts are just mathematics—they don’t lie. So here’s my honest interpretation of what I’m seeing for Ethereum:
🕐 Daily Outlook
Yes, we might see a few nice bounces in the short term. But if your plan is to hold ETH, you should be paying attention to higher timeframes, especially the weekly.
📉 Weekly Chart — It's Ugly
We’re clearly in a descending wedge, and overall, ETH is bearish. Don’t be fooled by the hype or the people trying to take your money.
- RSI is bearish, with a strong bearish divergence still unfolding.
- MACD is on the verge of a bearish crossover, and what’s worse, it’s doing that without even touching the neutral zone—a major red flag.
The last time we saw this setup? November 2021. The price crashed below $1,000.
🔍 Where’s the Support?
This cycle, the support zone looks closer to $1,500, mainly due to institutional interest and the ETF narrative. A full retracement seems unlikely, but technically speaking—it’s still a possibility.
🤔 Why Is This Happening Despite Institutional FOMO?
Here’s the key: ETH has staking, and every month, new CRYPTOCAP:ETH is minted to pay stakers. This creates constant inflation. On top of that, many stakers compound their rewards, accelerating the inflation. And guess what? These same stakers are selling as soon as ETH pumps.
So fundamentally, Ethereum is under pressure because of its own staking mechanics—a system flaw that creates long-term selling pressure.
Do your own research (DYOR). I could be wrong—but at least I’m not trying to sell you a course.

ETHEREM ETHUSD LONG TECHNICAL CHART IDEAEthereum (ETHUSD) Technical Outlook – Short-Term Levels and Potential Targets
📊 Key Insights:
First Below Support: 2560 USDT
Starting Journey: 2600 USDT
Resistance Zone: 2630–2650 USDT
Target on Breakdown: 2440 USDT
Market Structure:
After a period of consolidation between 2560 and 2600, ETHUSD has initiated a sharp upward move towards the resistance zone near 2630–2650. The chart projects a possible rejection from this resistance area, suggesting a potential pullback targeting 2440 if support fails to hold.
✅ Key Considerations:
Watch for price action confirmation around 2630–2650.
A sustained break above resistance could invalidate the short-term bearish scenario.
The target zone of 2440 aligns with prior support and could offer buying interest

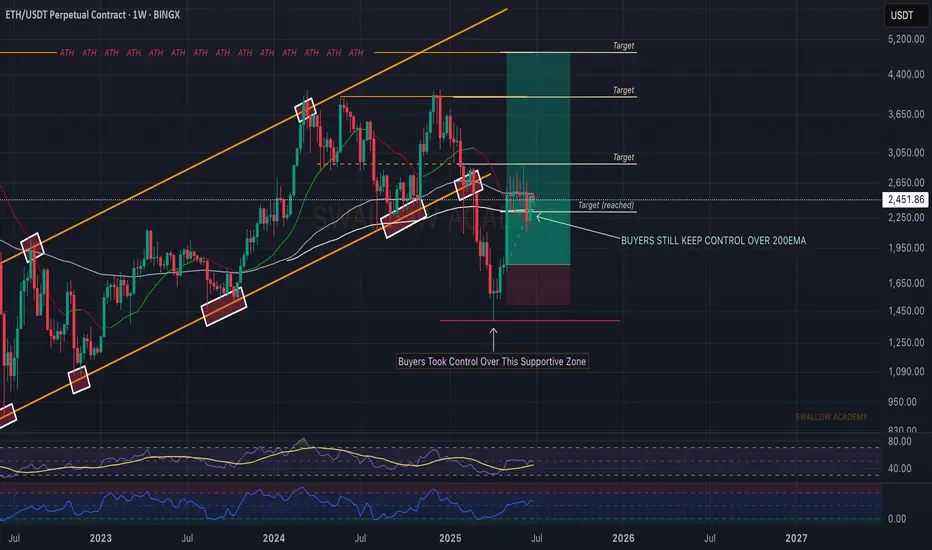
Ethereum (ETH): Buyers Took Back Control Over 200EMABuyers are back in control over the 200EMA, so nothing is lost yet. We keep our bullish game plan here. As many know, ETH is still far from its potential...considering the fact that BTC has already outperformed itself.
Time for ETH to shine now!
Swallow Academy
Ethereum (ETH): Good Start, Seeing Buyside DominanceEthereum has done well, where we have established a proper support area near the local buy zone, which should be enough for us to have a proper bounce from here towards our target of $2800.
As long as buyers keep the dominance near the buy area, we are bullish!
Swallow Academy

Weekly trading plan for EthereumBINANCE:ETHUSDT Last week, price mostly traded in a range. For this week, I've updated key levels, marked them on the chart, and modeled several scenarios. We can expect a pullback—possibly a deeper correction—before another push toward resistance levels. If price breaks the local low but then reclaims the weekly pivot point, I'll consider opening long positions without waiting for a deeper pullback.
Write a comment with your coins & hit the like button and I will make an analysis for you
The author's opinion may differ from yours,
Consider your risks.
Wish you successful trades ! mura

ETHUSD📊 ETH/USD 4H Trade Setup For Long
🔍 Watching an Inverse Head & Shoulders 🫱🫳👤
🔼 Entry: At Fib levels or marked zone
🛡️ Stop Loss: Below support / right shoulder
⏳ Time to Move: ~4 to 5 days from Support ➡️ Resistance
🚪 Tried to break major resistance 4 times
🌍 Geopolitical tensions 🌐 caused pullback
⚡ Now, resistance is weakening —
💥 Breakout likely
🎯 High Risk:Reward setup
📈 Get ready for the move!

#ETH Rebounds on Ceasefire News – Eyes Set on $3100 and Beyond!By analyzing the #Ethereum chart on the weekly (logarithmic) timeframe, we can see that after dropping to $2100, ETH started recovering strongly following the ceasefire announcement, and is currently trading around $2430. If Ethereum manages to close above $2700 by the end of the week, we could expect further upside.
The next potential bullish targets are $2890, $3100, and $4100.
Please support me with your likes and comments to motivate me to share more analysis with you and share your opinion about the possible trend of this chart with me !
Best Regards , Arman Shaban

Ethereum vs Small Cap. & The 2025-26 Cryptocurrency Bull MarketThe last three days ended up being a very nice flush, a strong one but the action quickly recovered above the 18-May low.
Ethereum was trading above $2,300 since mid-May and always stayed above this level. It broke suddenly below, out of nowhere, but the action is bullish again. We can say that this was a stop-loss hunt event, a bear-trap and nothing more or else we would see a continuation of the bearish action rather than a strong inverse reaction, a bullish jump.
It is not only Ethereum of course that is experiencing this type of bullish action, some altcoins are going nuts. Really crazy right now producing so much momentum that people are still wondering if the market is going down... Or is it going up?
It is obviously up, just look at the 7-April low.
Ethereum hit a low of $1,385 on 7-April. The higher low yesterday ended at $2,111.
You see what I mean?
The market is ultra-bullish because the last low is so far away. It is impossible that it will be tested even less possible for it to break. Ok, so a market shakeout we agree but now that the shakeout is complete what is supposed to happen next?
Watch the smaller altcoins.
Thank you for reading.
Namaste.
ETHUSDT WEEKLY UPDATE — PART 1
When Conviction Fails: Apex Rejection, Hidden Redistribution, and the Illusion of Demand
Good morning, good afternoon, good evening, wherever you're tapping in from. Now, as always, I’m not here to waste your time with unnecessary waffle. Let’s get straight into it and unpack this mess step-by-step.
THE APEX REJECTION | MORE THAN JUST A WICK
So picking up from last week's update, we find ourselves right at the crossroads, and not the romantic kind either. What we’re looking at right now so far, is a clean yet 100% conclusive rejection from the apex of a key macro structure.
This isn’t just any level. This is the intersection of vertical momentum and horizontal memory, the apex of a triangle that’s been forming for months. This is where bullish intent was supposed to hold, supposed to assert dominance, but instead, what did we get? A strong push into resistance, a failure to fix above it, followed by exhaustion and signs of institutional unloading.
Now, to the untrained eye, this may look like a pullback, or even a healthy correction. But we’re not here to look at charts with retail goggles. We’re here to track the true intent behind the price action, and if you know your schematics, this is screaming redistribution. And not just any redistribution, the kind that happens right before the market changes its personality.
WHERE ARE WE IN THE SCHEMATIC?
If we overlay Wyckoff logic on top of this structure, it's very clear:
We’ve had our PSY (preliminary support).
Followed by a spring, a shakeout, and a fake rally.
Now we’re dancing around what appears to be the UTAD (upthrust after distribution) — but weaker.
This isn’t classic distribution, it’s redistribution masked in macro confusion.
Here’s the thing this range isn’t just price consolidation, it’s behavioural conditioning. This long, choppy sideways movement is designed to wear out both bulls and bears, making them question their bias, mismanage their risk, and either overstay or exit too early.
The market is methodical, not random. These candles aren’t accidents, they are footprints of algorithmic trap setting, and right now, it looks like the net is about to close.
VOLUME TELLS THE TRUTH
Let’s not forget volume. Look at the weekly volume through this recent push:
Decreasing volume on the rallies,
Higher volume on the red closes,
And multiple spikes that failed to carry price past resistance.
That’s your dead giveaway. You don’t need to be a wizard, just follow the clues. Price is being pushed, not lifted. Demand isn’t stepping in, liquidity is being removed. This isn’t smart money accumulation, if confirmed by the endd of this week, this most recent move up cout be doing of smart money unloading, Quietly and Efficiently.
THE MARKDOWN IS PRIMED
Let’s now address the elephant in the room, the range low and point C of the triangle on the 4H.
T hat’s where liquidity is sitting.
That’s where the market’s next objective lies.
We’ve now failed to reclaim the apex, the wick was slapped down, and unless something significant shifts, the next logical move is to sweep that C point, take out the emotional support, and either:
Tap into true demand (if it exists), or
Begin the cascade toward the final green demand zones between 2,150–2,070, which we marked weeks ago.
And don’t forget, this sweep may not be clean. We could get a fakeout bounce mid-range — enough to bait in more longs, only to roll over again.
PSYCHOLOGICAL LAYER
What’s happening here isn’t just technical, it’s emotional warfare. This entire range has been one long gaslight for the average trader. Between the failed breakouts, failed breakdowns, and chaotic intraday behaviour, retail has been turned into liquidity.
And if you’re still trying to long blindly at the top of this, hoping for 3k ETH without a confirmed structure reclaim, then respectfully, you’re the product right now.
Coming next in Part 2:
A full breakdown of the 4H macro setup
Analysis of the internal range mechanics
Recalculated fib zones
Where the liquidity pockets are
What the most probable path is short, medium, and long-term
Stay tuned — I’ll keep the flow coherent, structured, and aggressive. No fluff. No hopium. Just structure, psychology, and execution.

ETHUSDT SWING TRADE SetupWait for the entry and must use sl, if sl hits then wait for candle closure, candle managed to close above the SL, still there is lot of supply zone for eth till 2.7k, So fakeout also possible. I will comment the update, SO closely follow me.
ETHUSDTThe price is in the local area
If the price stabilizes above the volume range and the trend line and moving average 60
We can expect growth to the range of 2.90 and 3 and then 3.4 thousand dollars.
Don't forget risk management and always expect any movement from the market.
Ethereum Breakdown Ahead? Classic Head & Shoulders Pattern Hello Guys!
Ethereum looks like it’s setting up for a potential drop after forming a textbook Head & Shoulders pattern on the 4H chart.
This pattern (marked clearly with a left shoulder, head, and right shoulder) is often seen before a price reversal. Right now, ETH has already broken below the neckline (around $2,480), confirming the bearish pattern, and is currently retesting that level from below.
📉 What’s Next?
If the pattern plays out, we could see ETH drop toward the projected target zone around $2,200–$2,250, which is highlighted in blue on the chart. This zone also lines up with a previous area of interest and sits near a broken trendline, adding confluence to the setup.
✅ What I see:
Resistance: ~$2,500 (neckline retest)
Target: ~$2,200 support zone
Broken trendline adds downside pressure
Unless bulls reclaim the neckline quickly and push above the right shoulder (~$2,650), this looks like a bearish continuation setup.

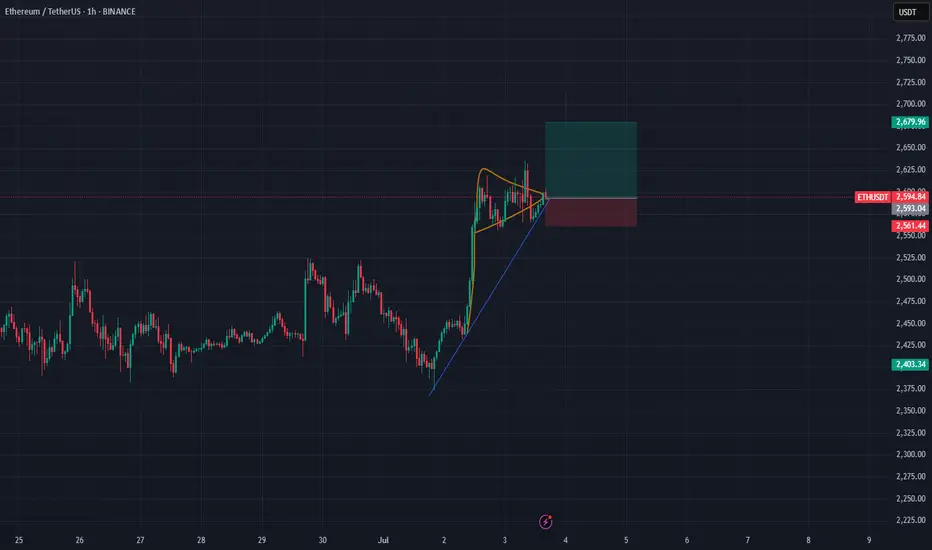
ETH/USDT – Symmetrical Triangle Breakout Setup (1H Chart)After a strong bullish impulse, ETH is consolidating in a symmetrical triangle formation — a classic continuation pattern. Price is coiling up near the apex, with higher lows forming against a horizontal resistance line.
Setup Highlights:
Pattern: Symmetrical Triangle (1H)
Trend: Bullish continuation after breakout
Entry Zone: ~2592 USDT
Target: 2679 USDT (upper green box)
Stop Loss: Below 2561 USDT (lower red box)
Risk-Reward: Favorable R:R structure
Watching closely for a decisive breakout above the triangle resistance to confirm bullish momentum continuation.
Let me know what you think — bullish continuation or fakeout risk?
#Ethereum #ETHUSDT #CryptoTrading #TechnicalAnalysis #BreakoutSetup #TradingView
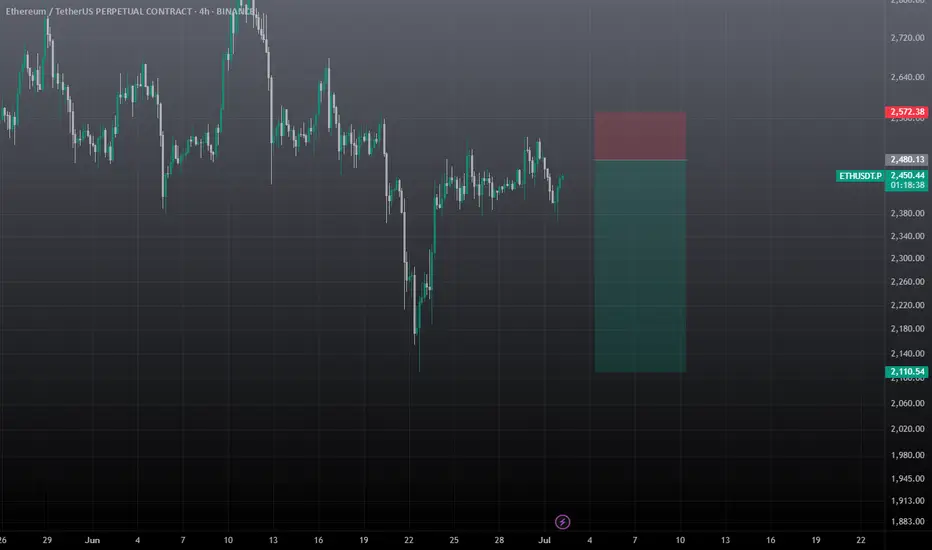
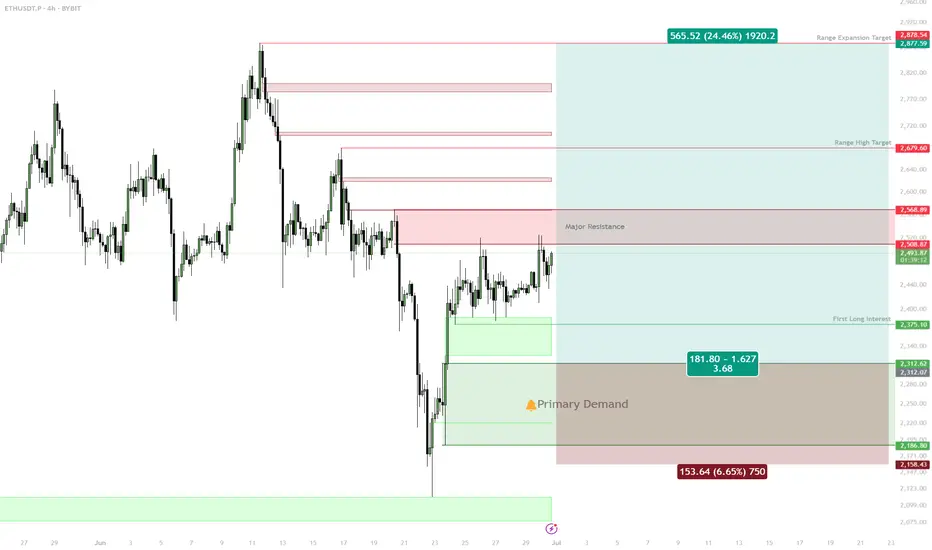
ETH: Deep Retrace or Shallow? Two Key Long Zones into Next Week✅ Two main long setups: Equal Lows @ $2,376, Untapped Demand $2,250–$2,314
✅ Best R/R from deeper demand zone, but will watch both levels
✅ Targets: $2,738 (range high), ~$3,000 (expansion)
✅ Shallow retrace may limit upside to a new local high, not full expansion
Setup 1:
Buy trigger on sweep and reclaim of $2,376 (equal lows)
Target: $2,508, then $2,738
Setup 2:
Preferred: Buy trigger into $2,250–$2,314 untapped demand
Target: $2,738, $3,000
Risk:
Wait for reaction/confirmation at both zones; no FOMO in between
🚨 Risk Warning:
If no strong bounce from these levels, stand aside — don't force the setup.
ETH | Long | 3 Hrs | Target: 2,540This technical analysis is for informational and educational purposes only. It does not constitute financial advice. Remember to always research and consult with a professional before making investment decisions. Good luck! 📈💼🚀


Ethereum Rebounds from Strong Base – ATH in Sight?Hello traders, here’s the CRYPTOCAP:ETH Monthly Outlook
Ethereum is flashing early signs of a bullish reversal, with a clean Morning Star candlestick pattern forming right above the $1,050–$1,200 support zone, a historically strong base.
After bouncing hard from this level, ETH is now approaching the major resistance area at $3,400–$3,800, the same zone that previously rejected upward moves.
If ETH can break and close above this resistance, we could see the start of a fresh bullish leg. But until then, this zone remains a major hurdle.
Keep an eye on the monthly close, it could confirm a shift in long-term momentum.
DYOR, NFA
Thanks for following along — stay tuned for more updates!

ETH Update: A Possible Rebound!ETH Weekly Update
ETH has formed a support trendline in the $1500–$1600 range and previously rebounded from it with a 90% gain. After a retest, it’s once again showing signs of a potential rebound from the $2100 level.
If this rebound holds, it could bring relief to price momentum, and we may see ETH retesting the $3500 zone. The RSI still has plenty of room to expand, suggesting further bullish potential.
Strategy:
~ Entry: $2100 to Current Market Price (CMP)
~ Accumulation Range: $1500–$1600
~ Trade Type: Spot
~ Holding Period: Q4 2025
~ Target: $3500
Note: Always do your own research and analysis before making any decisions. This is not financial advice.
Regards,
Dexter

#ETHUSDT: Currently On The Way Towards Filling The FVG?ETCUSDT is currently experiencing a significant correction as the price approaches a pivotal juncture where a substantial bullish price reversal is anticipated, potentially propelling it to new all-time highs or even surpassing them. It is imperative to exercise meticulous risk management and conduct your own thorough analysis before engaging in any cryptocurrency trading or investment activities.
Should the price indeed undergo a major correction, it is likely to decline to our second designated area, where it is anticipated to fill the liquidity gap and subsequently reverse course, continuing its trajectory towards our established targets.
Please consider this analysis as a secondary influence only, or even solely for educational purposes. It is crucial to conduct your own independent analysis and risk management prior to engaging in any cryptocurrency trading or investment endeavours, as they inherently carry substantial financial risks.
We extend our best wishes and encourage you to trade safely and responsibly.
Should you wish to demonstrate your support, you are welcome to express your appreciation through likes, comments, or sharing this information.
Thank you for your consideration.
Have a pleasant weekend.
Team Setupsfx_

Inverse Head and Shoulders on Ethereum: Short Opportunity ETH?I'm currently watching Ethereum , and things are starting to look interesting.
We’re seeing early signs of a potential break in structure to the downside, and I’m closely monitoring a bearish inverse head and shoulders pattern. On the 30-minute timeframe, I’m waiting for a clear break of market structure within the current range before considering a short entry.
Stop loss would be placed above the range, with the target outlined in the video.
This is not financial advice—please trade responsibly and always manage your risk.

