ETHUSDT.3L trade ideas

ETH - SHORT SET-UPBINANCE:ETHUSDT
Short Setup Summary (ETH/USDT Weekly):
Resistance Zone: $2,590–$2,720
View: Expect rejection from this zone
Target: $2,150
Stop-loss: Above $2,914
Setup Type: Supply zone rejection (bearish setup)
Confirmation: Watch for reversal candles in the zone

ETHEREUM for $750?In this chart, I am showing you the worst possible scenario. If we compare this cycle to the past, we see some very similar things on the weekly chart:
- Weekly RSI divergence
- Testing the 50-level RSI and the trend line from the bottom to the top
- Correction to the 0.5 fibbonacci level.
- Last time we had a war between Ukraine and Russia and now we have a war between Israel and Iran
- Last time everyone on X(twitter) was talking and cheering about Alt-Seoson and ToTheMoon and now we have the same situation, DYOR, check X
$750-800 for Ethereum are the lows of the two global channels. So it's a logical bottom. And after the price reaches the bottom, we can reach the top of the channel.
Hence after this mega-dump we will see #ETH at $18000-20000.
What do you think about this scenario?

Ethereum (ETH): Attentions at 200EMA | Targeting Local HighEthereum is back near EMAs after a nasty drop we had recently due to news we had. Now it is basically the waiting game, where we just wait for confirmations of either a breakout from here or a rejection and movement back to lower zones.
We are looking more for the breakout scenario just based on the buyside volume we had recently, which showed the dominance of buyers!
Swallow Academy

MACD Divergence Flashing Red, Could This Trigger a -30% Crash?Hey Realistic Traders!
Bearish Reversal Signal Flashing on BINANCE:ETHUSDT , Is the Bull Run Over?
Let’s Break It Down..
On the daily timeframe, Solana (SOL) has formed an ascending broadening wedge, which has now broken to the downside through both the lower trendline and a major support zone, indicating a shift in market structure.
Price action has also remained consistently below the 200-day EMA, signaling a potential transition from a bullish to a bearish trend.
A bearish divergence has appeared on the MACD indicator, where price makes higher highs while the MACD forms lower highs. This divergence indicates that buying momentum is weakening, even as the price pushes higher. Such a pattern often precedes a trend reversal and supports the expectation that the price may continue to move lower.
Given these technical signals, the price is likely to continue moving lower toward the first target at 1849.07, with a possible extension to the second target at 1534.44.
This bearish outlook remains valid as long as the price stays below the stop-loss level, currently marked at 2734.40. A move above this level would invalidate the bearish setup.
Support the channel by engaging with the content, using the rocket button, and sharing your opinions in the comments below.
Disclaimer: "Please note that this analysis is solely for educational purposes and should not be considered a recommendation to take a long or short position on ETHUSDT.

ETH TRADE IDEA 23 06 25If price retest this FVG, we could look for a long position
That equal highs are dangerous right now, but we could expect to form a BKR
Maybe a Futures Grid could be a great idea

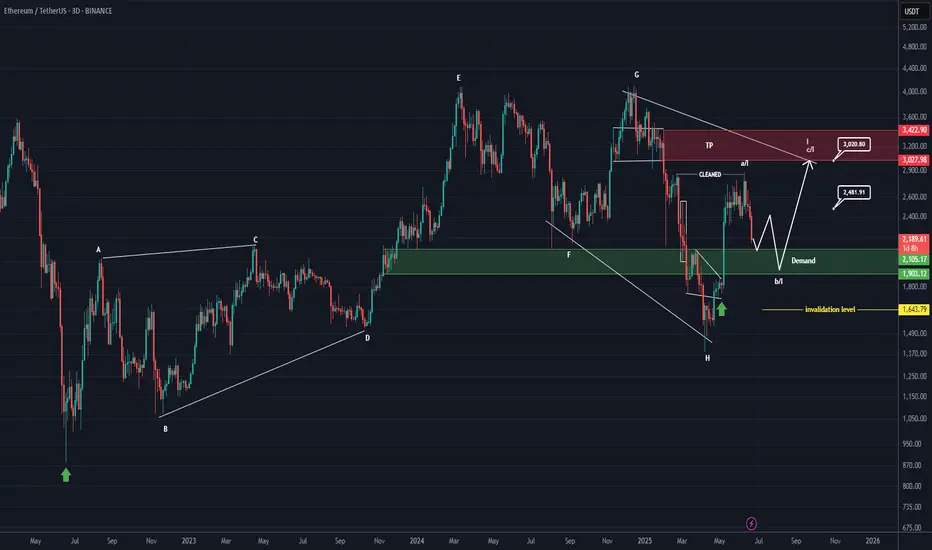
ETHEREUM Analysis (3D)First of all, pay close attention to the timeframe | it's a higher timeframe.
From the point where we placed the green arrow on the chart, Ethereum appears to have entered a bullish phase | specifically, a symmetrical pattern.
It currently seems to be in wave I of this symmetrical structure, which is the final wave. Wave I itself appears to be composed of three parts (ABC). At the moment, Ethereum seems to be in wave b of wave I.
We expect wave b of I to complete within the green zone, after which the price would move into wave c of I.
The price seems inclined to complete wave b of I near the bottom of the green zone.
Targets are marked on the chart.
In the green zone, it’s no longer reasonable to look for Sell/Short positions, especially when the price is approaching the bottom of the green area.
A weekly candle close below the green zone would invalidate this analysis.
For risk management, please don't forget stop loss and capital management
When we reach the first target, save some profit and then change the stop to entry
Comment if you have any questions
Thank You

ETH Eyes FVG Fill — Buy Dips Toward Confluence Support✅ Multiple confluences: 1h MSS, range lows, FVG, and OB cluster at $2,273–$2,319
✅ High probability of FVG ($2,529) being filled before new lows
⚠️ Downside sweeps are buys, not sells — use zone for bids
Active Setup:
Long Entry: Bids in $2,273–$2,319 zone (on confirmation: SFP/reclaim or strong bounce)
Targets: First TP at FVG ($2,529), next at range high ($2,787)
Stop: Below $2,185 (invalidate on close below sweep low)
🔔 Triggers & Confirmations:
Only enter on strong reversal/bounce in blue box
No FOMO above FVG, wait for clean setup
🚨 Risk Warning:
Avoid chasing into resistance (FVG), wait for dip entries with confirmation

ETHEREUM $1800 IMMINENT – Accumulation nearing completionTraders,
Ethereum is currently forming a textbook example of multi-timeframe accumulation. We’re observing two overlapping accumulation ranges — one on the macro and one on the intraday structure.
In both cases, price has formed two significant lows. A third sweep toward the $1800 zone would complete the pattern and align with the principle of engineered liquidity traps before expansion.
This $1800 level isn't random — it’s where:
- Prior stop runs occurred
- Buyer interest is likely to step in again
- The lower boundary of the range aligns with previous demand
If this level holds, the next logical target sits at $2258, where external liquidity rests above recent highs. The path of least resistance is up once that low is set.
This setup offers high R/R for positional longs, especially if confirmed with absorption or bullish delta response at the $1800 level.
Don’t rush in — but be prepared.
The reaction around $1800 will tell the story.

ETH Distribution pt.2It seems like the distribution model i was watching is about to get finished. I will wait for more confirmations in case it wants to go higher or deviate one more time.

ETHUSDT Short Setup from Local Resistance and Rising ChannelETHUSDT has reached a key local resistance zone at $2,562.00, which aligns with the upper boundary of a rising channel. This area has historically acted as dynamic resistance, and price action is showing signs of stalling after a strong upward move.
A short position is taken at $2,562.00, anticipating a move down to the lower channel support near $2,337.16.
This setup leverages both horizontal and diagonal resistance, ideal for traders looking for a mean reversion setup within a rising structure.
🧩 Trade Parameters :
- Entry: $2,562.00
- Stop Loss: $2,636.73
- Take Profit: $2,337.16
🔢 Risk:Reward Calculation:
- Risk: 2,636.73 - 2,562.00 = $74.73
- Reward: 2,562.00 - 2,337.16 = $224.84
- Risk:Reward Ratio: 1 : 3.01 ✅ (Very favorable)
✅ Bias:
- Bearish rejection from channel top and prior resistance
🔄 Confirmation:
- Look for rejection wicks, bearish engulfing patterns, or a break of lower timeframe support levels
❌ Invalidation:
- Strong breakout and hold above $2,636.73
This is a high-RR short setup with clear structure and invalidation — well-suited for traders aiming for precision entries on rejection zones.

"ETH Bullish Heist: MA Breakout Confirmed! Next Stop 3600?"🔷🔹 "THE ETH HEIST: MASTERPLAN TO LOOT 3600!" 🚨💰 (Breakout + Pullback Strategy)
🌟 Yo, Fellow Market Robbers! 🌟 (Hola! Bonjour! Salaam!)
Listen up, Money Makers & Thieves! 🏴☠️💸
Based on the 🔥Thief Trading Style🔥, we’re about to pull off the ultimate ETH/USDT heist—Ethereum vs Tether is our target!
🔪 THE TRADE SETUP (LONG HEIST)
🎯 Entry Signal:
"The heist begins at MA Breakout (2900)! Wait for confirmation, then strike like a pro thief!"
Option 1: Buy Stop above MA (2900) for breakout momentum.
Option 2: Buy Limit on pullbacks (15-30min TF) for sneaky low-risk entries.
📌 ALERT! Set a breakout alarm—don’t miss the robbery!
🛑 Stop Loss (Thief’s Escape Route):
"Yo! If you’re entering on breakout, DO NOT set SL before it triggers! Place it at the nearest swing low (12H TF)—or risk getting caught by the bears! 🐻🔪"
🎯 Profit Target: 3600 (OR Escape Early!)
Scalpers: Only long scalps allowed! Use trailing SL to lock profits.
Swing Thieves: Ride the wave but exit before the cops (bears) arrive!
⚡ WHY THIS HEIST WILL WORK:
Bullish momentum + MA Breakout = Easy Loot!
Overbought? Trap? Reversal? Nah—we escape before the danger zone! (Yellow ATR = High Risk)
📢 THIEF’S WARNING:
🚨 News Alerts = Market Chaos!
Avoid new trades during high-impact news.
Trailing SL = Your Best Friend.
💥 BOOST THIS HEIST!
👉 Hit 👍 LIKE & 🔔 FOLLOW to strengthen our robbery squad! More heists = More profits! 🚀💰
Stay tuned, thieves… Next heist coming soon! 🏴☠️🔥

DeGRAM | ETHUSD rebound from the support line📊 Technical Analysis
● Bounce off the purple up-trend and 2 320 support printed a bullish engulfing, maintaining the sequence of higher-lows that has guided price since April.
● Price is squeezing into an ascending triangle under 2 700-2 730, where the former wedge cap meets horizontal supply; a break projects to the 3 040 macro fib / channel roof.
💡 Fundamental Analysis
● Net-staking deposits keep rising while, per FXStreet (25 Jun), whales add ETH ahead of the SEC’s spot-ETF S-1 verdict, underpinning demand.
✨ Summary
Long >2 320; triangle breakout above 2 730 targets 3 040. Thesis void on a 16 h close below 2 200.
-------------------
Share your opinion in the comments and support the idea with like. Thanks for your support!

Ethereum:Daily signalhello guys👋
According to the drop we had, you can see that buyers came in and the price had a good growth, and after that a trading range was made in which the price got stuck.
Now, considering that the price is in the trading range and it seems that the buyers have shown their support, it is possible to step into the specified support areas with risk and capital management and move up to the set goals.
🔥Follow us for more signals🔥
*Trade safely with us*


Important midweek ETH update.In just four days, ETH has impressively climbed 19.37%, achieving a substantial trading volume of 34.9 million, indicative of both renewed interest and heightened speculative activity. This sharp move follows two intensely impulsive trading days that thrust price upwards aggressively, followed immediately by two days of intermittent volatility and macro consolidation—perfectly manifesting the anticipated Bart Simpson pattern previously identified and traded with clinical precision.
Our initial boundary of the macro distribution zone at 2470 marked a critical juncture. ETH faced vehement rejection here, forming a violent wick as price sharply retraced, providing us with the ideal entry for our hedge short. This level—keenly highlighted in prior analyses—initiated a cascade of rapid selling pressure, driving price down with impressive velocity and ferocity directly into the pre-established supply zone. This pullback validated our short, subsequently propelling price downward into demand territory at approximately 2380, where immediate liquidity absorption occurred, confirming demand strength.
Notably, ETH’s rapid recovery during the early Asian session surged back towards the optimal trade entry (OTE) region of the redistribution zone, affirming both market efficiency and the dynamic liquidity interplay present. This cyclical behavior reinforces the significance of clearly defined supply and demand zones, which have acted as robust reference points throughout this trading period.
At this juncture, ETH finds itself at a critical crossroad—a profound decision point characterized by considerable uncertainty. Three distinct scenarios now dominate trader psychology and technical rationale:
Liquidity Hunt Scenario: ETH could swiftly retrace to retest the mean, specifically targeting liquidity pools located near the spring wick from the latest impulse. Such a move would serve to shake out weak longs and solidify the market structure before another upward thrust.
Continuation Scenario: A bullish advance could propel ETH towards testing the upper boundary of the overarching macro symmetrical triangle, aligning with continued momentum and suggesting further bullish intent supported by current oscillatory readings.
Worst-Case Scenario (LL Scenario): The alternative, more extreme scenario involves ETH breaching structural integrity, aggressively flushing out late entrants with a sharp lower low (LL). While perceived as unlikely given recent volume and market resilience, this outcome cannot be discounted—particularly given global macroeconomic uncertainty and geopolitical tensions.
Several exogenous factors compound this uncertainty, most notably ongoing international conflicts and recent market sensitivities tied to off-the-cuff comments from influential figures such as former President Donald Trump. These events amplify volatility potential, exerting tangible influence upon investor sentiment and market positioning.
Analyzing the market structurally, ETH price action is now interacting directly at the apex of the current triangle structure, precisely aligning with the 50% Fibonacci retracement of the recent range—a pivotal area frequently respected by both algorithmic and discretionary traders. Complementing this technical view, oscillators such as the Relative Strength Index (RSI) currently hold a neutral stance at exactly 50%, highlighting equilibrium in buying and selling pressure and reinforcing the indecisive nature of the current market environment.
However, adding weight to bullish sentiment in the near term, the Commodity Channel Index (CCI) presently indicates upward momentum, suggesting possible further upside if sustained during today's London and subsequent New York sessions. Consequently, immediate trading decisions should remain sensitive to intraday price behavior around these critical junctures.
If you've closely tracked my analyses—especially the detailed insights shared in the recent macro Bart Simpson formation update—you'll likely have secured the short precisely at the 2503 rejection point, efficiently hedging against any potential drawdown from open long positions established lower down. This strategy exemplifies disciplined trading, strategically balancing risk and reward, capitalizing on clearly defined market structures and critical levels.
Summarizing the current state of play with utmost clarity, ETH stands delicately poised between bullish confirmation and bearish capitulation. Intraday sessions in the coming hours, notably London open and subsequently New York open, are expected to provide the decisive directional impulse. Traders should actively monitor price response at these critical levels, maintaining protective hedges where necessary while remaining flexible and adaptive to emerging market dynamics.
In conclusion, ETH’s immediate trajectory hinges upon nuanced market reactions at this strategically significant confluence point. Stay vigilant, as ETH approaches a potentially transformative decision—one offering both substantial opportunity and considerable risk, contingent upon disciplined execution and strategic clarity in your trading approach.

ETHEREUM → Rally and liquidity capture. Up or down?BINANCE:ETHUSDT.P is strengthening following Bitcoin. This is a reaction to developments in the Middle East, namely Trump's comments on peace. But there are doubts...
The crypto market is reacting to the situation in the Middle East, namely Trump's statements about peace. But apart from him, no one else is talking about peace. No agreements have been reached, so the level of risk is quite high.
Another nuance hinting at the general mood in the market: 66% of the largest traders on Hyperliquid are currently shorting crypto — Cointelegraph
ETH, technically, has stopped in the trend resistance zone as part of a local rally in the Pacific session.
If there is not enough potential to break through the trend resistance and the price forms a false breakout of 2390, the local trend may continue
Resistance levels: 2433, 2475
Support levels: 2390, 2313
The inability to continue growth will confirm the fact of bearish pressure (market distrust of the bullish momentum). The past momentum, in hindsight, can be considered manipulation (liquidity capture). Consolidation below 2390 may trigger a decline.
Best regards, R. Linda!

ETH: Short 23/06/25Trade Direction:
ETH Short
Risk Management:
- 0.5% risk allocation
Reason for Entry:
- Tagged and rejected from Daily FVG
- Market sentiment remains bearish across macro and crypto
- News flow is strongly risk-off. Qatar has closed flights, UK and US citizens issued shelter in place warnings aswell
- Heightened geopolitical risk from possible Iranian escalation, with largest US base in the region
- 0.718 rejection

Ethereum (ETH): Buyers Taking Back Control!Ethereum had a nasty fall both on Sunday and Saturday where price dipped from $2500 to $2100.
Despite that movement took place during the weekends it was harsh one and we are expecting osme kidn of re-test to happen towards the local broken area (near 200EMA).
Swallow Academy

ETH Long.As we can see on the weekly timeframe, ETH made a breakdown after which it consolidated for a while and then made a false breakdown of the zone, now showing a reversal. One can plan to take the long position at the target of the higher trendline.

ETH/USD Weekly | The Full Breakdown – Structure, Spring, and Set
This is my full Ethereum weekly chart analysis — not just what I think might happen, but a walk-through of everything I’ve mapped and labelled, based on how price has behaved since the 2021 top.
Every structure you see here is there for a reason — from the symmetrical triangle and wedge, to the Wyckoff schematics, Elliott wave flow, Spring, and more. What we’re seeing now, in my opinion, is the end of a three-year macro compression. The move that follows could define the rest of this cycle.
Let me take you through it.
After the all-time high in late 2021, Ethereum entered a structured, controlled decline. Not a crash — but a step-by-step transition through market phases. Price dropped and bottomed into a clear accumulation phase — that’s the first box on this chart, labelled as “Accumulation (cause)”. This is where smart money started taking positions, confirmed by the Spring down to 0 and the base of the move at point 2. From there, price consolidated, gained strength, and then jumped the creek — a clear breakout above the accumulation range, which gave us the confirmation for markup.
The markup phase took us from that Spring up into a five-wave impulsive move, peaking around the distribution zone. You can see it clearly — labelled Distribution, and boxed off between points A, B, C and the final wave 5. This rally failed to make new all-time highs, stalled, and was rejected cleanly. From there, we rolled over and started losing structure — and this is where it gets important.
Right after distribution, we got a breakdown I’ve labelled “Break The Ice”. This wasn’t just another dip. It was the moment we lost all structure from the markup — the line that had held the previous lows snapped, and volume stepped in. This is often the first real signal that we’ve entered the markdown phase. From a Wyckoff perspective, this breakdown is what separates Phase D from the start of a new accumulation cycle. It’s aggressive, deliberate, and clears out late longs — and that’s exactly what it did here.
Following that breakdown, we formed a new falling wedge — drawn from the top of the markdown all the way to the most recent lows. Price was making lower highs and lower lows, but with less aggression and momentum weakening. This wedge sits inside the larger symmetrical triangle, which has been developing ever since the 2021 top. The apex of this triangle, marked around $2,496, is where I believe everything will come to a head. Break that with conviction — and we could start a whole new macro leg.
But before we get there, something happened worth pointing out. That final breakdown inside the wedge? The one that dipped below and quickly reclaimed? That, for me, was the Spring. It’s labelled in yellow as “Spring” under point D. And it matches the Wyckoff schematic almost perfectly. Volume dried up on the move down. RSI and CCI both showed divergence. Then price bounced hard, reclaimed structure, and we’ve held ever since. This doesn’t look like continuation — it looks like a trap.
If that Spring holds, then we’re now in the Sign of Strength (SOS) phase. This is the moment where price reclaims its mid-structure levels, consolidates, and prepares for the breakout. We haven’t broken out yet — but the groundwork is in place.
My Elliott count also lines up. We had a 5-wave impulse from the Spring to the failed rally, followed by an ABC correction. What we may now be seeing is the completion of another Wave 2, setting up for a possible Wave 3 — the strongest wave of the cycle, if confirmed.
Now let’s talk entries. I’ve got my eye on the $2,130–$2,030 region. That’s where I’m placing my DCA bids. It’s the area just above the Spring reclaim zone, where price should react again if we retest. If we lose $1,690, I consider the Spring invalidated and will reassess. That’s my clean risk level.
Break and hold above $2,496, and the breakout is confirmed. That level is not just the wedge and triangle resistance — it’s also the psychological midpoint of this whole macro structure.
Everything’s mapped. Structure is clean. Volume is drying up. Momentum is shifting. And price is compressing right into the apex.
This isn’t a moment to chase. It’s a moment to plan.
If we break out, I’m ready to scale in. If we reject, I’ll be watching the DCA zone and the Spring level closely. Either way, I know what I’m looking for — and I know what invalidates the setup.
Let’s see what price does next.

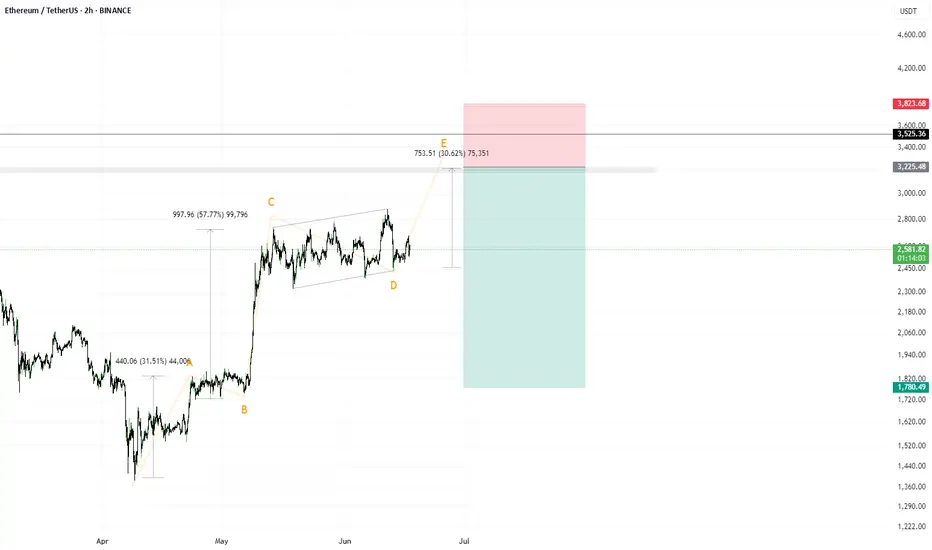
Short idea on $ETHJudging by the structure, if the vector is correctly identified, then on the ETH instrument, a rise to 3400–3600 remains relevant until the first serious correction (this idea would be invalidated in that case).
As for the potential trade — a breakout of the local highs amid global chaos and during the formation of wave 4 of a 5-wave structure. Typically, during the formation of wave 4, there is more media involvement, more noise, and panic.
I’m observing and planning to enter this trade.
Do not follow my vision blindly, as it could be detrimental to you.