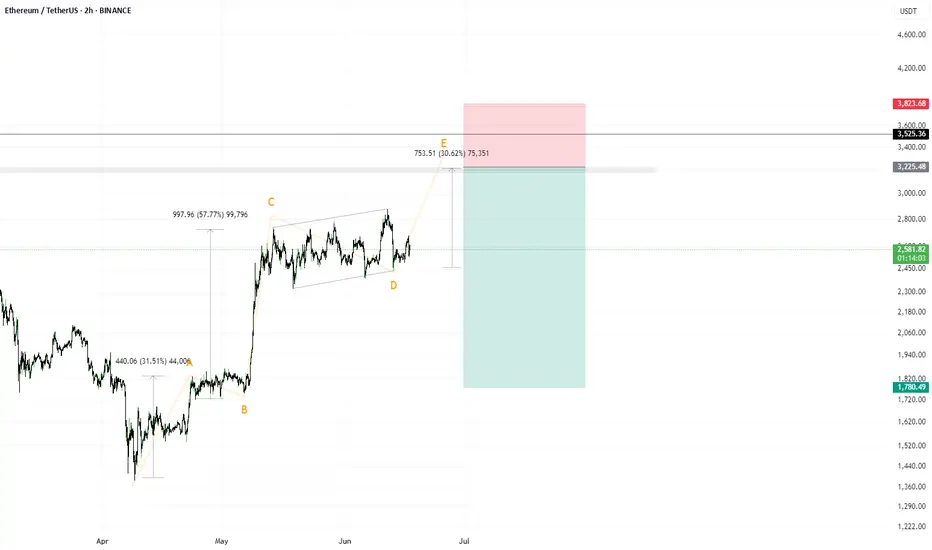
Short idea on $ETHJudging by the structure, if the vector is correctly identified, then on the ETH instrument, a rise to 3400–3600 remains relevant until the first serious correction (this idea would be invalidated in that case).
As for the potential trade — a breakout of the local highs amid global chaos and during the formation of wave 4 of a 5-wave structure. Typically, during the formation of wave 4, there is more media involvement, more noise, and panic.
I’m observing and planning to enter this trade.
Do not follow my vision blindly, as it could be detrimental to you.
ETHUSDT.3L trade ideas
ETH/USDT Bullish Reversal Analysis Chart Overview:
Ethereum (ETH) has shown a strong bullish reversal from the support zone near $2,200, forming a V-shaped recovery pattern. The price is currently trading around $2,450, with upward momentum targeting the next key resistance level.
📌 Key Technical Highlights:
✅ Support Zone:
Clearly respected at $2,200 – $2,300 range
Multiple candle wicks suggest strong buyer interest
✅ Resistance Zone:
Major resistance expected around $2,900
Historical rejection indicates potential selling pressure
✅ Target Level:
Short-term target marked at $2,610 🟣
If momentum sustains, price could push towards this zone before facing resistance
📈 Bullish Momentum:
Strong breakout from downtrend channel
Formation of higher highs and higher lows
Price action respecting upward trend structure
🛠 Pattern Structure:
Reversal pattern after corrective phase
Bullish engulfing candles suggest continuation
📊 Forecast Path:
Two potential scenarios are outlined:
📈 A clean push to the $2,610 target, followed by consolidation
🔄 A short pullback to $2,374 before continuation to the target
⚠️ Conclusion:
ETH/USDT is showing bullish signs with potential to reach $2,610. Watch for consolidation or pullbacks as buying opportunities, but be cautious of heavy resistance above $2,900. Ideal for short- to mid-term bullish setups

Ethereum (ETH): Lost Control Over 200EMA Ethereum has lost control over the 200EMA, where we had a strong sell-side movement due to the US news.
As this was the movement during the weekends, now we are looking for recovery to happen at least a couple of days from now on, which would mean that buyers will take back the control over the 200EMA.
This line will decide the next major trend area for the coin!
Swallow Academy

Ethereum – 1D timeframe overview with Initiative AnalysisHey traders and investors!
The price has reached the lower boundary of the range. There is no volume spike.
I expect a further decline toward 2184 and 2100. The 2100 level is a contextual area to look for buying patterns.
As part of a correction, the price could potentially drop to 1800. Monitoring.
This analysis is based on the Initiative Analysis concept (IA).
Wishing you profitable trades!

ETH/USDTI think it's time for Ethereum to grow and we should wait for higher targets from Ethereum. Tell me what you think.

Should i start panicking ?
Man, I really wish I didn’t look at this chart right before bed—this thing looks like it’s straight out of a horror movie.
From what I can tell, we’ve got a monthly bearish inverted FVG lining up perfectly with daily resistance. There’s also a broken trendline on the daily, and right after it snapped, we got that sharp V-shape move, which looks like a classic retest—either of the broken support or the trendline that flipped to resistance.
To add to the bearish vibes, there’s a pretty obvious divergence on the daily chart. That’s not exactly comforting.
Honestly, I’m struggling to find anything bullish here. The only tiny hope is that the price doesn’t break below that daily trendline (the one marked in blue). If it holds, maybe—just maybe—we can reclaim the broken main trendline and turn that resistance back into support.
If anyone out there is deep into crypto and has thoughts on how to approach this kind of setup, I’d really appreciate your take. Could use another perspective right about now.

Long trade
🟢 Trade Journal Entry – Buyside Trade
📍 Pair: ETHUSDT
📅 Date: Monday, June 23, 2025
🕒 Time: 8:00 AM (NY Session AM)
⏱ Time Frame: (Assumed 4Hr TF)
📈 Direction: Buyside
📊 Trade Breakdown:
Metric Value
Entry Price 2422.81
Profit Level 2474.60 (+2.14%)
Stop Loss 2415.04 (−4.08%)
Risk-Reward
Ratio 2.91 : 1
🧠 Context / Trade Notes:
NY Session AM Execution:
Trade entered at the start of the New York session, aiming to capture directional momentum amid strong ETH volatility.
Liquidity Sweep Confirmation:
Clear stop-hunt below prior swing low sets up the reversal conditions

False Breakdown on ETH – Bulls Back in Control?CRYPTOCAP:ETH just pulled a classic fakeout move — breaking below a key support and rising trendline, only to snap right back above it.
This false breakdown caught the bears off guard, and now price has reclaimed the support zone with strength.
As long as ETH holds above this reclaimed level, we could see a short-term push higher. Watch for follow-through, bulls need to keep the momentum alive.

ETHUSDTThis is very easy...
best support level 2300 to 2500 for jump price. but was needed for jump price for get enrgy for movement to high levels by fake breakout.
First level of resistance 2800 to 3000.
⚠️Control Money Management in your capital.

ETHUSDT minor trendsEthereum BINANCE:ETHUSDT is downtrend with lower highs from the bottom is nearly finished 📉 . For a stronger rise, it needs to stabilize above $2500 ⚡. Mid-term targets are $3300 (end of second leg) and $3700 (major resistance) 🎯. Key supports are $2500, $2070, $1800, and $1550, the base where the uptrend began 🛡️.
Supports & Resistances:
Supports: \$2500, \$2070, \$1800, \$1550
Resistances: \$2500 (critical level), \$3300, \$3700

Wait for ETHETH faced rejection at the weekly resistance near $2,700.
Price is likely to retest the current weekly support around the $2,100 zone.
Patience is key—wait for ETH to reach this support area before considering entry.
Disclaimer:
This analysis is based on my personnal views and is not a financial advice. Risk is under your control.

HolderStat┆ETHUSD formed the rising bottomBINANCE:ETHUSDT on the 16h chart is pressing upward inside a steep channel after reclaiming $2,300. Momentum is driving the price toward $2,800 and possibly $3,400. Previous breakouts from consolidation zones support the bullish bias.

[SeoVereign] ETHEREUM Bearish Outlook – June 27, 2025We are the SeoVereign Trading Team.
With sharp insight and precise analysis, we regularly share trading ideas on Bitcoin and other major assets—always guided by structure, sentiment, and momentum.
🔔 Follow us to never miss a market update.
🚀 Boosts provide strong motivation and drive to the SeoVereign team.
--------------------------------------------------------------------------------------------------------
Hello,
I would like to present a bearish outlook on Ethereum as of June 27, 2025.
In the most recent Bitcoin idea I shared on the 22nd, I explained the reason for setting the take-profit zone at 98,875 and mentioned the possibility of a short-term rebound. Amidst the ongoing war risks in the Middle East that are shaking the overall crypto market, the market has shown a successful rebound, with Bitcoin at the center of this movement.
However, this upward movement has been limited to Bitcoin alone, while other major altcoins have shown weak and sluggish rebounds. In such a situation, when predicting a future decline and considering short positions, I believe it is strategically more advantageous to target altcoins rather than Bitcoin. The inability to properly rebound suggests a momentum issue, which is likely to lead to relative weakness in the market.
Many investors tend to short Bitcoin simply because it has risen significantly in price, but this is a beginner-level mistake. Taking a short position solely based on a large price increase carries high risk, and it is more rational to base strategies on altcoins that are failing to gain upward momentum.
From this perspective, I was preparing the basis for a short position in this idea, and as a technical confirmation signal has appeared, I now present a short strategy for Ethereum. The first target is set around the 2,357 level.
If the movement unfolds, I will further explain the analytical thinking that made it possible to anticipate this decline, along with additional key points to monitor in the market.
Thank you.

ETH Bearish Retest – Heading to $900?Description:
On the weekly chart, ETH has once again failed to break back above the long-term ascending trendline that started in 2020. After losing this trendline support earlier, price is now treating it as resistance — a textbook bearish retest.
The market reaction suggests weakness, and the lack of strong volume on the upside raises concerns about buying momentum. If this structure holds, we might be looking at a broader correction in play.
📉 Key Observations:
• Bearish rejection from the multi-year trendline.
• Structure resembles a lower high formation.
• Weak volume on bounces, showing hesitation from bulls.
🔍 I’m personally watching the $1,000 zone as a potential magnet if downside pressure builds. Some may even expect a retest of the $900 range — not a prediction, just a scenario.
💬 What do you think? Are we headed for a deeper flush or is this just a trap before a breakout? Drop your thoughts ⬇️
#Ethereum #ETH #CryptoWeekly #TechnicalAnalysis #Trendline #BearishSetup

ETH NEW UPDATE (8H)This analysis is an update of the analysis you see in the "Related publications" section
After the pump and hitting the red zone, it got rejected.
It's better not to open a short position on Ethereum, as its dominance appears bullish | which means it might be resilient against a potential drop.
The closing of a daily candle above the invalidation level will invalidate this analysis.
For risk management, please don't forget stop loss and capital management
Comment if you have any questions
Thank You

Will ETH be able to return to the key level of $2,500?⚡️ Hello, everyone!
Over the weekend, Bitcoin and the entire market fell sharply due to geopolitical instability. ETH reached $2,120! And now it is trading at $2,440. However, as long as the price remains below the psychological level of $2,500, this is definitely a bearish signal.
❓ And the main question arises: will ETH be able to return to the $2,500 level and above, continuing its growth? Let's figure it out:
As I said in my previous review, ETH began to close the GAP from below at the levels of $2,470 - $1,855. However, there is also a GAP from above at the levels of $2,807 - $3,260. And after closing the current one, the next target will be this one. After all, as we know, 99% of GAPs close sooner or later.
📊 The price is in a flag pattern, and the first squeeze of the sloping support of the figure led to a price increase from $1,390 to $2,880 at its peak. However, the next test is unlikely to go so low, and therefore will not have the same effect. Therefore, the ETH price will likely continue to squeeze until it breaks one of the slopes, setting the direction.
⚙️ Metrics and indicators:
Money Flow - fresh liquidity has been flowing into ETH for almost a year now! Even despite the correction, the inflow has only been increasing since August 2024.
Liquidity Depth - as we know, the price moves from one liquidity zone to another. And now, there is significantly more liquidity concentrated at the top than at the bottom. This means that it is much easier to move the price up.
📌 Conclusion:
I'm not trying to say that ETH will skyrocket right now. But it's definitely not where it should be. And when it goes up, it will go up a lot, and we need to be ready for that.
I don't think we'll see levels of $1,500 and below again. But $1,800 at the end of summer or beginning of fall is quite realistic.
So be patient, we'll definitely get our chance!

Weekly trading plan for Ethereum BINANCE:ETHUSDT After the weekend, the price showed a solid recovery and is now attempting to break above the recent low at $2,436. If the breakout succeeds, we could see a move toward the marked resistance levels. Alternatively, we might get a local pullback before further upside. However, if the Pivot Point is broken to the downside, there’s a chance we’ll see a continuation of the bearish move
Write a comment with your coins & hit the like button and I will make an analysis for you
The author's opinion may differ from yours,
Consider your risks.
Wish you successful trades ! mura

ETHEREUM accumulated and ready to goOn a very negative news price is drop to POI of the dealer and well accumulated. We believe that next bullish move about to happen

ETH/USDT Bullish Reversal from Support Zone Chart Analysis:
The chart illustrates a range-bound consolidation with clear support around $2,381.45 and resistance near $2,556.54.
🔍 Key Observations:
✅ Multiple Support Tests: Price has tested the support zone several times (highlighted by orange circles) and respected it, indicating strong buying interest at the lower boundary.
📉 Fakeout and Recovery: A false breakout below support occurred, but the candle quickly reversed, signaling a bear trap and potential for bullish momentum.
🔼 Rejection Wick & Consolidation: A strong rejection wick on the most recent candlestick shows buyers defending the zone aggressively. The current price action shows consolidation — a bullish accumulation pattern.
🎯 Upside Target: Based on the range breakout projection, the price could potentially revisit the resistance zone at $2,556.54, marked as the TARGET on the chart.
📌 Technical Outlook:
🟢 Bias: Bullish as long as the price holds above $2,381.45.
💹 Entry Idea: Aggressive buyers may enter near current levels with a stop below the wick low.
🛑 Risk Level: Tight stop-loss needed as the structure relies heavily on support holding.
📈 Conclusion:
A classic range rebound setup is forming with potential for upside movement back toward resistance. A breakout above $2,556.54 could initiate a trend continuation rally

ETHAs seen on the ETH chart, after breaking the upward trend, it performs a retest on the downward trend and creates the second peak of the downtrend by taking liquidity. All the moving averages (7, 25, 50, 100, 200) have converged, reinforcing and supporting the trend.
We have 3 scenarios here:
Wait for a break of the downtrend and enter a trade with a reversal candle.
Wait for the moving averages to act as support.
Wait for support from the block order zone around the 500 level — this is the worst-case scenario.
If the first two scenarios happen together, it could push us significantly higher.
At this point, only short positions are advisable — but they must be adjusted according to risk.
Everything written here is based on the weekly chart. It is possible to trade on lower timeframes, but don’t forget — the overall trend is still down.

ETH/USDTPrice has entered a daily long FVG zone. For long setups to be valid, we’d like to see a short FVG inversion play out.
If no bullish reaction follows, the bias shifts to shorts — with potential downside targets in the $2000–$1800 range. Wait for confirmation before taking action.
Ethereum at PRZ: Bullish Setup _ Short termEthereum ( BINANCE:ETHUSDT ) reacted from the Potential Reversal Zone (PRZ) around the confluence of key Fibonacci levels , the Important Support line and 50_SMA(Daily) .
From an Elliott Wave point of view , we can identify a Expanding Flat (ABC/3-3-5) structure ending right above the Support zone ($2,474-2,437) .
The structure also hints at the formation of a new upward leg , potentially leading ETH toward the Resistance zone ($2,564-$2,524) and the upper line of the Ascending Channel .
I expect Ethereum to test the 38.2%($2,531=First Target) - 50%($2,561) Fibonacci retracement levels on the way to a potential retest of the previous swing highs .
Note: Stop Loss (SL) = $2,451= Worst Stop Loss(SL)
Please respect each other's ideas and express them politely if you agree or disagree.
Ethereum Analyze (ETHUSDT), 15-minute time frame.
Be sure to follow the updated ideas.
Do not forget to put a Stop loss for your positions (For every position you want to open).
Please follow your strategy and updates; this is just my Idea, and I will gladly see your ideas in this post.
Please do not forget the ✅' like '✅ button 🙏😊 & Share it with your friends; thanks, and Trade safe.

ETH - Do you Notice a Pattern here? I DO...Hello TradingView Family / Fellow Traders. This is Richard, also known as theSignalyst.
📈I find ETH 4h chart as it looks like history repeating itself.
Previously in 1 to 5 June, it formed a slight lower low before starting the next big bullish impulse leading towards the upper bound of the channel.
📚 Today, ETH just formed the slight lower low we are looking for.
Is it time for the next bullish impulse to start? well it will be confirmed after breaking above the last major high at $2,600.
What do you think?
📚 Always follow your trading plan regarding entry, risk management, and trade management.
Good luck!
All Strategies Are Good; If Managed Properly!
~Rich
