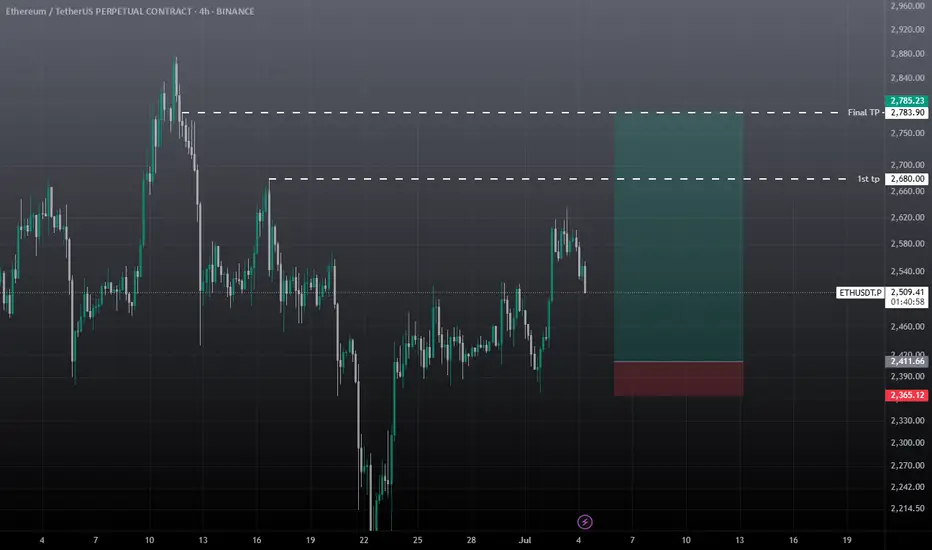
ETHEREUM accumulated and ready to goOn a very negative news price is drop to POI of the dealer and well accumulated. We believe that next bullish move about to happen
ETHUSDT.3L trade ideas

ETHAs seen on the ETH chart, after breaking the upward trend, it performs a retest on the downward trend and creates the second peak of the downtrend by taking liquidity. All the moving averages (7, 25, 50, 100, 200) have converged, reinforcing and supporting the trend.
We have 3 scenarios here:
Wait for a break of the downtrend and enter a trade with a reversal candle.
Wait for the moving averages to act as support.
Wait for support from the block order zone around the 500 level — this is the worst-case scenario.
If the first two scenarios happen together, it could push us significantly higher.
At this point, only short positions are advisable — but they must be adjusted according to risk.
Everything written here is based on the weekly chart. It is possible to trade on lower timeframes, but don’t forget — the overall trend is still down.

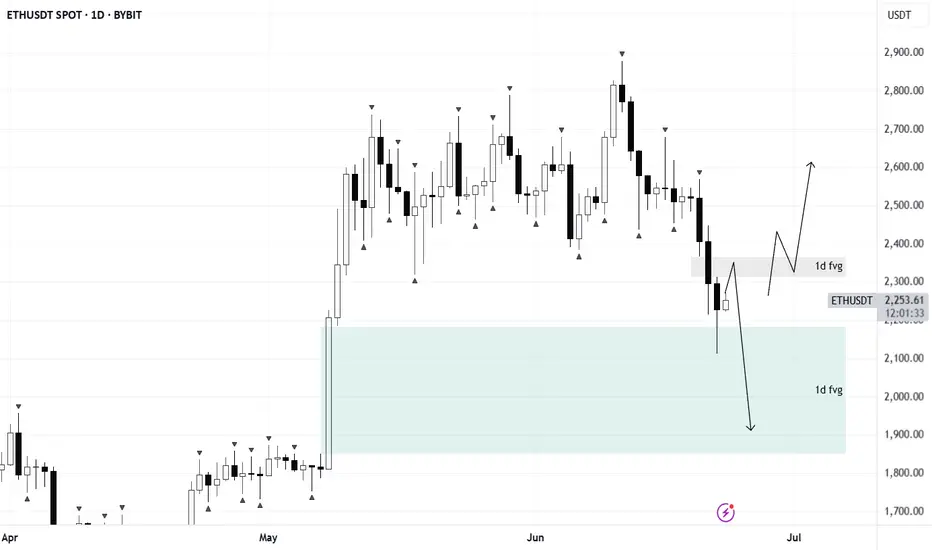
ETH/USDTPrice has entered a daily long FVG zone. For long setups to be valid, we’d like to see a short FVG inversion play out.
If no bullish reaction follows, the bias shifts to shorts — with potential downside targets in the $2000–$1800 range. Wait for confirmation before taking action.
Ethereum Price Reversal ? $2100 Support & Altcoin Season OutlookAfter an extended period of consolidation, Ethereum (ETH) has finally retested the critical support level of $2,100, which aligns closely with the 0.5 Fibonacci retracement level of the bullish trend that began in April. This confluence of technical factors strengthens the validity of this level as a strong demand zone.
The price action suggests that ETH may be gearing up for a bullish reversal, as it respects both horizontal support and key Fibonacci structure. Historically, the 0.5–0.618 retracement zone acts as a high-probability reversal area in trending markets, particularly when accompanied by volume stabilization and long-tailed candles on the daily chart.
Trade Plan: Spot and Futures Positions
Given the current structure, this presents a favorable opportunity to accumulate ETH on spot for the anticipated altcoin season. In addition, leveraged long positions in futures can be considered with clearly defined risk parameters.
Entry Zone: Around \$2,100
Stop Loss: \$2,000 (below key support)
Target Levels:
Primary Target: $2,500 (previous resistance / psychological level)
Secondary Target: $2,600 (major structure high)
The risk-to-reward ratio remains attractive, particularly if the broader crypto market continues its uptrend and Bitcoin maintains stability.
Market Context
Broader macro sentiment and the dominance cycle suggest capital rotation into altcoins could be near. With Ethereum leading major Layer 1s, a recovery from this level could catalyze a wider altcoin rally**, making this an important zone to watch for both intraday traders and swing investors.
⚠️ Note: Due to ongoing geopolitical tensions between Israel, Iran, and the United States, global financial markets—including crypto—may experience heightened volatility. Traders are advised to manage risk carefully and avoid overleveraging during uncertain macro conditions.

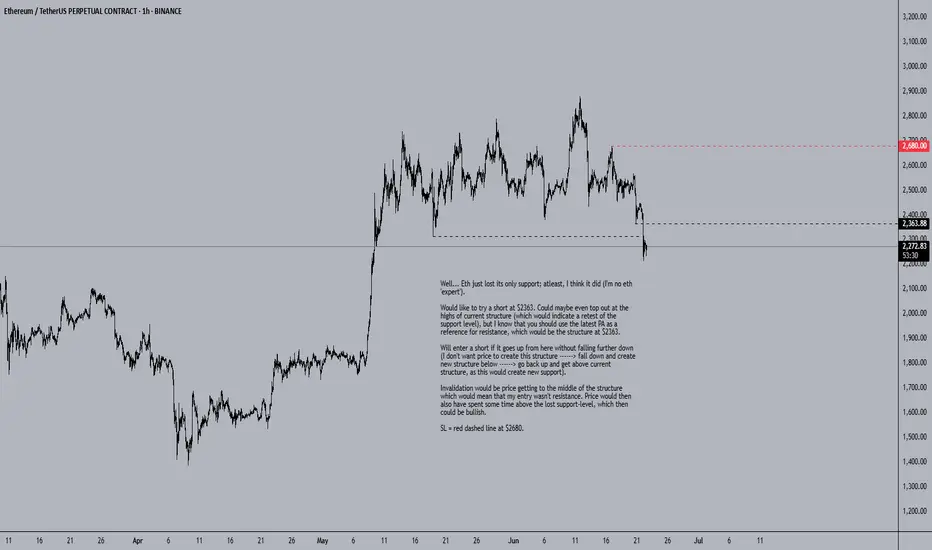
ETH Short SetupWell... Eth just lost its only support; atleast, I think it did (I'm no eth 'expert').
Would like to try a short at $2363. Could maybe even top out at the highs of current structure (which would indicate a retest of the support level), but I know that you should use the latest PA as a reference for resistance, which would be the structure at $2363.
Will enter a short if it goes up from here without falling further down (I don't want price to create this structure ------> fall down and create new structure below ------> go back up and get above current structure, as this would create new support).
Invalidation would be price getting to the middle of the structure which would mean that my entry wasn't resistance. Price would then also have spent some time above the lost support-level, which then could be bullish.
SL = red dashed line at $2680.
Still in the range(box of triangle)Keep an eye on candle pattern.
Especially, week candle.
( Hint🤫, No lower shadow(wick) usually makes price action. But there is high probability to make one more dip )

ETh more dump to $2100-$2030Just recently hopped into ETH short. Aiming for $2100 to $2030
Market is correcting on the weekly tf and this is a probably area that it might use to create the new HL for continuation back up.
Time sensitive.
Stop: $2235-$2245 area. $2245 is safer a bit lower RR though.

ETHUSDT UPDATE 1DETH slipped below channel support (~ 2.45k). Weekend volume is thin—need 2 daily closes (Mon/Tue) to confirm. Hold-below sets sights on 2.2–2.0k (Fib 61-78 %). Reclaim 2.5-2.6k invalidates.

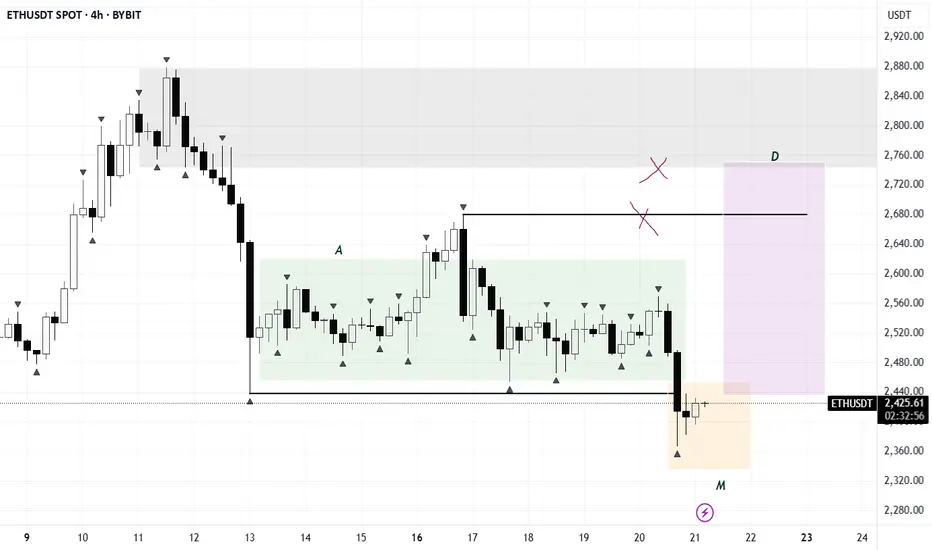
ETHUSDT – Trade Recap & Daily Bias for June 21Trade Recap (June 20):
I. First thing I did was mark out a DOL on the daily — price was hovering near a swing low, and I started noticing trend-side liquidity building up on the lower timeframes.
So my directional bias for today was short.
II. I marked the daily open.
III. With a short bias in mind, I waited for a Turtle Soup setup right above the daily open.
IV. The equal highs above were clean and obvious — textbook liquidity.
V. Once that liquidity was swept, I dropped to the M15 to watch how price reacted — waited for a clean displacement away from that zone before getting involved.
Daily Bias (June 21):
Still leaning short. We’re pretty close to a weekly FVG, which might act as a magnet.
If price forms liquidity during the day and takes it out in-session, I’ll look to short again.
Bread and Butter & Turtle Soup


ETH/USDT Bullish Reversal from Support Zone Chart Analysis:
The chart illustrates a range-bound consolidation with clear support around $2,381.45 and resistance near $2,556.54.
🔍 Key Observations:
✅ Multiple Support Tests: Price has tested the support zone several times (highlighted by orange circles) and respected it, indicating strong buying interest at the lower boundary.
📉 Fakeout and Recovery: A false breakout below support occurred, but the candle quickly reversed, signaling a bear trap and potential for bullish momentum.
🔼 Rejection Wick & Consolidation: A strong rejection wick on the most recent candlestick shows buyers defending the zone aggressively. The current price action shows consolidation — a bullish accumulation pattern.
🎯 Upside Target: Based on the range breakout projection, the price could potentially revisit the resistance zone at $2,556.54, marked as the TARGET on the chart.
📌 Technical Outlook:
🟢 Bias: Bullish as long as the price holds above $2,381.45.
💹 Entry Idea: Aggressive buyers may enter near current levels with a stop below the wick low.
🛑 Risk Level: Tight stop-loss needed as the structure relies heavily on support holding.
📈 Conclusion:
A classic range rebound setup is forming with potential for upside movement back toward resistance. A breakout above $2,556.54 could initiate a trend continuation rally

ETH READY TO GO 3000$ ???🔍 ETH/USDT Analysis – Daily Timeframe
ETH is currently trading at $2,427, holding above the key support zone around $2,370 - $2,390, which is aligned with the 100 EMA. This zone has acted as a strong accumulation area.
📈 Market Structure:
Price is consolidating inside a horizontal range. A confirmed breakout above the resistance zone ($2,650 - $2,700) could lead to a bullish continuation towards the major resistance at $2,861.
📊 Technical Outlook:
Trend: Sideways range (accumulation phase)
100 EMA: Acting as dynamic support
Breakout Potential: Bullish continuation expected on breakout and retest
📌 Trade Plan (Not Financial Advice):
Entry Idea: Break and close above $2,700 zone
Target: $2,861 and higher
Invalidation: Daily candle close below $2,370
ETH is building strength above its 100 EMA. A breakout from this range can trigger a fresh bullish leg.
🔁 Like & share your opinion! Always DYOR before trading.

ETH/USDTFollowing the consolidation phase, we’ve seen a clear manipulation move — the structure closely resembles an AMD setup. As long as the pattern holds, upside targets are in the $2700–$3000 range.
Wait for ETH to rebound to $2528-2542 and place a short order.Short
$2528~$2542
Take Profit
$2480, $2460
Stop Loss
$2555
If the price falls below $2510, do not chase short, wait for a rebound.

ethererum
how to play around crypto and win the day
every crypto traders needs to know the following before taken any action.
(1) US10Y
(2)DXY
(3) GREED AND FARE INDEX
(4) BTCMARKET CAP CHART FOR CAPITAL INFLOW AND OUTFLOW.
(5) US FED INTEREST RATE DECISION.
(6) BITCOIN DIRECTIONAL BIAS AND SEASON(BULL/BEAR)
#SHAVYFXHUB #BITCOIN #BTC #CryptoTrading #Ethereum #Solana #AVAX #BNB #CryptoEducation

ETHEREUM ETHUSDT is awaiting a directional bias .but at the moment it has to break a weekly supply roof and sustain the gains as buy confirmation.

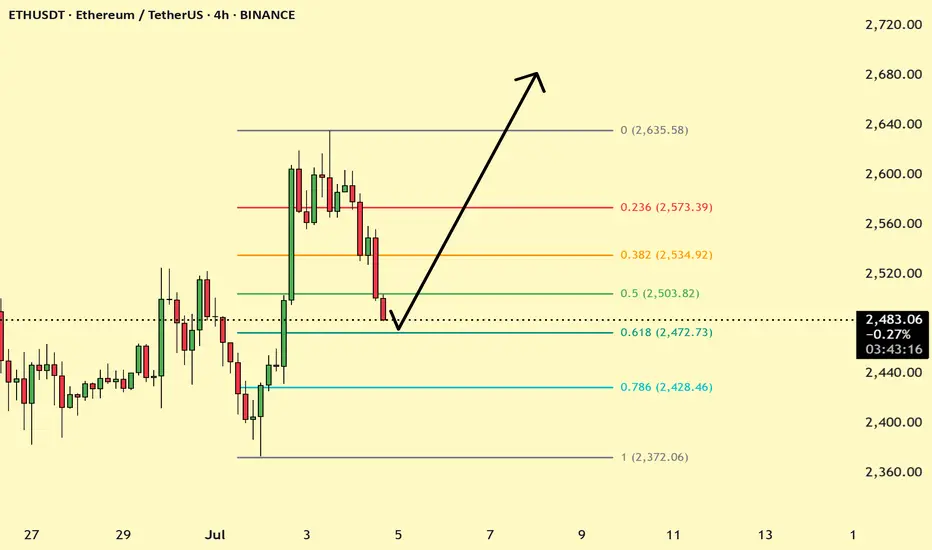
ETHUSD At 0.618 fib If holds can go 2680 ETHUSD recently in uptrend as par to correction the price has reached 0.618 Fib and price maty reverse if the bulls are Strong let us see....
ETH vs 200MA: Another TestETH on the daily has been pushed back so many times by the 200MA. Will price conquer it this time? I guess we’ll just have to wait and see.
Today is Friday, July 4th, so probably a long weekend for most traders. Somehow, price got pushed back again. Just a hunch, but I believe long traders are touching grass this weekend while sellers are grinding.
Anyway, we now have a support zone under price, made up of the 200MA and the 0.5 Fib — which, in theory, should hold against any attempts to push the price lower this weekend.
Always take profits and manage risk.
Interaction is welcome.

ETH SWING TRADEETH Showing strong momentum against BTC, July is also good for eth and some alts, maybe we see correction in Aug, September but before expected pullback towards 2.9k-3k. Must use SL as market is very Volatile these days.
HolderStat┆ETHUSD correctedKUCOIN:ETHUSDT is moving inside a rising wedge after reclaiming support near $2,500. Recent breakout from consolidation supports a continuation push toward $2,720–$2,760. The current trendline structure and bullish price action suggest upside potential.


HolderStat┆ETHUSD seeks to the $2750 levelBINANCE:ETHUSDT is holding above 2,350 and breaking out of consolidation within an expanding wedge. With structure pointing to bullish continuation, a move toward 2,800 is likely if this support level continues to hold.

80% win rate strategy with TiqGPTul 3, 2025 7:59 AM
1h1h Chart
15m15m Chart
5m5m Chart
1m1m Chart
Buy Opportunity
Bullish Setup
Buy: ** Buy limit order at $109,340.36 following a retest of the consolidation zone confirming continued buying interest.
Entry: $109,340.36
Strategies: Multi-timeframe bullish order flow analysis, liquidity targeting above current levels.
Confidence: Medium
Risk/Reward: Calculated as follows:
Timeframe: The 1-hour chart shows a strong bullish impulse followed by a consolidation phase, indicating a potential accumulation by institutions. The price is currently testing a minor consolidation zone around $109,340, which could act as a temporary resistance.
Disclaimer: The information provided by this app is for educational and informational purposes only and does not constitute financial advice. Always do your own research before making any trading decisions. TiqGPT is not a licensed financial advisor.
Mark as Successful
Mark as Failed
T
Jul 3, 2025 8:00 AM
MARKET NARRATIVE:
1H Timeframe: The 1-hour chart shows a strong bullish impulse followed by a consolidation phase, indicating a potential accumulation by institutions. The price is currently testing a minor consolidation zone around $109,340, which could act as a temporary resistance.
15M Timeframe: The 15-minute chart reveals more granularity within the bullish structure, showing a series of higher lows and higher highs. This is indicative of continued buying interest and a lack of significant selling pressure at these levels.
5M Timeframe: On the 5-minute chart, the bullish momentum is more pronounced with a clear impulsive move upwards. The recent pullbacks are shallow, suggesting that the market is not ready to reverse but rather is gathering strength for further upward movement.
1M Timeframe: The 1-minute chart provides a detailed view of the buying pressure. The price action is making higher highs and higher lows, confirming the bullish sentiment observed in higher timeframes.
INSTITUTIONAL THESIS:
Institutions appear to be in an accumulation phase, likely targeting higher liquidity zones above the current price level. The consistent higher highs and higher lows across timeframes suggest a coordinated effort to push prices upward, possibly aiming for a significant liquidity pool above the $110,000 mark.
LEARNING POINT:
"Multi-timeframe confluence of bullish order flow and shallow pullbacks indicating strong buying interest."
SIGNAL: BUY
SYMBOL: BTC/USDT ENTRY PRICE: $109,340.36 STOP LOSS: $109,000.00 (just below the recent minor consolidation zone on the 1H chart) TARGET PRICE: $110,000.00 (next psychological and liquidity-rich level) CONDITION: Buy limit order at $109,340.36 following a retest of the consolidation zone confirming continued buying interest. RATIONALE: The trade is based on the alignment of bullish signals across multiple timeframes, shallow pullbacks indicating strong buying interest, and the targeting of higher liquidity zones. STRATEGIES USED: Multi-timeframe bullish order flow analysis, liquidity targeting above current levels. URGENCY: MEDIUM TIMEFRAME: Short-term CONFIDENCE SCORE: 85% RISK/REWARD RATIO: Calculated as follows:
Risk: $109,340.36 - $109,000.00 = $340.36
Reward: $110,000.00 - $109,340.36 = $659.64
Ratio: $659.64 / $340.36 ≈ 1.94:1
FINAL RECOMMENDATION:
WAIT - Although the bullish setup is strong, the risk/reward ratio of approximately 1.94:1 does not meet the minimum requirement of 2:1. It is advisable to wait for a better entry point that offers a higher potential reward relative to the risk or for the market to provide a deeper pullback to improve the risk/reward ratio.
Jul 3, 2025 8:01 AM
1h1h Chart
15m15m Chart
5m5m Chart
1m1m Chart
Hold - Waiting for Setup
Wait for Confirmation
Wait: Immediate market order based on current momentum.
Entry: $155.85
Stop Loss: $152.00
Target: $160.00
Strategies: Multi-timeframe BOS confirmation, Institutional Accumulation Phase
Confidence: 90%
Risk/Reward: Risk=$3.85, Reward=$4.15, Ratio=1:1.1 (Below 2:1 minimum)
Timeframe: Short-term
Disclaimer: The information provided by this app is for educational and informational purposes only and does not constitute financial advice. Always do your own research before making any trading decisions. TiqGPT is not a licensed financial advisor.
Mark as Successful
Mark as Failed
T
Jul 3, 2025 8:01 AM
MARKET NARRATIVE: The analysis across the four timeframes (1h, 15m, 5m, 1m) for SOL/USDT shows a consistent upward trend with a series of higher highs and higher lows, indicating a strong bullish momentum. The price action on the 1-hour chart shows a clear break of structure (BOS) above previous highs around $152, suggesting institutional buying pressure. This BOS is confirmed across the 15-minute and 5-minute charts, where we see continued bullish candles without significant retracement, indicating a lack of selling interest and potential accumulation by institutions. The 1-minute chart provides a more granular view of the buying pressure, showing tight consolidations followed by upward thrusts, typical of institutional demand in lower timeframes.
INSTITUTIONAL THESIS: Institutions appear to be in an accumulation phase, targeting higher prices. The consistent demand and absence of deep pullbacks suggest a strategy to absorb sell orders and push prices higher, likely aiming for liquidity above recent highs.
LEARNING POINT: The observed price action across multiple timeframes demonstrates a classic accumulation phase with a strong bullish momentum, indicating that institutions are supporting the upward move.
SIGNAL: WAIT SYMBOL: SOL/USDT ENTRY PRICE: $155.85 STOP LOSS: $152.00 (just below the recent structural break) TARGET PRICE: $160.00 (next psychological round number and potential liquidity area) CONDITION: Immediate market order based on current momentum. RATIONALE: Calculated risk/reward ratio of 1:1.1 (Risk=$3.85, Reward=$4.15) does not meet minimum 2:1 requirement. Waiting for better institutional setup with improved risk parameters. STRATEGIES USED: Multi-timeframe BOS confirmation, Institutional Accumulation Phase URGENCY: HIGH TIMEFRAME: Short-term CONFIDENCE SCORE: 90% (based on strong bullish signals across all observed timeframes) RISK/REWARD RATIO: Risk=$3.85, Reward=$4.15, Ratio=1:1.1 (Below 2:1 minimum)
RISK/REWARD CALCULATION: Risk = Entry Price - Stop Loss = $155.85 - $152.00 = $3.85 Reward = Target Price - Entry Price = $160.00 - $155.85 = $4.15 Ratio = Reward ÷ Risk = $4.15 ÷ $3.85 ≈ 1.08
Given that the calculated risk/reward ratio is less than 2:1, the recommendation is to WAIT for a better entry point or a more favorable risk/reward setup. The current market conditions are bullish, but the trade does not meet the strict institutional criteria for a minimum 2:1 risk/reward ratio.
Jul 3, 2025 8:04 AM
1h1h Chart
15m15m Chart
5m5m Chart
1m1m Chart
Buy Opportunity
Bullish Setup
Buy: Buy limit order at current market price with confirmation of continued buying pressure and no break of recent higher lows.
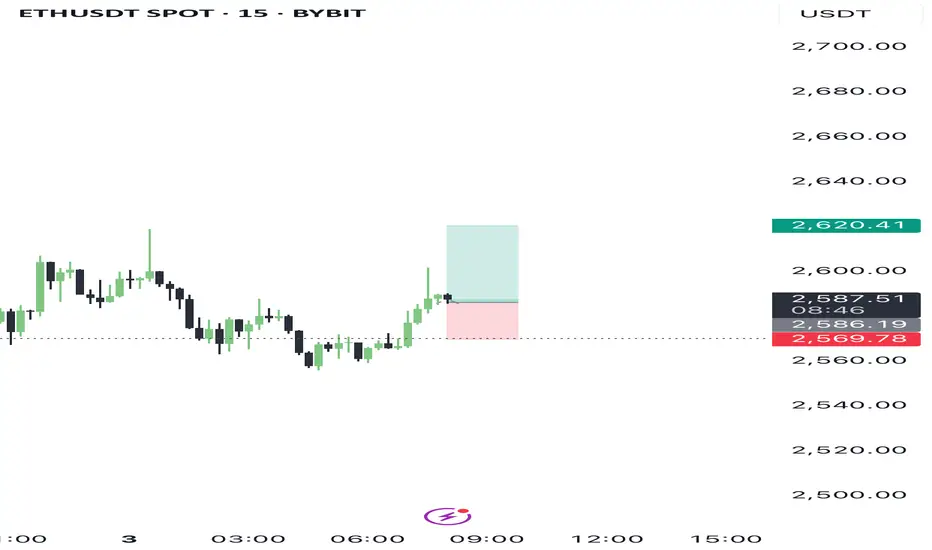
Entry: $2586.00
Stop Loss: $2570.00
Target: $2620.00
Confidence: 85%
Risk/Reward: Risk=$16.00, Reward=$34.00, Ratio=1:2.1
Timeframe: Short-term
Disclaimer: The information provided by this app is for educational and informational purposes only and does not constitute financial advice. Always do your own research before making any trading decisions. TiqGPT is not a licensed financial advisor.
Mark as Successful
Mark as Failed
T
Jul 3, 2025 8:04 AM
MARKET NARRATIVE:
Analyzing the ETHUSD pair across multiple timeframes (1H, 15M, 5M, 1M), we observe a consistent pattern of upward momentum followed by consolidation, suggesting a phase of accumulation and potential preparation for a further upward move. The 1H chart shows a strong impulsive move followed by a tight consolidation, indicating strong buying interest and limited selling pressure. The 15M and 5M charts display similar characteristics with price making higher lows, a sign of sustained buying pressure. The 1M chart, while more granular, shows some pullback, which could be interpreted as a liquidity hunt within a bullish structure.
INSTITUTIONAL THESIS:
Institutions appear to be in an accumulation phase, using smaller timeframes to engineer liquidity sweeps (collecting stop losses below minor swing lows) before potentially driving the price higher. The consistent higher lows across timeframes support this thesis, suggesting an underlying strength in buying pressure.
LEARNING POINT:
The current setup exemplifies "Institutional Accumulation with Liquidity Sweeps" where smart money uses minor pullbacks to gather more positions favorably, anticipating a continuation of the trend.
SIGNAL: BUY
SYMBOL: ETHUSD
ENTRY PRICE: $2586.00
STOP LOSS: $2570.00
TARGET PRICE: $2620.00
CONDITION: Buy limit order at current market price with confirmation of continued buying pressure and no break of recent higher lows.
RATIONALE:
Market Structure: Higher lows on 15M and 5M charts indicate sustained buying interest.
Order Flow: Accumulation evident from tight consolidations and quick recoveries from dips.
Liquidity: Recent pullbacks likely served as liquidity hunts, setting the stage for a potential upward continuation.
Strategies Used: Multi-timeframe analysis confirms institutional buying pressure and accumulation phase.