ETH 50MA Reclaims 0.5 FibInteresting take on ETH daily using just the 50MA and Fib levels.
Notice how the 50MA has interacted with the Fib levels since June 2021.
In May 2025, the 50MA crossed below the 0.618 Fib level, marking the bottom of the December 2024 drop.
The 0.5 Fib acted as support in October 2024 during the double top formation at the 0.236 Fib.
Now, the 50MA has crossed back above the 0.5 Fib.
As long as price holds above this 0.5 Fib level, the odds of further upside remain stronger.
Always take profits and manage risk.
Interaction is welcome.
ETHUSDT.3L trade ideas

ETH ANALYSIS🔮 #ETH Analysis 🚀🚀
💲💲 #ETH is trading between support and resistance area. There is a potential rejection again from its resistance zone and pullback from support zone. If #ETH closes above 2500$ then we would see a bullish move
💸Current Price -- $2,462
⁉️ What to do?
- We have marked crucial levels in the chart . We can trade according to the chart and make some profits. 🚀💸
#ETH #Cryptocurrency #DYOR


ETH | H12 Supply Rejection & Demand Bounce PlanSELL ZONE $2,520–2,560
→ Short from supply, rejection expected
Triple tap + SFP = short trigger
↓
EQ LOWS $2,380–2,400
→ TP1 / watch for bounce
↓
BUY ZONE $2,280–2,320
→ Main long zone, enter on confirmation (bullish candle/SFP)
STOP below $2,250 = cancel idea
↑
TP1 $2,500
TP2 $2,900–3,000 (if strong bounce)
Main scenario — short from supply zone, target demand at $2,280–2,320. Long only if bounce is strong. Stop below $2,250. No confirmation — no trade.


ethusdt no trade zoneETH is stuck in a range, wait for the sweep of range high, then closing below the range high and take the short, target weekly low. 2nd scenario is wait for to take out the weekly low and any daily candle closing failed to close below this level take the long entry and target the range high. Otherwise expecting this week choppy mean sideways. no major move. Will update if found any good trade.

2/6/17 BIG SHORT ETH MEGA DUMPI expect the strongest fall in bitcoin and ether, so I take such a trade with a profit risk ratio of 1k12 as part of a classic pattern stop over the 3 top

Technical Analysis of the Financial Chart
1. Main Trend
The overall trend for the ETH/USDT chart (30-minute timeframe) appears bullish, confirmed by the recent breakout above the $2,480 resistance level and price maintaining above the moving averages (MA 50 and MA 200).
The latest upward momentum pushed the price to around $2,510, but the current candlestick seems to be consolidating at this level.
2. Key Levels
Resistance:
$2,543 (next critical level).
Support:
$2,480 (previous resistance, now acting as a key support zone).
$2,461 (aligned with the MA 50 and prior consolidation).
Breakout: A breakout above $2,480 has occurred. The bullish trend is likely to continue as long as the price remains above this level.
3. Technical Indicators
RSI (Relative Strength Index):
Currently around 63, indicating positive momentum but not yet overbought (70+), suggesting more upside potential.
MACD:
Both the MACD and Signal lines are above 0 with a recent bullish crossover. However, the lines are converging, pointing to potential consolidation.
Moving Averages (MA 50 & MA 200):
The price is trading well above both moving averages, reinforcing the bullish outlook.
4. Risk/Opportunity
Entry Point: Long above $2,505 (continuation of the bullish trend).
Stop-loss: $2,470 (below the breakout level and MA 50 to reduce risk).
Take-profit:
Level 1: $2,543 (first visible resistance).
Level 2: $2,570 (potential extension of the trend).
Confidence Level: High (given the strong breakout and supporting technical indicators).
Recommendation
Trading Setup:
Asset: ETH/USDT
Direction: Long
Entry: $2,505
Stop-loss: $2,470
Take-profit:
Level 1: $2,543
Level 2: $2,570
Confidence: High
Additional Notes:
Monitor volatility and volume: A drop in volume may signal weakening momentum.
Bollinger Bands indicate possible tightening after the breakout, suggesting consolidation.
🏦 Conclusion: The current setup supports a bullish continuation strategy with a favorable risk/reward ratio.

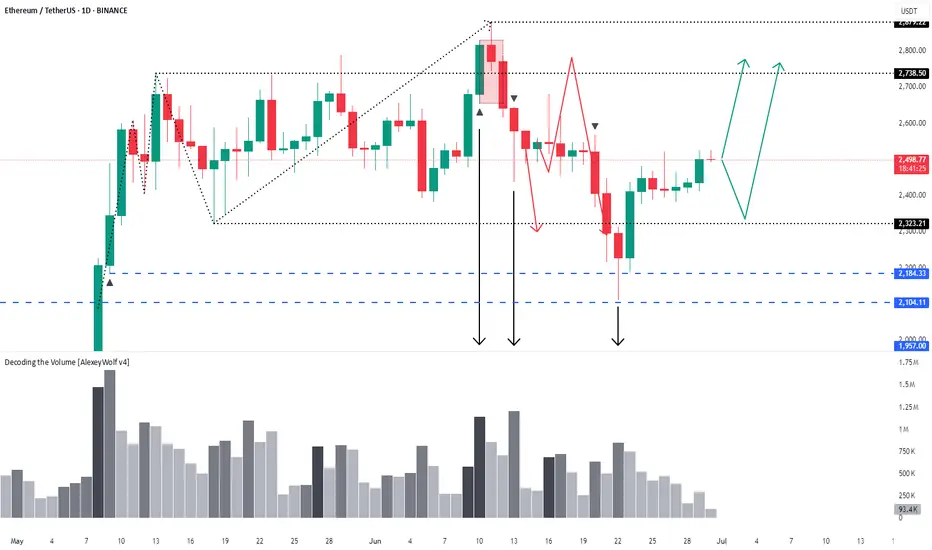
Ethereum – 1D timeframe overview with Initiative AnalysisHey traders and investors!
The seller has reached their target.
A buyer started buying from the 2184 level and now holds the initiative.
Targets are on the chart.
This analysis is based on the Initiative Analysis concept (IA).
Wishing you profitable trades!
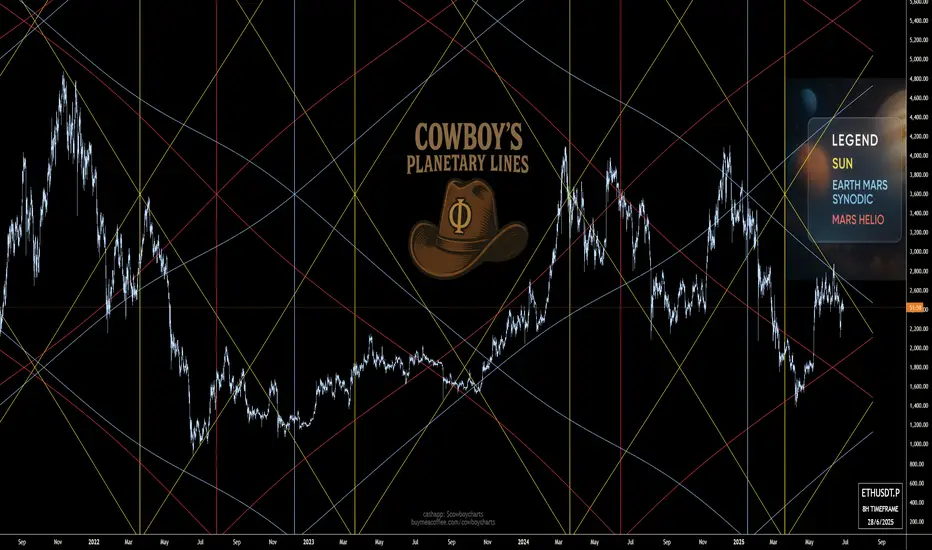
ETH - Intergalactic, Planetary, Intergalactic, PlanetarySun Lines (Gold Fences): These vertical yellow posts mark the high-noon moments when Solar power kicks off major stampedes. Note how the late-2021 Sun line lit the fuse for ETH’s first big buck, and the spring 2024 fence set the stage for that gallop up to nearly $4,800.
Earth-Mars Synodic Ropes (Blue Lassos): These sweeping blue arcs show us when Earth and Mars line up in the sky—and in price rhythm. Each blue lasso tends to corral momentum, either roping in a rally or reining in a sell-off. Early 2023’s synodic rope kept bears at bay, while the latest loop around June 2025 hints at a pick-me-up near $2,400.
Mars Heliocentric Rails (Red Corral Bars): The red lines are Mars’s own heliocentric fences—tough support and resistance levels that often drive price back toward the barn. When ETH bucked above a Mars line in mid-2022, it stalled for months; when it fell through a red rail in early 2025, it trailed off toward $1,500.
Trail Ahead: We’ve just passed another Sun post and are nearing a Mars corral bar around $2,200–2,300. If the blue synodic rope holds, expect a gentle trot back up toward $2,800; if ol’ Mars drags us off-trail, we might be bucked back toward $1,600. Keep your eyes on those planetary fences—the next cosmic roundup’s comin’ soon!
BYBIT:ETHUSDT.P
ETH-bias short Bullish indications:
Weekly : indicates IHS formation with the bullish indication.
MA 21 respected as well.
Bearish indications:
Daily :MA 21 respected.
Doji candle and yesterdays closing was respected and fallen .
Formation of head and shoulder pattern.
4 hr: Hanging man candle followed by the bearish candle indicates bearish
Bearish divergence in 4 hr:
Fib level 0.618 is at 2318 which has further room to fall.
Trade plan bias short @ 2413
SL:2450
TP1:2375
TP2:2341

ETH 1W IdeaLooks like Ethereum is forming inverse H&S pattern. Wait for the price to break out of the neckline and then re-test it and not close below this neckline. When this is confirmed you can enter a long trade. Target will be given under this idea later when re-test happens.

Another Bullish Hope… or a Bearish Setup!?🧠 Multi-Timeframe Analysis of ETH/USDT
Monthly Timeframe:
Since early 2023, Ethereum has been in a solid uptrend, managing to reach a key level (pink line).
After a strong move, it got rejected in May 2024, falling to around 2111.
Buyers made another aggressive attempt, pushing the price up to 4094, breaking the previous high — but this time, the rejection was much more intense.
Price quickly dropped all the way to 1385.
So, where are we now?
The market structure has clearly flipped to sell on the monthly timeframe.
We appear to be in a pullback/retrace phase, likely setting up for a deeper move down.
First downside target? Around 1957 — but remember:
Every level = a new decision point!
Weekly Timeframe:
After the rejection from 4093, buyers attempted a recovery. Maybe it was just profit-taking from bears.
The price briefly entered the "expensive zone" — but the momentum didn’t hold.
Last week, a strong bearish weekly candle confirmed the shift to a sell structure.
We might still see one more push to test the 2920 level, but honestly...
It smells like a bull trap. The market might lure buyers in just to drop the price again.
Right now, the bears are in control 🐻
Daily Timeframe:
Looking at the daily chart, the sell structure is clear.
Two likely scenarios:
1- The downtrend continues from here
2- A slight push upward to trap aggressive buyers before the next leg down
🌫️ The market may give a false sense of strength to the bulls, but the true momentum is still bearish.
Is this a bear trap? Maybe.
For now, I'm favoring sell setups — unless I see something that strongly shifts the structure.
Summary:
From monthly to daily, all signs currently point to bearish pressure dominating the market.
Until proven otherwise, the trend remains downward.
🎯 Possible targets if the drop continues:
1957
1793
1752
📌 Remember: every level is an opportunity to re-evaluate, not a fixed prediction.
📣
If you found this breakdown helpful, drop your thoughts in the comments
Have a question or a chart you'd like reviewed? Let me know!
Follow me to stay updated — especially if price action shifts and this scenario changes.
Save and share with fellow traders who appreciate deep, multi-timeframe analysis
⚠️ Disclaimer:
This content is intended for educational and informational purposes only and does not constitute financial advice or a trading signal.
Trading carries risk. Please do your own research, practice solid risk management, and never rely solely on external analysis.
You are solely responsible for your trading decisions.

Bullish on ETHThis is my personal idea of what will happen in the near future for ETHUSDT. Lets see how this plays out.

Everyone sees consolidation. I see positioningETH is holding just above a key fib cluster, showing signs of controlled distribution, not weakness. Smart Money doesn’t chase — they build positions while the crowd second-guesses.
The Structure:
Current Price: ~2,419
Local High (Premium): 2,482.09
Fib Retracements:
0.236 → 2,394.72 (mild correction)
0.382 → 2,340.68 (initial re-entry zone)
0.5 → 2,296.99 (ideal discount)
0.618 → 2,253.31 (deep entry, high confluence)
0.786 → 2,191.11 (structure last line)
Key Zones:
FVG already filled during the move up — imbalance mitigated
Order block (OB) at 2,191.11: high-probability reaction zone
Strategy Outlook:
Scenario A (Shallow pullback):
ETH tests 2,394 → 2,340, then continues the push to 2,482
→ Aggressive buyers step in early
Scenario B (Deeper sweep):
A drop to 2,296 → 2,253 opens the door for reaccumulation
→ Classic Smart Money trap before the next rally
Invalidation:
A break below 2,191 (and OB failure) kills this bullish narrative
Execution Logic:
Accumulation Zones:
Light: 2,340–2,296
Strong: 2,253–2,191 (discount reload)
Target:
2,482
Extension optional if momentum builds above recent highs

ETH: Short 25/06/25Trade Direction:
ETH: Short
Position Strategy:
- Risk approx 0.5%
Reason for Entry:
- Daily FVG
- Big resistance level
- Critical level of resistance, until flipped bias on eth must remain bearish intraday
- H4 Liquidity Swept

ETHEREUM is having a bearish retest?#ethereum price has been moving in a distribution zone and needs to breakout at least 3000$ to be optimistic and 3300$ to be bullish. #eth price is now having a bearish retest where broke the former support zone and now testing the current resistance zone. 4H ichimoku cloud must be broken out. A heavy declination from this zone may cause heavier dumps.

ETH Retracement 50% FibHi there, I think there will be a retrace at ETH to 50% fib. My new buy zone will be 2300 and I am short at the moment to 2300. Hope this helps you out. Do your research and this is no financial advice, just an idea. Oh and by the way, I got my SL just above the current high (~2490).
Let me know what your thoughts are in the comment below!

ETH/USDT | ICT Price Delivery Model: AMD📍 ETH/USDT – Daily Timeframe | ICT Smart Money Framework
This analysis outlines a clean execution of the ICT Price Delivery Model:
🔹 Accumulation Phase:
Price consolidates in a defined range, building liquidity above and below the zone.
🔹 Manipulation Phase:
Liquidity sweep to the downside taps into the Balanced Price Range (BPR) — engineered to trap late sellers.
🔹 Repricing Phase:
Price reacts sharply from the Daily Fair Value Gap (D FVG), confirming bullish intent.
🔹 Distribution Objective:
Smart Money likely targeting external liquidity resting above the $3,400 level.
Key ICT Concepts Applied:
✔ Break of Structure (BOS)
✔ Market Structure Shift (MSS)
✔ Fair Value Gap (FVG)
✔ Balanced Price Range (BPR)
✔ External Liquidity ($$$)
📈 Directional Bias: Bullish
🎯 Primary Target: $3,400 (Distribution Zone)
🕒 Chart Type: Daily (1D)
📉 Invalidation: Break and close below BPR without mitigation
📊 Shared by SeenForex – Precision Analysis through ICT Methodology

ETH - When $3,000??The one who frontrun ETH at the bottom are the real boss, looks good from 2460 for longs, and slit for buys at the range if something outlasts

ETHUSDT Weekly: $2550 - The Bullish Pivot Point• Current Price Consolidation and Immediate Range : The ETHUSDT price is currently consolidating within a critical immediate range, bounded by the 2000−2200 weekly support below and the 2900−3000 overhead resistance area. This 2000−3000 zone defines the current primary trading boundaries on the weekly timeframe.
• Key Bullish Catalyst at $2550 : For the bullish sentiment to gain significant momentum and indicate a potential continuation of the recent upward movement, a decisive weekly close above the $2550 level is paramount. This price point acts as an immediate pivot; successfully clearing and holding above it would suggest a re-energized buying interest targeting the upper bound of the current range.
• Significance of the "Deciding Area" : The 2900−3000 region, labeled as a "Deciding Area," represents a crucial resistance confluence. This zone previously served as significant support and the long-term green ascending trendline, which was subsequently broken. A successful retest and breakout above this area would indicate a potential shift in market structure from bearish to bullish, opening the path towards the higher Key Resistance at 3900−4000.
• Critical Support and Downside Risk : Maintaining the 2000−2200 weekly support is essential for bulls. A sustained weekly closure below this level would invalidate the current bullish outlook and likely lead to a retest of the strong demand zone around 1400−1500, signaling a deeper retracement or a renewed bearish trend.
Disclaimer:
The information provided in this chart is for educational and informational purposes only and should not be considered as investment advice. Trading and investing involve substantial risk and are not suitable for every investor. You should carefully consider your financial situation and consult with a financial advisor before making any investment decisions. The creator of this chart does not guarantee any specific outcome or profit and is not responsible for any losses incurred as a result of using this information. Past performance is not indicative of future results. Use this information at your own risk. This chart has been created for my own improvement in Trading and Investment Analysis. Please do your own analysis before any investments.

ETH Long TradeLooks bullish here for continuation
Futures are higher on holiday
Order flow neutral to bullish

ETH Forming Bullish AB=CD Pattern | Eyes on Breakout #Ethereum (ETH) is showing strong bullish momentum on the 4H timeframe and is currently developing a classic AB=CD harmonic pattern, which often precedes a continuation of trend.
✅ Key Observations:
#ETH is holding within a solid uptrend structure
No signs of bearish divergence or reversal patterns yet
Momentum remains healthy, with buyers in control
🔍 What to Watch For:
We are closely watching the previous Higher High (HH) — currently acting as a key resistance level. A 4H candle close above this level will serve as confirmation for the continuation of the bullish trend.
📈 Trading Plan:
Once #ETH breaks above the resistance and confirms with a close, we’ll look to enter a long position with proper risk management and stop-loss placement below recent structure.
💬 What’s your bias on #ETH in the short term? Are you already long, or waiting for the breakout too?
📌 Don’t forget to Like, Comment, and Follow for more clean setups and strategy-based analysis!
#ETH #Ethereum #CryptoTrading #ABCDPattern #TechnicalAnalysis #Harmonics #TradingSetup #Breakout #PriceAction
