ETHUSDT.3L trade ideas
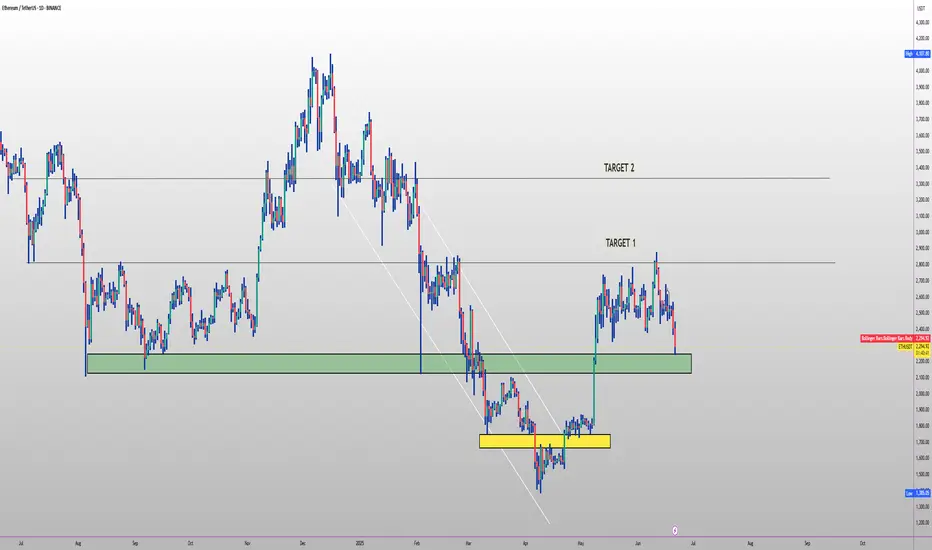
ETH PLAN FOR 2025🔥 CRYPTOCAP:ETH long setup (1D) 🚀
✅ Entry Zone: $2 280 – $2200 (multi-month demand)
🎯 Targets
• TP-1: $3 000 (macro range mid)
• TP-2: $3 400 (2024 breakdown line)
⛔ Stop-Loss
Daily close < $2050
📊 Thesis
• SEC-approved spot-ETH ETFs now trade on NYSE/Nasdaq 🏛️
• >35 M ETH staked (≈29 % supply) tightening float
• Dencun’s EIP-4844 slashed L2 fees ~90 % ⚡
• EigenLayer restaking TVL > $20 B 📈
• Pectra upgrade brings account abstraction & wallet UX overhaul
• ETH supply net-deflationary since EIP-1559 🔥
• Danksharding next → massive roll-up throughput
Long trade
15
min overview
🟢 Trade Journal Entry – Buyside Trade
📍 Pair: ETHUSDT
📅 Date: Saturday, June 21, 2025
🕒 Time: 2:00 AM (Asian Session AM)
⏱ Time Frame: 15 Minutes
📈 Direction: Buyside
📊 Trade Breakdown:
Entry Price 2422.81
Profit Level 2474.60 (+2.14%)
Stop Loss 2415.04 (−0.32%)
Risk-Reward
Ratio 6.67 1
🧠 Context / Trade Notes:
BOS 5th June – 4HR Low Wick:
Break of structure observed on June 5th from a 4-hour low wick.
Observing the current NY session sweep of the liquidity from the London low wick signalled Sellside exhaustion.
Order Block & Retest:
A bullish OB formed on a prior swing, with a clean mitigation of price (Fri, 20th price range) and BOS, confirming buy-side interest.
5min TF Observation - entry:
Narrative:
Utilising DRT levels (coined by Ali Khan) to navigate the range and unfolding price action.
Target imbalance zone 1Hr.

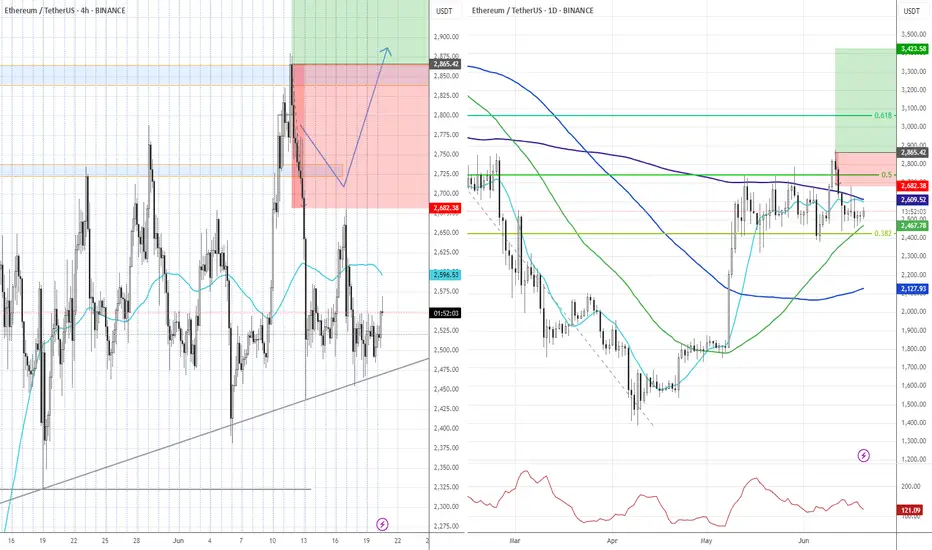
ETH/USDT 4H Technical Analysis UpdateChart Insights:
ETH is holding the lower trendline support (~$2,430), which indicates a potential reversal zone.
The RSI is hovering around 39, which indicates oversold territory, suggesting that buyers may step in soon.
Expected Move:
The chart predicts a strong move upwards towards the $2,800–2,900 zone (blue arrow), which aligns with the top range boundary.
Trade Plan:
Buy Zone: Near the lower trendline ($2,430–2,450)
Stop Loss: Just below the trendline ($2,400)
Target: Near the upper range boundary (~$2,800–2,900)
Stay alert!


ETH -bullish indicationsbearish indications:
LLLH in daily
MA 21 being respected in daily time frame.
Bullish indications:
Trend line resistance is broken and acting as a support now.
Inverted hammer candle from trend line support in 1 hr
formed Inverted head and shoulder formed in 15 min .
Bullish divergence in 15 min.
Trade plan bias long @ 1579
SL:1570
TP1:1589
TP2:1597

ETH ~Expansion done.Based on 3marketphase.
(contraction-expansion-trend, I learned this concept from dayya trading post)
ETH is at the box range.
(triangle-2024 August to October)
Plus, there is throwing-over with double-top (1week candle scale).
This means ethereum is at the end of contraction phase and it has high potential to trend phase. But I bet there is one more break-out from low before trend phase.
Keep an eye on all of break-out movements.

Waiting for a buy move in the btc Seeing all the acceleration move that is happening in the market
I believe is a buy
What do you think is the market movement......

SHORT ETH🔷 Setup Summary: SFP + Key Volume Combo
1. Context:
Pattern: Double Top + SFP (Swing Failure Pattern)
Timeframe: Likely M15–H1 (possibly during Asian/European session)
Background: Price breaks previous high slightly (liquidity grab), then sharply reverses — a clear trap.
2. Confirmation:
A clear Key Volume candle appears at the top — signaling market maker action.
A strong rejection candle (pinbar or engulfing) confirms the SFP.
Price fails to hold above the new high — trap confirmed.
3. Entry Strategy:
Entry: After the SFP confirmation candle closes.
Stop Loss: Above the SFP high or Key Volume wick (a “valid” SL, not necessarily tight).
Take Profit:
Short-term: 3R (if trading intra-session).
Long-term: Target demand zone or Daily support if trend supports it.
4. Risk Management (per system guidelines):
Max risk per trade: 1–2% of account.
If setup invalidates: cut the loss immediately, don’t widen SL or overtrade.


Ethereum, Bullish Breakout Expected Any Moment Now!Look at this, the first peak for Ethereum happened 13-May after the start of the recovery and the end of the downtrend. The lowest point happened five days later on 18-May and there has been no new lows since. Ethereum has been in a bullish consolidation pattern, a classic bullish flag.
This kind of dynamic clearly reveals a bullish bias and certainly, Ethereum is already trading pretty low compared to its last high.
A new and most interesting signal comes from the stock COIN, for Coinbase. This stock went ahead and produced a very strong bullish breakout yesterday with a green candle reaching +16%. COIN's chart and ETH are almost identical, exactly the same. Since these two move together, we can expect Ethereum to follow suit and do the same. We can expect a bullish breakout to happen any day now. Consolidation has been going long enough. It is time for the market to grow.
Some of the smaller altcoins continue to move forward, this is a signal that should not be ignored.
Namaste.

ETH: Short 19/06/25Trade Direction:
ETH Short
Risk Management:
- 0.5%
Reason for Entry:
- Failure to reclaim weekly open
- Loss of weekly open, monthly open, and Monday low
- H2 timeframe oversold but within a reclaimed bearish order block
- Clear bearish grind price action aligning with higher timeframe bearish trend
- Higher confidence in shorts at current level than higher up
Additional Notes:
- Total market cap looks heavy, global situation especially middle east is continuing to see a risk off mindset for risk assets like crypto.
- Until price gives me a reason not to have to assume this is continuing bearish.
- Potential to short higher if this fails

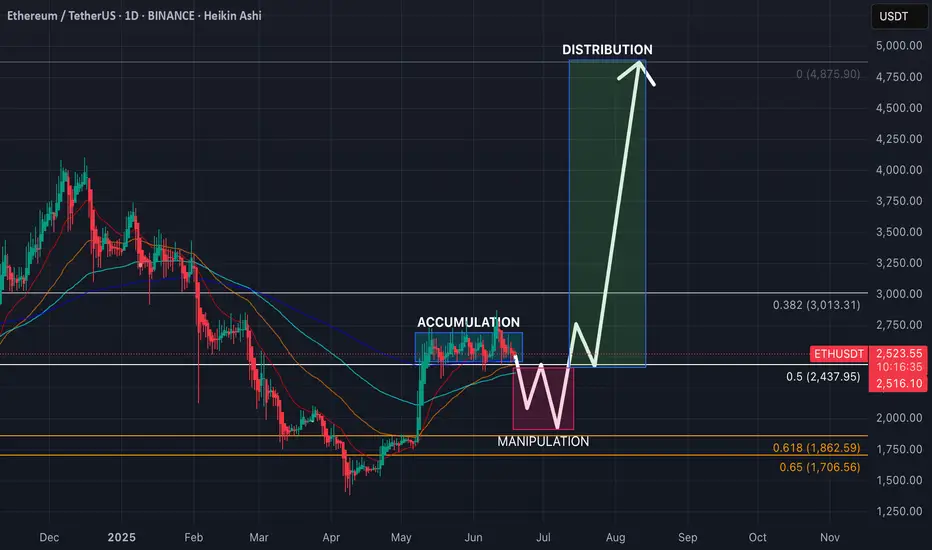
ETH: 6th consolidation week, AMD!?Ethereum is super slow these days, ranging tightly between $2430 and $2800 for weeks after a recovery. Current price action shows signs of preparation for the next BIG move, but in what side!?!!
Let’s break this down using the AMD model:
🔸 Accumulation
We saw ETH bottoming out in April after a deep correction. Since then, price reclaimed the 200 EMA and consolidated just above the 0.5 Fib level at $2437. This horizontal zone has been the accumulation range base.
🔸 Manipulation
Currently, ETH is testing the lower part of this range. Based on the chart structure, a possible liquidity squeeze breaking $2437 (mid-level) so we expect bearish trap for late sellers and non-believers before a viiolent reversal. This would be the classic “spring” move often seen in Wyckoff chart structures.
🔸 Distribution (later stage)**
If (or when) ETH breaks above $2800 and gets new attention with strong volume, this can lead to a mind blown fuses expansion — targeting the psychological $3000 and after recovery to previous ATH zone. Previous ATH at $4875 is the main target. Reasonably, this would be the final stage of distribution before a probable pump and altseason madness starts. But we are far for that right now, expect it not earlier than mid-autumn.
🧠 Key Technicals:
Okay, my Heikin Ashi candles show weakening — which means that we are close to the start of the Manipulation phase.
RSI pulling back, resetting momentum for the next move.
Fibonacci zones:
0.5 = $2437
0.618 = $1862
0.65 = $1706
🔮 Trade Idea (not financial advice):
A fake move below $2437 followed by fast and immediate recovery would be an ideal long entry.
Cancel trade if daily close below $1860, we can get lower this time.
TP? Well, depends on your belief. If btc made almost 2x from previous high, $3000 / $3500 / $4000 / $4500 / $5000 could be good? ETH could see even 8-8.5k this cycle, but its super positive outlook on current market structure.
📊 Summary:
ETH is showing classic AMD structure:
Accumulation (in progress for 6 weeks, 6 fn weeks!) ⏳
Manipulation (going down) 📉
Distribution (recovery + growth) 🚀
Some while ago, ETH was already playing simillar games, so why it should be different this time?
Breakout will come only after weak hands are shaken out, only after retail traders will sh*t their pants we will see growth.
Hopefully we will see immediate growth from current levels, but I'm more realist this time.
Ciao!
Potential Long Setup for EthereumEther stabilized in a slightly positive trend after breaking the previous uptrend. Since mid-May, this flattish trend channel has continued, offering some trading opportunities within it.
When Ethereum approaches the lower line and the 50 EMA crosses above the 50 SMA, an ETHUSDT surge has followed each time since the channel formed. Traders could expect a similar move again. However, the key risk is potential negative pressure on stock markets due to geopolitical concerns and the correlation effect on the crypto market and a break of the channel.

ETH-----Buy around 2530, target 2580 areaTechnical analysis of ETH contract on June 19:
Today, the large-cycle daily level closed with a small positive line yesterday, the K-line pattern was a single positive line with continuous negatives, the price was below the moving average, and the attached indicator was dead cross. The big trend of decline is still very obvious, but for now, the continuation and strength are relatively poor, which is also the reason why the price is simple and easy to wash; the short-cycle hourly chart yesterday's European market price fell and did not break down, the US market price supported the rebound, the current K-line pattern is continuous positive, and the attached indicator is golden cross, so there is a high probability that it will rise and break the high during the day.
Today's ETH short-term contract trading strategy:
Buy at the current price of 2530 area, stop loss at 2495 area, and target 2580 area;

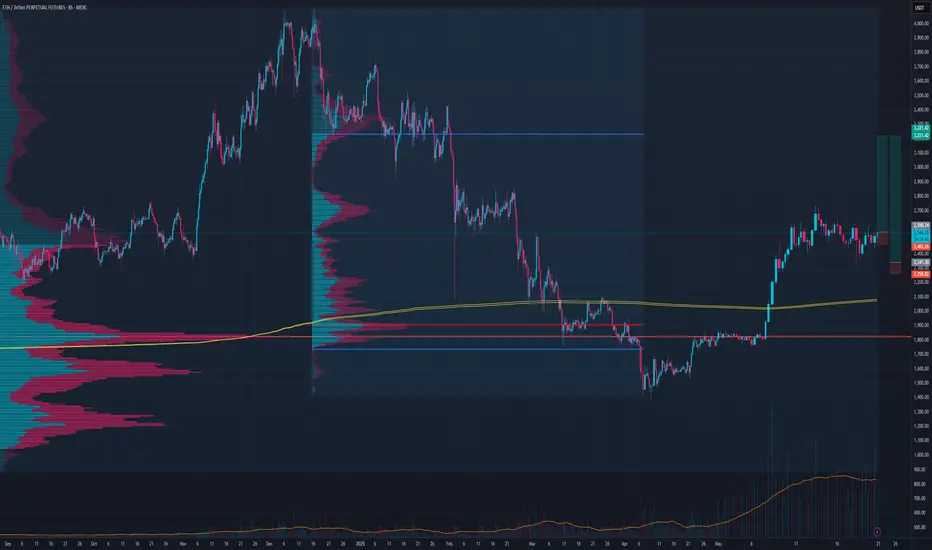
Ethereum Daily Chart = Coiled SpringSitting on the 200 EMA.
3x liquidity sweeps below — no breakdown.
Red dots stacking above = pressure cooker.
📉 Break $2.45K → dump
🚀 Break $2.7K → $3K squeeze
Big move coming. Don’t blink.

HolderStat┆ETHUSD accumulationBYBIT:ETHUSDT is compressing in an ascending triangle, pivoting around 2 500. A decisive break above 2 520 tees up 2 800–2 900 continuation, while closing back under 2 430 would negate the immediate setup but leave macro structure bullish.

$ETH / USDT – 4H Time Frame Analysis 3,000 INCOMING?? CRYPTOCAP:ETH / USDT – 4H Time Frame Analysis
Structure: Bullish Flag | Outlook: Neutral-Bullish | Target: $3000?
🔹 Chart Overview
-Pattern: Bullish Flag (continuation structure)
Current Range:
- Supply Zone: $2,680.00 – $2,786.21
- Demand Zone: $2,319.79 – $2,417.61
Price Action:
- Tight consolidation between higher lows and lower highs, forming a symmetrical triangle within a flag structure.
Trend:
- Consolidation, but within a macro uptrend (prior strong rally).
Volume Profile:
- Anchored Volume shows high participation around $2,540–$2,600.
OBV:
- Flattening, signaling indecision and potential energy buildup.
Key Psychological Levels:
$2,860: Minor resistance from past S/R flips.
$3,000: Major round-number psychological resistance.
📐 Technical Confluences
Fibonacci Retracement:
- The 0.618 golden pocket aligns with the support trendline, reinforcing this as a critical zone.
Fair Value Gaps (FVG):
- Above Price: Acts as a magnet in bullish continuation.
- Below Price: Risk zone if price drops; aligns with liquidity and trendline support.
- Liquidity Zone: Aligned with 0.5–0.618 retracement; strong reaction expected.
📈 Bullish Scenari o
Breakout of Pennant Resistance:
- A clean break above $2,786 (supply zone & swing high) with volume.
Close above Upper FVG and Liquidity Zone:
- Confirms bullish intent. Targets psychological level at $2,860, then $3,000.
Volume Confirmation:
- OBV uptick and high breakout volume would validate the move.
Bullish Target Zones:
TP1: $2,860 (psych level + previous resistance)
TP2: $3,000 (major psychological level)
TP3: $3,120–$3,180 (1.618 Fib extension)
📉 Bearish Scenario
Rejection from Current Supply or Liquidity Zone:
- Fails to break above supply; rolls over from the upper pennant line.
Break Below Support Trendline:
- Break below golden pocket and $2,417.61 demand zone.
Invalidation of Bullish Flag:
- A breakdown below $2,319.79 (swing low) invalidates the bullish flag and may signal a trend reversal.
Bearish Target Zones:
TP1: $2,200 (local volume gap + structure support)
TP2: $2,060–$2,120 (previous accumulation zone)
TP3: $1,950 (macro support & last strong demand)
✅ Summary
Structure:
- Price is compressing within a bullish continuation pattern, awaiting breakout confirmation.
Bias: Slightly bullish unless the swing low at $2,319 is broken.
Confirmation Needed:
- Break above or below pennant boundaries with volume.

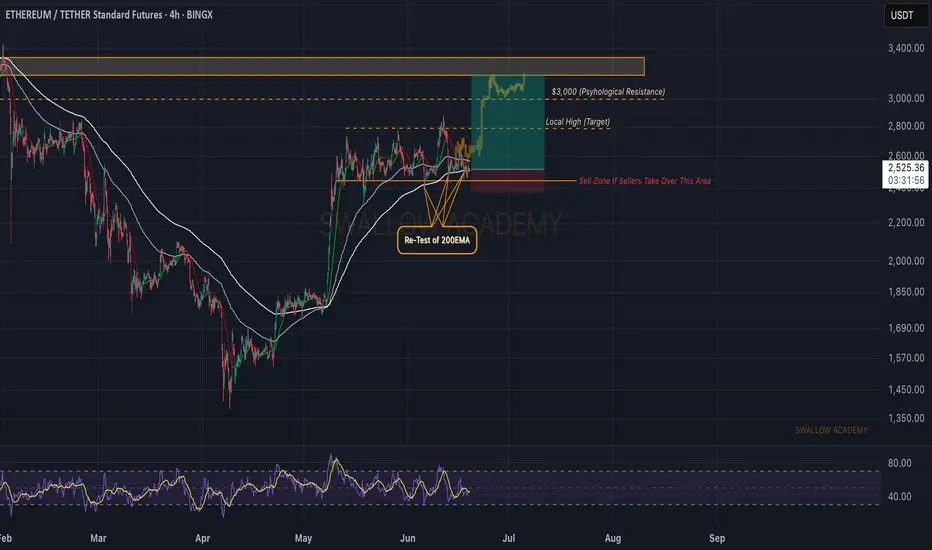
Ethereum (ETH): Golden Buy Zone | Buyers Taking ControlBuyers are taking control near the 200EMA, which could give us a really good bounce to upper zones from here on.
We see whales accumulating the ETH, which confirms our saying that Ethereum has not yet reached its potential.
The key zone is the 200EMA as of now.
Swallow Academy
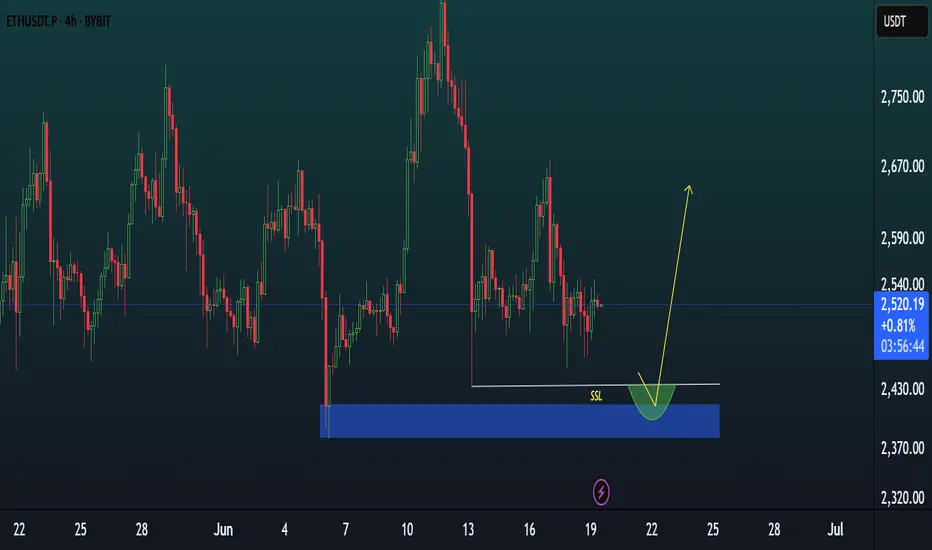
ETH NEXT BUYZONE.ETH has created a wick and below that is a huge liquidity cluster. I want price to fill that liquidity cluster and then upside.
ETH - BOOM or Toink?Okay Mostly boom down, but a toink to get over most peoples liquidity and get sorted up, the probable move is this as per me

Crypto at a Crossroads: BTC, ETH & SOL – 3 Charts, 3 Messages📊 Market Overview:
The crypto market often moves together — but BTC, ETH, and SOL are telling 3 very different stories right now. From Bitcoin’s coiled spring to Ethereum’s indecision and Solana’s struggle — this divergence could define the next major trend.
1️⃣ Bitcoin (BTC): The Market’s Trigger
BTC is tightening in a Symmetrical Triangle after a powerful uptrend — a textbook Bull Pennant.
🔼 Lower highs + higher lows = pressure build-up
🔇 Volume drying up → classic pre-breakout setup
⚡ A decisive move (esp. above $ 108K) will likely lead the entire market
Bias: Bullish continuation likely, but prepare for either direction.
2️⃣ Ethereum (ETH): The Waiting Game
ETH is stuck in a rectangle range between $ 2,450–$ 2,800.
😐 Flat MAs = no short-term trend
📉 ETH is neutral → waiting for BTC to move first
Strategy: React to breakout or breakdown from range boundaries.
3️⃣ Solana (SOL): The Weakest Link
SOL shows clear signs of reversal and relative weakness.
⚠️ Double Top near $185 in May
🔻 Lost multi-month trendline
🛡️ Testing critical support at $ 140–145
🌀 Attempting a Rounding Bottom (accumulation?) but still below key MAs
Watch: Support must hold. Break below = major downside risk.
🎯 Trade Strategy:
If BTC Breaks Up (above $ 108K):
🚀 Long BTC → Targets: $ 118K–$ 120K
✅ Long ETH above $ 2,800
🧨 Aggressive Long SOL above $ 160 (trendline reclaim)
If BTC Breaks Down (below $ 104K):
⚠️ Short BTC → Targets: $ 100K, $ 98K
⚠️ Short ETH below $ 2,450
🚨 High-conviction Short SOL below $ 140 → Potential drop to $ 100 zone
❌ Invalidation:
📉 Bullish thesis invalid if BTC breaks below triangle
📈 Bearish invalidated if BTC breaks up (Stop loss above $112K)
🔚 Final Word:
BTC is the market’s steering wheel — ETH is parked, SOL is stalling.
⏳ The triangle is near apex. A breakout will ripple across all coins.
Which direction are YOU betting on? Bullish or Bearish? Drop your view below!
