ETH Hits $3K — Next Stop: Moon or Pause?ETH just tagged the psychological $3 000 barrier after a sharp impulse, printing a fresh higher high inside its rising channel.
🧠 Game plan:
1️⃣Pullback zone: The orange structure area at $2 550 – $2 700 aligns with the channel’s lower trend-line — a prime spot for bulls to reload.
2️⃣Continuation trigger: A clean 4H close back above $3 000 turns the level into support, unlocking the path toward $3 100 (first target) and potentially higher into the summer.
3️⃣Invalidation: A decisive break below the channel would neutralise the setup and shift focus back to the macro support near $2 400.
Until then, every dip toward the orange demand is a gift in this bullish structure. Trade the plan, not the noise.
📚 Always follow your trading plan regarding entry, risk management, and trade management.
Good luck!
All Strategies Are Good; If Managed Properly!
~Richard Nasr
ETHUSDT.P trade ideas

ETH about to reach 3500ETH about to reach 3500
On all time frames ETH is in a clear bullish trend.
Yesterday the price created also a new structure high above the small pattern indicating for a growth on the bullish momentum.
Given that ETH didn't rise for a long time the chances that ETH may start even a bigger bullish movement are higher.
If the price continues this trend ETH may test 3500 soon
You may find more details in the chart!
Thank you and Good Luck!
PS: Please support with a like or comment if you find this analysis useful for your trading day

You Seek Profit, they seek you !who?Every time you think the market’s about to crash, it pumps.
And when you’re sure it’s time to enter, it dumps.
Maybe it’s time to ask a serious question: Who’s really hunting whom?
Hello✌
Spend 3 minutes ⏰ reading this educational material.
🎯 Analytical Insight on Ethereum:
As noted earlier, after several days of sideways action, BINANCE:ETHUSDT has confidently broken above its parallel channel. 🚀 This breakout sets the stage for a potential gain of at least 10%, targeting around 3200. There is also a chance for a retest of the channel’s upper boundary before continuing higher. 🔄
Now, let's dive into the educational section,
🎯 The Modern Market Hunters
Markets today aren’t simple anymore. Behind every candle lies a strategy, an algorithm designed for one thing:
Profiting from your fear and greed.
In crypto, liquidations have turned from a mere term to a deadly tactic. When you enter a position, exchanges know exactly where your stops are. Often, price moves are designed to trigger liquidations of traders like you.
🛠 TradingView’s Tools to Spot the Traps
In a market where hunters are always one step ahead, TradingView’s default tools can be your secret weapon. You just need to know where and what to check:
Volume Profile (Range & Fixed): Shows where real money volume has entered, not just pretty candles.
Liquidity Zones Indicators: Pinpoints exact areas where stops cluster the prime hunting grounds.
Order Block Detection Scripts: Marks zones where whales place heavy orders, always moving against retail trader sentiment.
Set these tools on 1H to 4H timeframes and focus on overlapping areas. This way, you can spot traps before they activate, not after.
🔬 How Are Traps Actually Set?
Markets first build a nice trend, making everyone FOMO in. Then, a sudden shadowy candle crashes the party.
This is called a liquidity sweep or stop hunt.
Signs are clear:
Sudden volume spikes
Positions quickly flipping to profit or loss
Long shadows on candles signaling stop grabs
This is exactly where Open Interest and Liquidity Maps come in handy. They reveal the hunting map before your eyes.
🧠 Your Mind Is The Biggest Liquidity Map
The biggest traps are built inside traders’ minds. When the market moves against you, you panic and set stops.
But that’s exactly the lesson market makers want you to learn: don’t react emotionally.
Instead, a pro trader uses others’ behaviors as cues before market moves.
While you focus on profit, whales focus on your biggest fear: stop loss.
🔄 Your Greed Is Their Data
Every stop you set is a data point for them. You chase profit, they chase your surrender.
Lots of long volume in one zone? Price gets dragged down.
Everyone’s short? Expect a fake pump.
Volume is a footprint, and they track emotional traders like a bloodhound.
🚧 Escape The Trap, Don’t Predict The Market
Pro trader’s formula:
Don’t try to predict track.
When you realize the market isn’t moving naturally but hunting orders, your mindset shifts. You become a tracker, not a soothsayer.
📉 Every Candle Can Be A Killer If You’re Unaware
When a big opposing candle hits your position, ask:
Are we all thinking the same thing?
If yes, you’re likely the next target.
📌 Final Summary
If you only chase profit, you miss the fact the market is hunting you.
The only way out: know they play with your info, not just the charts.
Trading blindfolded is walking into the wolf’s den.
✅ What To Do Next?
Learn to analyze other traders’ moves, not just price action.
Use TradingView tools to see behind the candles.
You’re not here to be hunted you’re here to hunt. So this time, guess where everyone’s stop will be before entering!
✨ Need a little love!
We pour love into every post your support keeps us inspired! 💛 Don’t be shy, we’d love to hear from you on comments. Big thanks , Mad Whale 🐋
📜Please make sure to do your own research before investing, and review the disclaimer provided at the end of each post.

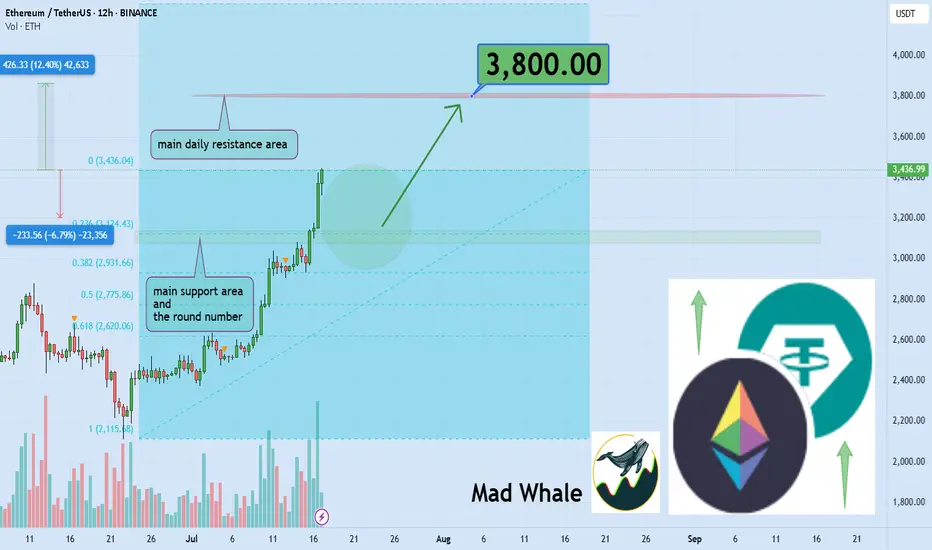
Crypto Exploded, I Missed it, What should I Buy Now?!The market suddenly exploded… green candles after green candles. Yesterday, you were hesitating to look at the chart, today everyone on social media is posting their profits. So what now? Did you miss out? It’s not too late. The main question now is: What should I buy to catch up?
If you read this analysis till the end, not only will you learn some practical TradingView tools, but you’ll also gain insight into how to act like a professional trader after big pumps not like a reactive follower.
Hello✌
Spend 3 minutes ⏰ reading this educational material.
🎯 Analytical Insight on Ethereum:
BINANCE:ETHUSDT is currently holding near the daily support and the key psychological level at $3,000, which also matches the 0.23 Fibonacci retracement. A potential upside of at least 12% is expected, targeting $3,800 close to a major daily resistance zone. Keep an eye on these levels for possible trade setups 📊⚡.
Now , let's dive into the educational section,
🧠 FOMO: The Enemy That Devours Your Profits
If you feel like you missed the boat now, don’t panic. Everyone has felt that, even top traders. It’s called "FOMO." Jumping into the market without analysis and just on emotions can burn you badly. Instead of regretting, sit calmly, analyze, and wait for the right setup. The market always offers new chances you just need to know how to hunt them.
🔍 What to Buy Now? Logic Over Emotion
There are three types of coins still offering opportunity:
Coins that haven’t broken their previous highs yet
Like a compressed spring, they can jump higher with a small push.
Altcoins lagging behind Bitcoin
When BTC pumps, alts usually follow afterward.
Coins with strong upcoming fundamental news
Networks with upcoming updates or special events that generate excitement.
Don’t forget on-chain analysis. See where money is flowing.
🌟 Look for New Stars and Strong, Established Coins
After a pump, there are two ways to hunt:
🔹 New Stars
Altcoins that are just coming out of their correction phase and haven’t had their main pump yet.
🔸 Strong and Established Coins
Assets that have shown resilience, have strong fundamentals, and tend to pump again after corrections.
Balance your portfolio with both to lower risk and maximize profit potential.
🧰 TradingView Tools to Hunt Opportunities After a Pump
To avoid missing out in the second phase of the market explosion, you must use TradingView’s analytical tools correctly. Here are three key tools you should know right now:
Volume Profile
Helps you understand where most trading volume occurred. Smart money usually buys and sells heavily at these points.
RSI (Relative Strength Index)
Tells you when the market is overbought. When it drops back to the 40 to 50 range after a peak, that could be a good re-entry point.
Fibonacci Retracement
A tool to find attractive correction zones after a pump. Especially useful if you combine multiple timeframes.
⚖️ Stop Loss Is Necessary, But Take Profit Is More Important
Always place a stop loss in the market. But many forget to set a take profit in bullish markets.
Having a take profit level ensures you lock in gains when the market hits your target and avoid greed.
Key point: Even if you expect huge pumps, take some profit on time to avoid losing it all during corrections.
🪙 The Next Pump Is Just Around the Corner
Instead of jumping into a pump mid-way, focus on spotting setups just forming. Watch for consolidation candles, rising volume, and reactions to classic zones. That’s where you can enter professionally, even before everyone knows what’s coming.
🛠 Game Plan for the Trader Who Fell Behind
Pick three coins that haven’t pumped yet
Test the tools mentioned on them
Set alerts for logical entry signals
Enter with risk management, not emotion
Most importantly analyze, don’t just follow
📌 Summary and Final Advice
If you missed the market pump, don’t worry; crypto markets always offer opportunities you just need to be prepared. A combination of analysis, professional tools, and smart choices between new and established assets can help you not only catch the next pump but ride it ahead of everyone else.
✨ Need a little love!
We pour love into every post your support keeps us inspired! 💛 Don’t be shy, we’d love to hear from you on comments. Big thanks , Mad Whale 🐋
📜Please make sure to do your own research before investing, and review the disclaimer provided at the end of each post.
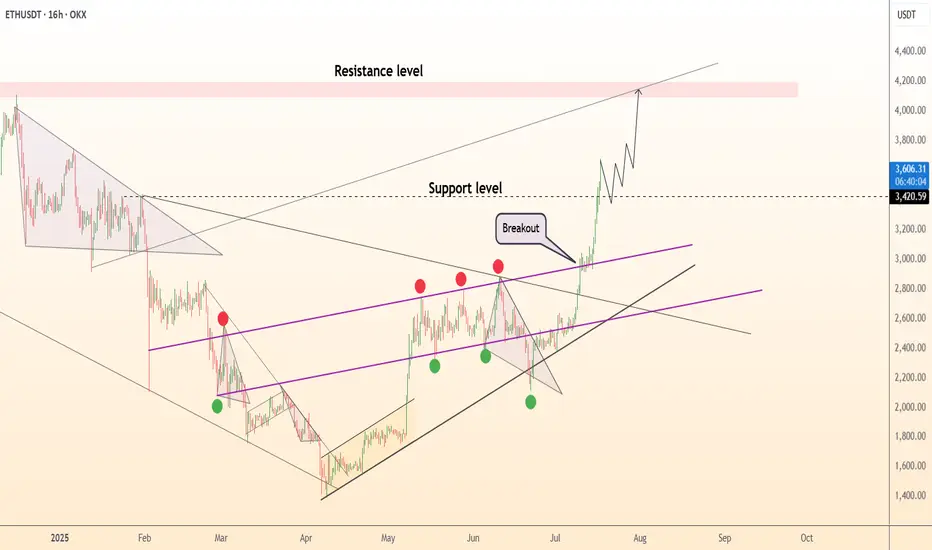
ETHUSDT Ready for 3K$ and New possible ATH after YearsSoon Red trendline resistance And 4K$ resistances will break and market will easily continue this bull Move and reaching new highs here After each other.
I am expecting more rise here at least to 3500$ near red trendline resistance and only after a valid breakout there more pump is expected like green arrow.
DISCLAIMER: ((trade based on your own decision))
<<press like👍 if you enjoy💚

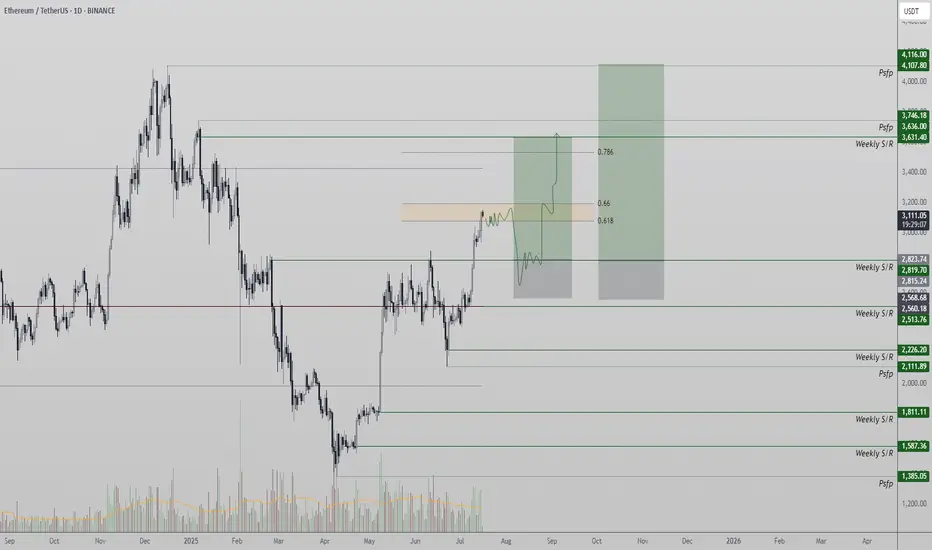
Ethereum Hits Golden Pocket Resistance — Rejection or Breakout?Ethereum (ETH) is facing a pivotal moment as it trades directly into the Golden Pocket — a Fibonacci zone widely recognized for its strong influence on price behavior. As ETH reaches this resistance, traders are watching closely to determine whether a rejection will lead to a bullish retest at lower levels, or if a breakout will confirm continuation toward much higher targets. The next few days will be key in defining the near-term trend.
- Golden Pocket Resistance: Ethereum is trading at the 0.618–0.65 Fibonacci retracement zone, a historically reactive level.
- Bullish Retest Zone at $2,800: A rejection could lead to a healthy high-low formation at this support.
- Upside Target at $3,600: A breakout above the Golden Pocket would likely accelerate the move toward this high-time frame resistance.
Ethereum’s current price action has entered a region of significant resistance: the Golden Pocket, which lies between the 0.618 and 0.65 Fibonacci retracement levels. This zone often acts as a strong inflection point, either halting price momentum temporarily or confirming a breakout with strong follow-through.
Should Ethereum face rejection from this zone, price could rotate back down to the $2,800 region, which now aligns with a key support structure and potential bullish retest zone. This would allow for a higher low formation, reinforcing the uptrend and setting the stage for a long opportunity targeting previous highs.
So far, no rejection has occurred, but if it does, it will likely be seen as a buy-the-dip opportunity for traders aiming to re-enter the trend. This would also mark a textbook retracement within a bullish market structure.
Alternatively, if Ethereum breaks above the Golden Pocket without rejection and consolidates above it, this would be a strong bullish confirmation. In that scenario, the next likely destination is the $3,600 high-time frame resistance, a key level that has previously acted as a major barrier.
Volume and candle structure over the next few sessions will offer key signals — a strong impulse with follow-through would favor the breakout scenario, while weak closes and rejection wicks would support the retracement idea.
Ethereum is at a make-or-break level. A rejection from the Golden Pocket could lead to a healthy correction toward $2,800, offering a long setup. However, if ETH breaks through this resistance with strength, a rally toward $3,600 becomes the high-probability scenario. The next move will likely define Ethereum’s short-term trend.
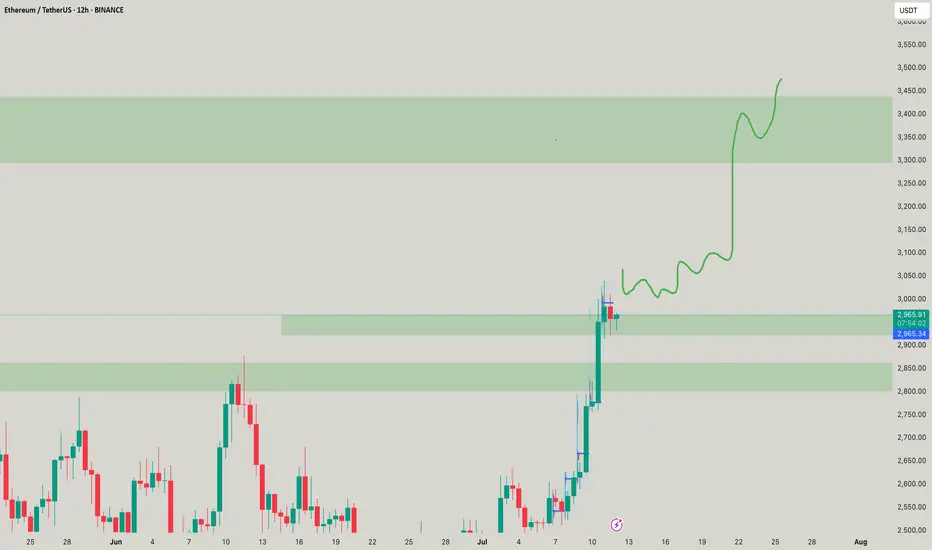
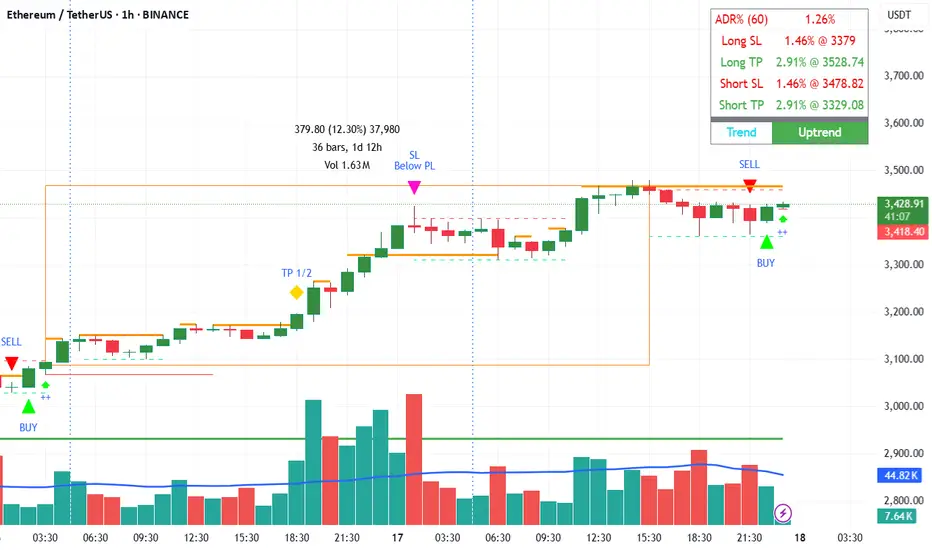
ETH continues to gather more upward momentumETH continues to gather more upward momentum
From our previous analysis, Ethereum is close to the last target, but the potential seems higher.
On the 60-minute chart, the price has already formed a small bullish flag pattern, indicating that the bulls are in control of the price and ETH could move beyond our last target.
I am looking for a possible upward move with targets at 3080; 3175 and 3250.
You may find more details in the chart!
Thank you and Good Luck!
PS: Please support with a like or comment if you find this analysis useful for your trading day

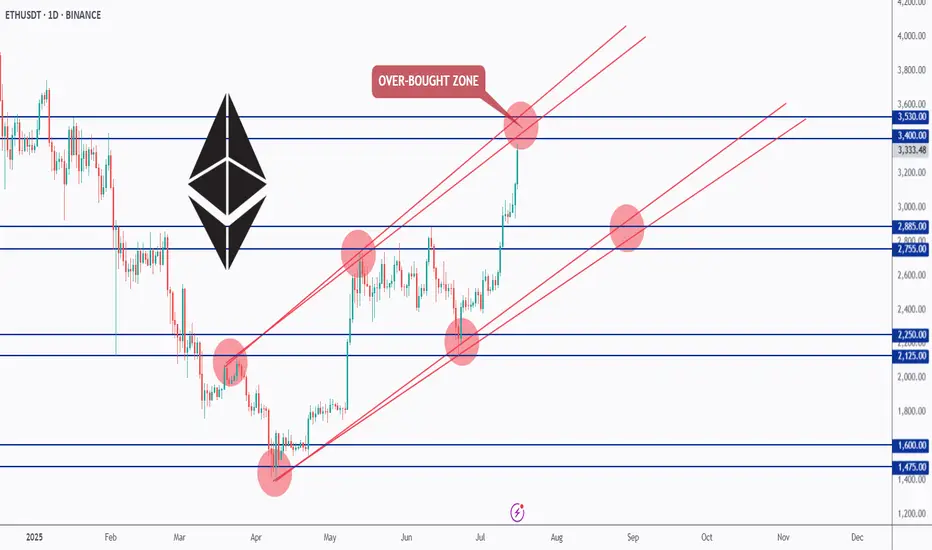
ETH Testing Overbought Zone — What’s Next?📊ETH has been overall bullish, trading inside this rising red channel for months.
After breaking above the $2,885 resistance, bulls took full control, and price is now approaching the upper red trendline — an overbought zone where we’ve seen rejections before.
As long as ETH holds above the $2,885 zone, the bulls remain in control. But since we’re near a strong resistance and the top of the channel, we’ll be waiting for a potential correction or at least a slowdown in momentum before looking for fresh entries.
📌 Key levels to watch:
Resistance: $3,400 – $3,530
Support: $2,885 – $2,755
Let’s stay patient and follow the market’s lead. 🧠
Let me know your thoughts in the comments 👇
📚 Always follow your trading plan regarding entry, risk management, and trade management.
Good luck!
All Strategies Are Good; If Managed Properly!
~Richard Nasr
ETH is testing resistance. False breakout?ETH is gathering liquidity ahead of a possible decline
The gray square is the active buying zone. When the price returned below the 3040 level, a liquidation phase occurred. Against the backdrop of the news, a retest of resistance is forming, but not with the aim of breaking through the level, but with the aim of gathering liquidity for a move to 2960-2913.
A false breakout of resistance could trigger another phase of liquidation (correction) to 2961. A halt should be expected in the 2900 zone.

Can a Bear Market Start With Ethereum At $3,000?Ethereum produced sideways action for 49 days, 7 weeks. Immediately after seeing this I realized the next logical step was a bullish breakout, and the market moved up. But this isn't all. Ethereum is still trading at $3,000, more than $1,800 away from its all-time high.
Now, thinking about the doubt that always creeps up when the market becomes bullish confirmed, I want to clear things up if at least for you. While others can continue to doubt and will continue to do so, many others will even SHORT and lose everything, you will be happy knowing that the market will experience additional growth. You will also be making profits as the market grows. You will be happy because you know for a fact, based on data, that we are set to experience sustained long-term growth.
A bear market can only develop after a bull market. A bull market ends in a major high or new all-time high. Current conditions for ETHUSDT are far from being "peaky." There is no new all-time high. Actually, prices are still relatively low.
First Ethereum needs to challenge its previous all-time high, create a new one and then we can talk about a bear market or correction. We know for a fact that Ethereum is bullish based on recent price action and the chart. We know for a fact that Ethereum will grow because Bitcoin is already high up. Ethereum is the #2 Crypto and what Bitcoin does it tends to follow.
Bitcoin is super strong but this is not to be confused as weakness. Weakness comes when the market has been growing for too long, growth becomes heavy and a drop happens next. Strength happens when the market has been sideways for months, breaks up and produces a major advance (now). This type of pattern predicts additional growth.
Bitcoin is the king and what Bitcoin does the rest follows. You can expect additional growth.
The reason why the bullish cycle is not yet over is because prices are still too low. Many altcoins are trading near all-time lows. Think about it. A bear market develops from all-time highs and bull markets develop from all-time lows. We are only at the start of a major bullish cycle, phase and wave.
The proof is in the chart. A major low was hit 7-April 2025, the lowest since March 2023. This marks the end of the correction and the start of the 2025 bullish phase. I don't know if Ethereum will grow for years or only for a few months. I know with 100% certainty that the Cryptocurrency market will continue to grow. You can bet your house on it.
Thanks a lot for your continued support.
Namaste.

ETH Approaching Major Resistance – Expecting Pullback Hello guys!
Ethereum has been rallying strongly within a well-respected ascending channel, pushing past key levels and now approaching a major resistance zone around $3,900–$4,000.
According to the chart structure, it looks like price could soon react from this resistance, leading to a pullback into the $3,000–$3,200 demand zone, which aligns with the midline of the channel.
This would be a healthy correction before potentially continuing the bullish trend and attempting a clean breakout toward new highs.
ETH is still bullish, but it may need to retest support before continuation.
Watch for a bounce from the $3,000–$3,200 zone for a high-probability long opportunity.

ETHEREUM → Correction to 2900 before growth BINANCE:ETHUSDT is entering a correction after a strong breakout of resistance. At the same time, Bitcoin is falling from 123K to 116K, triggering a pullback across the entire market...
On D1, ETH is facing strong resistance and is not yet ready to break it (it lacks strength after the rally). The most likely scenario after a false breakout is a correction to support. But the main focus is on Bitcoin — will there be a correction or a reversal of the local trend? If the flagship continues its decline, the cryptocurrency market will humbly follow suit.
ETH has a nearest zone of interest at 2913, where liquidity capture could attract buyers, but I do not rule out the possibility that the correction could go much deeper before further growth, for example to 2879-2827 (support on D1).
Resistance levels: 2992, 3041
Support levels: 2913.7, 2879, 2827
Technically, consolidation against a bullish trend. Confirmed support area 2913 - 2879. As part of the correction, the market is interested in capturing liquidity. If, against the backdrop of the current correction, the bulls manage to hold their ground above the specified support, ETH may still surprise us with its growth :)
Best regards, R. Linda!

ETH's Situation, A Comprehensive Analysis !!!As I said, and no one believed, the cup and handle pattern has completed and broken out, which could quickly drive the price above $4000.
previous Analysis
Best regards CobraVanguard.💚

ETH ~ Ready for $3400?Its time foe eth the more time it stays up the more time it goes beautifully! Understand! Such a good move to be coming soon to your doorstep lol
Recent trades on Ethereum / TetherUS Ethereum / TetherUS, Signal auto-generated by our Private Indicator, Serious traders can contact us for information.
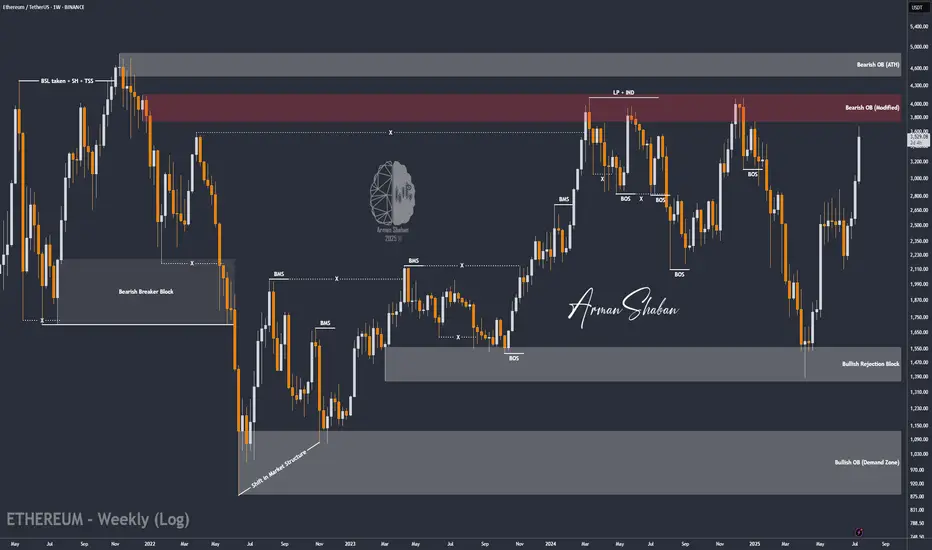
ETH/USDT : $3000 Reached, It's time foe $4000? (READ)By analyzing the Ethereum chart on the weekly timeframe, we can see that the price has finally broken the strong $2700 resistance and pushed toward the next target at $3000! Currently trading around $3150 and now within the $3130–$3440 zone, I expect a short-term rejection from this area. However, given the overall market trend, this level may not hold for long, and we could soon see a breakout toward the next targets at $3500, $3740, $4100, and $4470!
Please support me with your likes and comments to motivate me to share more analysis with you and share your opinion about the possible trend of this chart with me !
Best Regards , Arman Shaban
THE LATEST ANALYSIS :

Eth $2,500 Resistance — Will Harmonic Pattern Trigger a Rally?Ethereum Stuck at $2,500 Resistance — Will Harmonic Pattern Trigger a Rally to $3,400?
Ethereum has been trading in a prolonged consolidation phase around the $2,500 level — a region that has acted as resistance for several weeks. This extended period of sideways action could signify either accumulation or distribution, depending on what comes next. Technically, Ethereum remains capped below major resistance and has yet to confirm a bullish breakout. However, a deeper corrective move followed by a reclaim of key levels could activate a larger harmonic pattern, which presents a potential rally scenario toward the $3,400 region.
-$2,500 Resistance Zone: Price continues to stall at this critical area, signaling indecision
-$2,200 Support Level: A potential bounce zone where bulls may re-enter the market
-Harmonic Pattern Forming: Possible C-to-D leg expansion targeting $3,400, pending confirmation
Ethereum’s price has remained stuck around the $2,500 region, which has evolved into a high time frame resistance. Price has yet to show a decisive breakout, and this extended stay near resistance typically signals one of two things: stealth accumulation before a breakout, or distribution before a breakdown. The direction will become clearer once price action reacts to either a support retest or a break of the current range.
From a bullish perspective, a potential corrective move toward the $2,200 region — a well-established support — would provide a healthy reset for price action. This zone has previously acted as a demand area and aligns closely with the value area low. If Ethereum bounces from this level and reclaims the point of control (POC) around $2,550 — which also aligns with weekly resistance — it would be a strong structural signal.
This sequence of moves could activate a larger harmonic pattern currently visible in Ethereum’s price action. If valid, the market could enter the C-to-D expansion phase of the harmonic setup, targeting the $3,400 region. While this pattern remains speculative and unconfirmed, its structure is valid and aligns with both historical Fibonacci extensions and support/resistance dynamics.
For this pattern to be confirmed, Ethereum must hold the $2,200 support level and produce a strong reclaim of $2,550 backed by volume. Without this confirmation, the idea remains purely speculative and should be approached with caution.
If Ethereum corrects to $2,200 and reclaims $2,550, a bullish C-to-D harmonic expansion may play out targeting $3,400. Until then, ETH remains range-bound and capped under major resistance.

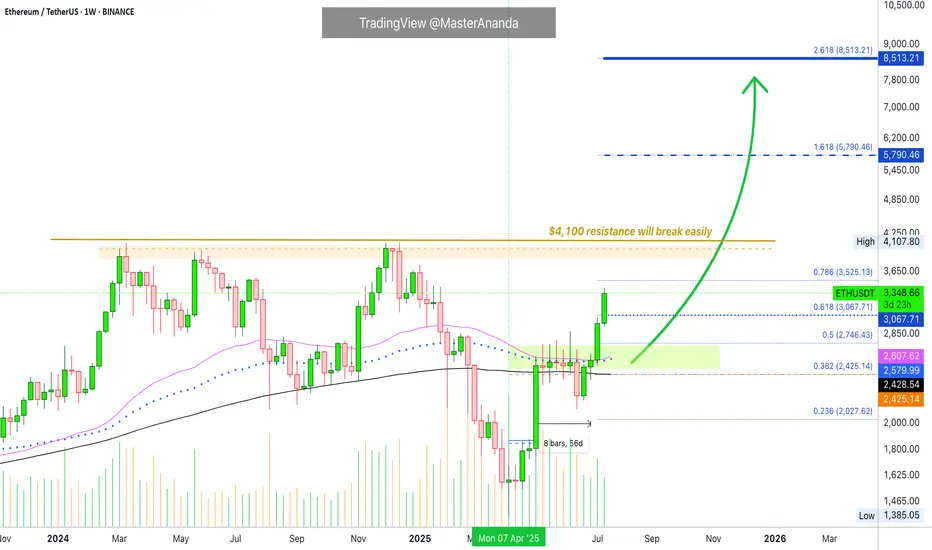
Ethereum · Going beyond $5,790 · $8,513 Next TargetThe eight weeks of consolidation, 56 days, happened as compressed (sandwich style) action right in-between MA200 and EMA55/89.
The EMA55/89 duo worked as resistance while MA200 worked as support.
Before a major move the market always tends to produce a form of shakeout. Sometimes it is call a bear-trap, a shakeout, a liquidity-hunt or stop-loss hunt event, a failed signal, etc.
Here Ether (ETHUSDT) closed below MA200 one week just to recover the next. In this case, we will call it a failed breakdown but we know this is a way to liquidate over leveraged long-traders, also a way to catch unsuspecting bears ready to short. The conclusion is simple, Ether recovered the next week above MA200 and the following week above EMA55/89 which worked as resistance for six weeks. With these levels behind us, the market is full green.
Notice the last two candles, big huge green candle. That is because resistance is no more.
With no resistance to stop prices from rising, Ethereum started to grow and we are now in full blown bullish mode.
The last major high sits at $4,107. This is an easy target, the minimum. Once support is tested the action moves toward resistance and this is where we are headed.
Some people will wonder if resistance will break or hold. Some unsuspecting bears, again, will even short at resistance thinking this is the logical move, they will lose all.
The truth is that this resistance and major high will break easily, we know this based on marketwide action and Bitcoin, Bitcoin is hitting new all-time highs every other day. In this way, we know that Ethereum will soon catch up and do the same.
Many altcoins are moving forward and growing, and some already conquered their December 2024 high price. This is another indication that shows Ether will not stay behind.
Whatever you do when Ethereum goes up, do not short. You can short if you are going to close the short after just a few hours or a few days, but instead of shorting a bullish trend, go LONG and enjoy maximum profits on the way up.
» Ethereum will break $6,000 and move toward $8,500 and beyond in the long-run.
You read it here first.
Thanks a lot for your continued support.
Resistance will break and the altcoins market will continue to grow. Not only for a few months but for a very long time.
When correction time comes, it will last a few months, we will get higher lows and then additional growth. Think of the pattern that came up on Bitcoin but with the altcoins; long-term growth.
Namaste.
ETH | USDWe should monitor the megaphone formation. There's a strong possibility of a move to the targets identified by the breakout. Below, the green line and the megaphone's lower band I identified are excellent entry levels.

DeGRAM | ETHUSD retest of the support level📊 Technical Analysis
● ETH exploded out of the purple median channel, invalidating March-July lower-highs; retest of 3 210 held as a fresh higher-low, confirming trend acceleration.
● Price is now travelling the channel’s outer parallel; flag pole projected from the 2 430→3 210 thrust aligns with the 4 150-4 250 supply zone shown in pink.
💡 Fundamental Analysis
● CME ether futures OI hit a 14-month high on 17 Jul while exchange balances dropped to a five-year low, signalling strong institutional demand and tight float ahead of expected spot-ETF approvals.
✨ Summary
Long 3 210-3 300; hold above 3 210 targets 3 600 → 4 200. Bull view void on a 16 h close below 3 020.
-------------------
Share your opinion in the comments and support the idea with like. Thanks for your support!
Short term next target for ETH - 1100$; Market crash in JuneEthereum will be reaching 2808$ in coming days before month May is closed.
ETH almost reached main liquidity zone for this rally and also 200MA. As soon this level is done - expect another market crash in June.
Next crash will be super fast and most of altcoins will drop even lower.
Target for ETH in month of June is between 1100$ and 1300$.
After this crash we will see altcoin season and ETH will lead it.
We are entering last phase of a bull run. There are about 3 months left before we enter a bear market officially.
Here is previous idea from 1300$ to 2808$

ETH/USDT | The Next Target is $4000 and it's Close! (READ)By analyzing the Ethereum chart on the weekly timeframe, we can see that this cryptocurrency remains one of the strongest major cryptos in the market, continuing its bullish rally despite the overall market correction. It has already hit the next target at $3500, and I believe we might see Ethereum reaching $4000 sooner than expected! Based on previous analyses, if this bullish momentum continues, the next targets will be $3740, $4100, and $4470.
Please support me with your likes and comments to motivate me to share more analysis with you and share your opinion about the possible trend of this chart with me !
Best Regards , Arman Shaban
ETH — 3D OB + FVG Swing Long | #3D | BULLISH1️⃣ Buy zone: 2,500–2,600
2️⃣ TP: 3,280–3,495
Stop: < 2,500
Alert: FVG fill
