Ethereum is Approaching an Important Support Zone!!Hey Traders, in today's trading session we are monitoring ETH/USDT for a buying opportunity around 2,520 zone, Ethereum is trading in an uptrend and currently is in a correction phase in which it is approaching the trend at 2,520 support and resistance area.
Trade safe, Joe.
ETHUSDT.P trade ideas

ETH 2025 Bull Run Price Targets: PT1 $5,800 PT2 $8,725Pectra: Ethereum’s Most Ambitious Upgrade Yet
On May 7, 2025, Ethereum activated the Pectra upgrade, marking its most comprehensive enhancement since the 2022 Merge. This dual-layer upgrade, combining the Prague execution layer and Electra consensus layer, introduced 11 Ethereum Improvement Proposals (EIPs) aimed at boosting scalability, usability, and staking efficiency .
Key features include:
EIP-7702: Introduces account abstraction, enabling wallets to function like smart contracts. This allows for batch transactions, gasless operations, and improved user experiences.
EIP-7251: Raises the staking cap per validator from 32 ETH to 2,048 ETH, streamlining staking operations and catering to institutional participants.
Enhanced Layer-2 Integration: Improves data handling and reduces costs for Layer-2 solutions, fostering greater scalability and efficiency across the Ethereum ecosystem.
These advancements position Ethereum to handle increased demand and support a broader range of decentralized applications, setting the stage for substantial growth.
Institutional and Governmental Embrace of Ethereum
Ethereum's adoption is accelerating among institutional investors and government entities:
Spot Ether ETFs: In May 2024, the U.S. Securities and Exchange Commission approved the first spot Ethereum exchange-traded funds (ETFs), launched by major firms like BlackRock and Fidelity. This milestone has facilitated greater institutional investment and integration of Ethereum into traditional financial markets.
Tokenization of Assets: Financial institutions are leveraging Ethereum's blockchain to tokenize assets, including U.S. Treasury bonds, enhancing transparency and efficiency in asset management.
Federal Initiatives: The U.S. government is exploring the creation of a national digital asset reserve, potentially incorporating Ethereum, signaling a significant shift toward embracing blockchain technologies at the federal level.
These developments underscore Ethereum's growing role as foundational infrastructure in the evolving digital financial landscape.
Price Targets for 2025
Considering the technological advancements and increasing institutional adoption, Ethereum's price is projected to reach:
Price Target 1: $5,800 (1.618 Fib Line)
Price Target 2: $8,725 (Bull Flag PT and near the 2.618 confluence)
These targets reflect a bullish outlook based on Ethereum's enhanced capabilities and its expanding role in global finance.

ETH-----Sell around 2600-2630, target 2550-2580 areaTechnical analysis of ETH contract on May 16:
Today, the large-cycle daily level closed with a small negative line yesterday, and the K-line pattern was a single positive line with continuous negative lines. The price was consolidating at a high level. The attached indicator golden cross was running with a shrinking volume. Although the current trend signal of Ethereum is not as obvious as that of the big cake, we can see that the price rebounded yesterday and did not break upward, which shows that the price is still suppressed to a certain extent; the current pressure position of the short-term hourly chart is near the 2650 area, and the low point support is in the 2425 area. In terms of trend rules, the high point on the 11th was under pressure in the 2630 area, and the 12th was also under pressure in the 2630 area. Although the current price is at a high level, it does not continue the trend of breaking high, so it is easy to be under pressure and retreat.
Therefore, today's ETH short-term contract trading strategy: short in the 2600-2630 area, stop loss in the 2660 area, and target the 2550-2580 area;

2025.05.15 ETHEREUMWe are the SeoVereign Trading Team.
With sharp insight and precise analysis, we regularly share trading ideas on Bitcoin and other major assets—always guided by structure, sentiment, and momentum.
🔔 Follow us to never miss a market update.
The progression up to Wave B has been confirmed, and the current technical structure indicates a high probability of entering Wave C.
Accordingly, a short-term long (buy) bias is suggested.
Projected Wave C Targets (Short-Term):
1st Target: 2,599
2nd Target: 2,626
3rd Target: 2,653
Proper risk management is essential upon entry. Monitor closely for potential selling pressure near each target level.
It is also recommended to confirm directional alignment with macro trends and supporting technical indicators.

ethusdt pay attentionIn my opinion, given the divergence that has occurred in Ethereum and Ethereum's impact on other coins, it seems very logical to exercise caution or at least take some profits.
I tried to combine the final step with an Andrews’ Pitchfork so that the median line and the pitchfork’s bands could act as more precise guides for me.

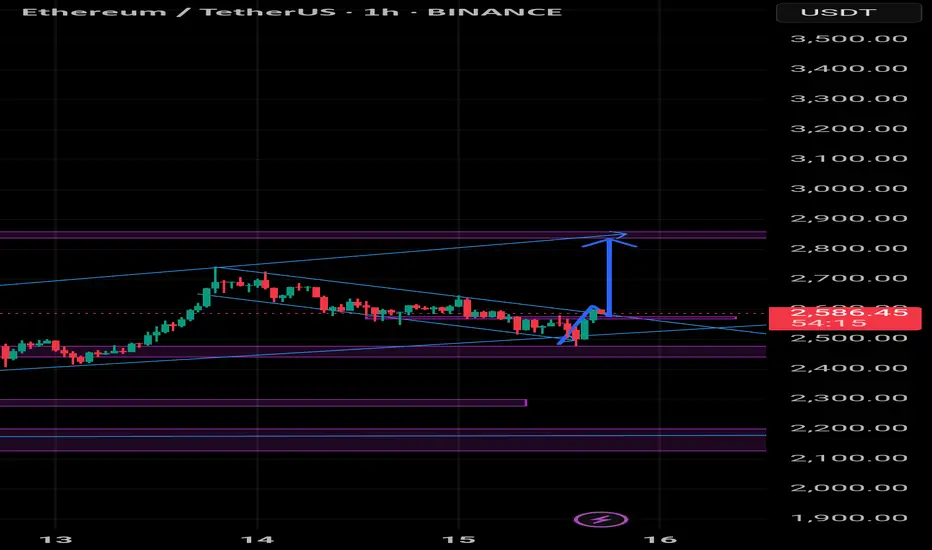
Ethereum Trap Play Complete – Time to Pump!Trap + deviation strategy in play!
Price faked out below structure, collected liquidity, and reclaimed trendline.
Expecting ETH to continue bullish inside the rising channel.
Target: $2738 | SL: Below $2500

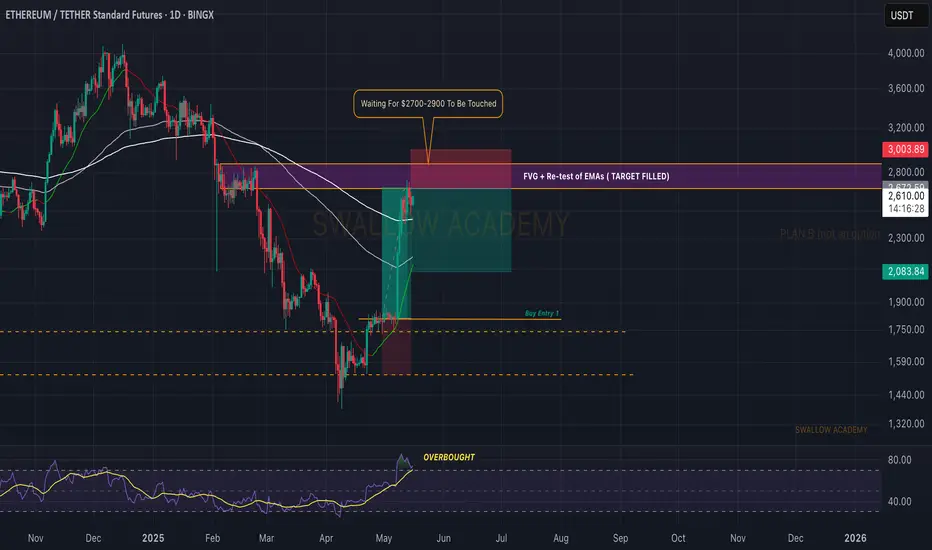
Ethereum (ETH): Major Target Reached | Time For Correction |Ethereum did really good movement where we broke the 200EMA mark and also reached our target area. Now that we have reached this area, we are looking for proper rejection from here, which would correct the RSI and give us another opportunity to get back to current zones and break it properly!
Swallow Academy
ETH Just HODL It – Bullish Breakout Confirmed!
Ethereum is showing textbook bullish behavior after a long accumulation. With the wedge breakout done, eyes are now on clearing $2700 — which could open the gates to a strong rally toward EUROTLX:4K in the coming weeks. 🐂🔥
🎯 First target: $3800
🎯 Second target: $4000
These levels align with historical resistance zones and psychological round numbers.

ETH is still Bullish!!Hello TradingView Family / Fellow Traders. This is Richard, also known as theSignalyst.
📈This week, ETH has been in a correction phase. However it is still overall bullish long-term trading within the rising channel marked in blue.
Moreover, the green zone is a strong demand and structure.
🏹 Thus, the highlighted blue circle is a strong area to look for buy setups as it is the intersection of structure and lower blue trendline acting non-horizontal support.
📚 As per my trading style:
As #ETH retests the blue circle zone, I will be looking for bullish reversal setups (like a double bottom pattern, trendline break , and so on...)
📚 Always follow your trading plan regarding entry, risk management, and trade management.
Good luck!
All Strategies Are Good; If Managed Properly!
~Rich

ETH – Short-Term Breakdown? Long-Term Levels in Play
🚨 CRYPTOCAP:ETH – Short-Term Breakdown? Long-Term Levels in Play
📉 On the 1H chart, ETH is trading inside an ascending channel but appears to be breaking down from it 🕳️ ***OR REVERSAL***
📆 Weekly structure remains intact for now:
🔹 Support zone: $2450–$2490
🔹 Resistance zone: $2850–$2880
🔄 A pullback from around $2730 remains within a healthy range, but the $2400± level is critical for holding bullish structure.
👀 Watch closely—short-term weakness may test macro support!

ETH/USDT Price Downtrend MovementThe price made a H4 strong buy movement and is starting to slowly shift to a small sell retracement...since we started to see LL's forming there is a chance of sell continuation. simple as that. be cautious and remember to always enter the safest only after fakeouts and right confirmations!

Short trade
1Hr TF overview
🟥 Sellside Trade Log
📉 Pair: ETH/USD
🏷️ Type: Intraday | Tokyo Session PM
🧠 Setup: Breakout (Shelf Method)
🆔 Trade ID: #ETHUSD-0514A
📅 Date: Wednesday, 14th May 2025
🕘 Time: 9:00 PM
🔹 Entry Price: 2,585.17
🔹 Profit Target: 2,456.05 (-4.99%)
🔹 Stop Loss: 2,600.06 (+0.58%)
🔹 Risk-Reward Ratio: 8.67
🔍 Reasoning:
A sellside breakout trade was initiated after the price broke decisively below a key horizontal shelf support level, confirming bearish continuation. The shelf method was used to identify price consolidation just above support, followed by a sharp breakdown, signalling a shift in directional bias. Order flow and structure supported a downside expansion, with the entry positioned to exploit clean inefficiency beneath the base.

2 possible scenariosEthereum may continue to rise after correction waves. I showed 2 possible scenarios on the chart. If you zoom in a little bit more on the graph you can see the ABCDE waves more clearly. I think at least these waves will be completed.
* The purpose of my graphic drawings is purely educational.
* What i write here is not an investment advice. Please do your own research before investing in any asset.
* Never take my personal opinions as investment advice, you may lose your money.

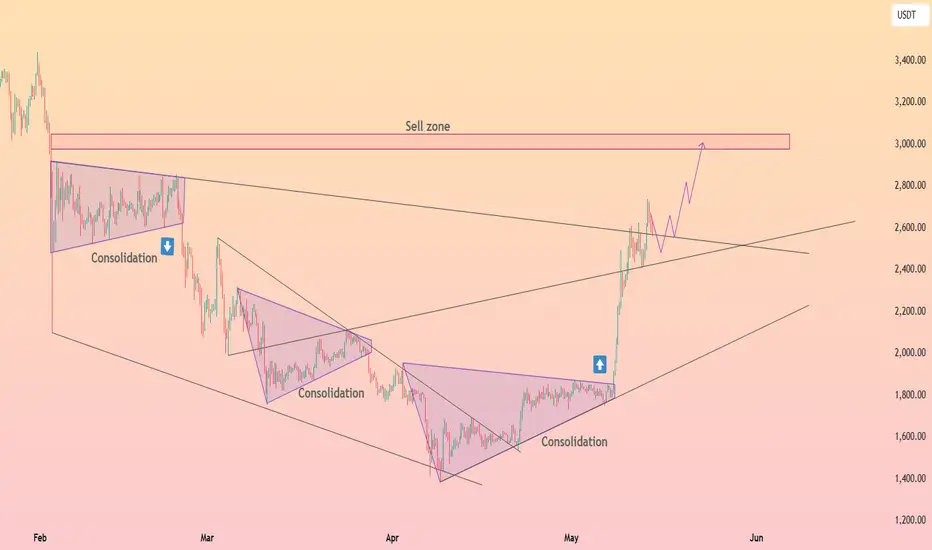
HolderStat┆ETHUSD wedge catapult toward 3kEthereum price tore out of its multi‑month falling wedge and smaller consolidation triangle, blasting through the mid‑2 k range before pausing around 2.7 k. As long as price respects the former wedge roof as trendline support, bulls retain scope to probe the highlighted 2.8‑3.1 k sell zone. A soft pullback into 2.4‑2.5 k would be viewed as a constructive retest rather than trend failure.
Ethereum (ETH): Targeting Bearish CME Gap | $2,349Ethereum is heading towards our target zone, where we will be looking for another support to form and an upward movement to start from there. We will not try to catch that movement here to downward movement but rather wait for our CME to be filled and then look for a buy entry once again.
Swallow Academy

Ethereum Has Bearish DivergenceI was looking for a local top in Ethereum and altcoins, and somehow forgot to mention this yesterday. Ethereum has bearish divergence with over bought RSI on every time frame from the daily down. This was a great topping signal, but also should indicate a bit more downside. The difference now is that I am looking to buy dips, not sell rips on altcoins.

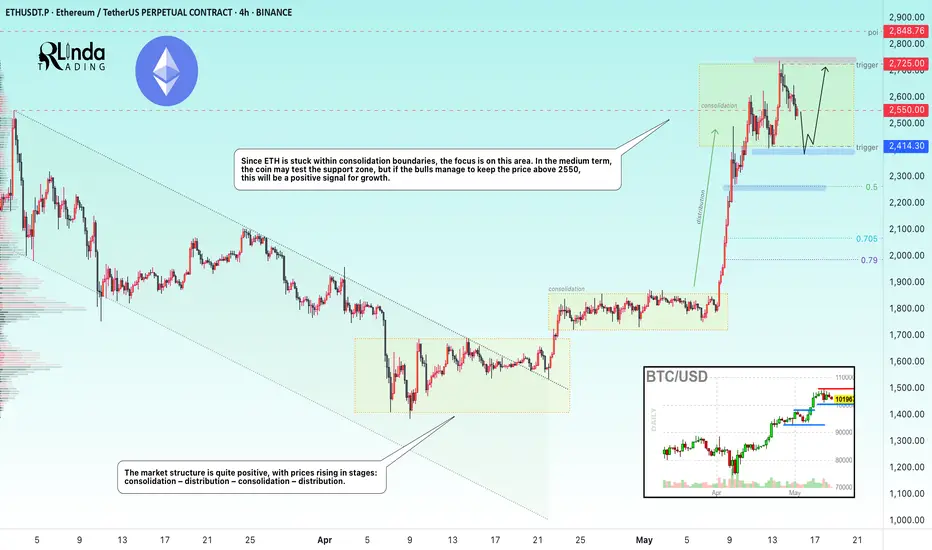
ETHEREUM → Consolidation. Which way will the distribution go?BINANCE:ETHUSDT.P has moved into a consolidation phase after the distribution phase. Focus on the 2414-2725 range. A retest of support is possible during the current phase. Despite the bullish trend, there are risks of a reversal...
ETH has been a fairly unprofitable project over the past few years, with the price hitting one bottom after another. While Bitcoin and altcoins were flying high, ETH has only shown itself to be a bull in the last few days.
In the current phase, the focus is on the consolidation boundaries, as well as the 2550 level. If the bulls keep the market above 2550, then the coin could strengthen to 2725, which would be a positive sign for us that buyers are interested in continued growth.
If ETH continues its correction towards support at 2414, then we will need to monitor the market's reaction to this level. I remain skeptical about ETH due to its weak long-term performance despite a strong fundamental backdrop.
Resistance levels: 2550, 2725
Support levels: 2414, 2260
Further movement will determine the price's exit from consolidation: a breakdown of support means a fall, a breakout of resistance means growth. But the current scenario is trading within the range. If ETH trades near 2725 and forms a pre-breakout consolidation, then we will have a chance for growth.
The opposite scenario is if the price falls below 2550 and begins to test 2414. In this case, sticking to the support level and numerous retests will indicate that the bull market has exhausted its strength and we can expect a correction to 2260-2065.
Best regards, R. Linda!
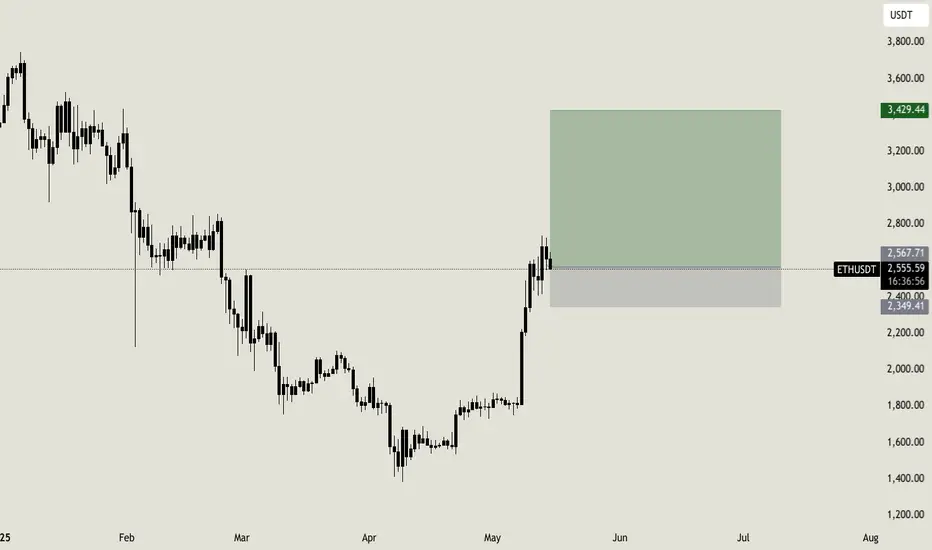
ETH: The moment looks goodEthereum is trying to show strength. The price is surging and it's important for ETH to not loose the 2350 level. This is an important support zone, loosing it will probably lead the price to $1900-1950
ETH Mid-Term TargetETH will make this chickpea, hazelnut, walnut pattern in the medium term.
**Not investment advice

Will ETH Hit 16% Upside With $3,100 In Sight?Hello and greetings to all the crypto enthusiasts, ✌
All previous targets were nailed ✅! Now, let’s dive into a full analysis of the upcoming price potential for Ethereum 🔍📈.
Ethereum continues its bullish trajectory 🚀 following last week’s impressive rally. With strong volume backing the move, a breakout above the $3,000 psychological level appears imminent. I’m targeting a 16% upside with a primary resistance at $3,100 , supported by daily structure, Fibonacci alignment, and a long-term trendline 🔍.
🧨 Our team's main opinion is: 🧨
Ethereum is gaining momentum with a 16% upside in sight — main target at $3,100 after a clean $3,000 breakout 🚀.
Give me some energy !!
✨We invest hours crafting valuable ideas, and your support means everything—feel free to ask questions in the comments! 😊💬
Cheers, Mad Whale. 🐋

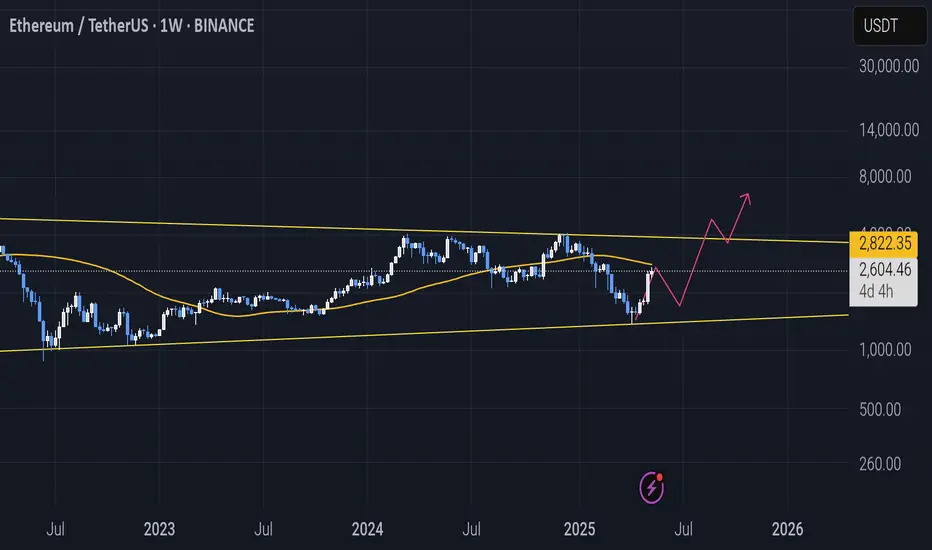
Ethereum Monthly: Bull-Bear Market & Transition Until 2029Ethereum closed five months red, something seen only once in the past in 2018 in a bear market. Needless to say, after such a strong bearish period the market produced an equally strong bull market.
Back in 2018 Ethereum went beyond five months red but this is the only time ever in its history, then now in 2025 this is the longest stretch of continued bearish action. This is good because we know that the market will produce a bull market that is many times stronger, just to balance things out.
These five red months resulted in a long-term higher low.
The bottom was hit at $1,385 in April, last month. This month we already have a full green candle going mid-way through February. All the loses incurred in April and March have been recovered.
The low last month hit levels not seen since March 2023. In March 2023 ETHUSDT was rising but produced first some bearish action; the month closed green. After more than eight months of consolidation it produced a major advance and the highest prices since the 2021 All-Time High.
This time it will be different. Ethereum will be rising steadily, month after month. Rather than sideways-neutral, up-up.
In 2024 there was a double top. March 2024 and December 2024.
In 2025 we will have one top, a blow-off top. So there will be only one chance to sell when prices are really high up.
It will grow steadily month after month as bullish momentum builds up. After several months, we will have a bull run reaching mania levels, euphoria, excitement and a very strong new All-Time High. After this phase is over, the classic bear market in 2026.
The bear market will produce a multi-year low price, then a period of consolidation, sideways-neutral, and then back again bullish, a major bull market in 2029. There will be growth in the transition years, 2027 and 2028. You can equate these with 2023 and 2024.
2022 was the last bear market.
2026 will be the next bear market.
2021 was the last bull market.
2025 is the next bull market.
2023-2024 were the transition years.
2027-2028 will be transition years.
Thank you for reading.
Namaste.

Ethereum Ethusdt Elliott wave impulse
Altseason in July
1bearishing all market
2bitcoin season
3altseason