Long trade
15min TF overview
1min TF entry
🟩 Buyside Trade Log
📅 Date: Saturday, 10th May 2025
🕔 Time: 5:00 AM (LDN Session AM)
🔹 Entry Price: 2367.28
🔹 Profit Target: 2490.46 (+5.20%)
🔹 Stop Loss: 2363.65 (-0.15%)
🔹 Risk-Reward Ratio: 33.83
Reason: Price reached a pivotal support level indicative of a buyside trade. Based on the narrative of supply and demand
1min TF
ETHUSDT.P trade ideas

ETHUSDT near two major weekly support and soon 2200$After so many short open at top:
Now we are looking for rise and pump near these weekly supports and soon our target can hit.
DISCLAIMER: ((trade based on your own decision))
<<press like👍 if you enjoy💚

Ethereum one-month analysis resultThe strong rise of Ethereum will indicate a continued rise in the crypto market, this analysis is 100% accurate and without any price drops.
Sasha Charkhchian

ETH Long on Daily TFAs you can see on the ETH Daily chart, the bottom is in for a long and wild rally because there are many FVGs up there to be filled, harmonic patterns have been formed and all the big liquidity downside has been grabbed. However, it can reach the targets, if the following requirements are met:
1- The volume must kick in!
2- It must first get the hold above 1950-2100 zone. Because this zone is a psychological resistance and there have been many swing lows at this zone, also it's a Weekly pivot low. Thus this zone is very important for ETH to clear.
3- BTC doesn't ruin the party!
4-Good news can accelerate the move!
Therefore the targets are as follow:
TP1: 2000
TP2: 2500
TP3: 3000
TP4: 3500
DON'T get greedy and always trade with cautious!

ETH/USDT 15-Min Chart Analysis – Bullish Setup with Trade PlanThis chart shows a bullish scenario for ETH/USDT on the 15-minute timeframe. Price is consolidating above a key support zone, indicating potential for a strong upward move.
📈 Trade Idea (Long Setup):
Entry Zone: $2,300 – $2,310 (red support zone)
Stop-Loss: Below $2,280
Targets:
🎯 Target 1: $2,388.70
🎯 Target 2: $2,428.47
🎯 Target 3: $2,492.75
🟢 Bias: Bullish (if price respects the support zone and forms reversal confirmation)
Note: Wait for a bullish confirmation candle or bullish divergence before entering. This setup is based on potential support reaction.

Ethereum price increaseThe influx of liquidity and increased demand for Ethereum has caused the price of Ethereum to increase in various technical analysis models. In previous analyses, I had identified the Ethereum price resistance area, according to which the price increased at the specified time, and for a short-term weekly or daily target, we can consider a price of $2,000 per Ethereum unit, but it should be taken into account that this increase is likely to ultimately cause a new price record for this currency in the crypto market.
Sasha Charkhchian

ethusd 1400 EOY then bull run to ATH 4500Huge Triangle pattern of ethereum.
If 1400 till end of year will hold could be as simple as in 2023 the start of bull run in 2026 to new ATH at 4500

ETH/USDT – Waiting for Retracement After Strong Impulse MoveEthereum has shown a strong impulsive rally from the $1,750 zone, breaking through key resistance levels. Now, price is approaching a major supply zone and resistance between $2,450–$2,600, suggesting a potential pullback.
🔹 Technical Highlights:
The current move is a clean vertical impulse leg with little consolidation — a retracement is likely before continuation.
Key Fibonacci retracement levels are drawn from the recent swing low to high:
0.382 Fib: $2,218
0.5 Fib: $2,125 (Buy Zone)
0.618 Fib: $2,067
A support block and potential bullish reaction zone is aligned with the 0.5 Fib level, marked as a “Buy Here” zone.
RSI is deeply overbought (~86), increasing the likelihood of a temporary correction.
🟢 Trade Plan Summary:
Scenario : Price rejects from $2,450–$2,600 resistance, pulls back to the 0.5–0.618 Fib zone, and then resumes bullish momentum.
Buy Zone: Around $2,125, with confluence from Fib, structure, and trendline support.
Buy Zone: Around $2,125, with confluence from Fib 0.5, structure, and support.
Target: New highs above $2,600, possibly heading toward $3,000+ in the medium term.
📌 Outlook: Bullish on confirmation of pullback support — waiting for healthy retracement for re-entry.

ETH vs USDT Crypto Heist - Bullish Breakout Plan!🔥 Thief Trading Style: ETH/USD Bullish Heist Plan 🔥
Dear Money Makers & Market Robbers 🤑,
Ready to pull off a master heist in the Ethereum vs. U.S. Dollar (ETH/USD) crypto market? 📈 Using Thief Trading Style’s technical and fundamental analysis, here’s our strategic plan to ride the bullish wave and escape near the dangerous MA zone. Follow the chart, stick to the plan, and let’s secure those profits! 💪🎯
---
📊 Trade Setup: The Heist Blueprint
- Market: ETH/USD (Crypto) 🌐
- Bias: Bullish Breakout 🌟
- Timeframe: 1D (Swing Trade) ⏰
Entry 📈:
- Breakout Entry: Wait for a confirmed breakout above the Moving Average (MA) at 2500. Set Buy Stop orders just above 2500 to catch the momentum. 🚀
- Pullback Entry: For safer entries, place Buy Limit orders at the most recent 15M/30M swing low (e.g., 2450-2475) for pullback opportunities. 📍
- Pro Tip: Set an alert on TradingView for the 2500 breakout to never miss the move! 🔔
Stop Loss 🛑:
- Breakout Traders: Place your Stop Loss below the recent 1D swing low at 2000 after the breakout confirms. This protects against false moves. ⚠️
- Pullback Traders: Adjust Stop Loss based on your risk tolerance (e.g., 1-2% of account per trade). Use lot size and multiple orders wisely. 📏
- Risk Warning: This is a high-risk heist! Manage your position size and stick to your risk plan. 🔥
Target 🎯:
- Aim for 2900 (near the dangerous MA zone, a risky overbought level with potential consolidation or reversal). 🏴☠️
- Escape Plan: Consider taking profits early if bearish signals (e.g., reversal patterns, high volume) appear near 2900. 💸
Scalpers 👀:
- Focus on Long-side scalps using tight trailing stops. Join swing traders for the full heist or scalp quick moves with high leverage (if your capital allows). 💰
---
📡 Why This Heist Could Work
The ETH/USD market is currently neutral with bullish potential, driven by:
- Technical Signals: Breakout above the 2500 MA signals strong bullish momentum, supported by higher lows on the 1D chart. 📊
- Fundamentals: Positive sentiment in crypto markets, fueled by macroeconomic trends and institutional interest (check COT reports for positioning). 📰
- Seasonal Factors: Crypto often sees Q2 bullish runs, aligning with our setup. 📅
- Intermarket Analysis: Bitcoin’s strength and USD weakness could propel ETH higher. 🌎
For deeper insights, review COT Reports, Geopolitical News, and Sentiment Analysis on platforms like Bloomberg or Cointelegraph. 🔗
---
⚠️ Risk Management: Protect Your Loot
- News Alerts: Avoid new trades during high-impact news (e.g., FOMC, CPI releases) to dodge volatility spikes. 🗞️
- Trailing Stops: Use trailing Stop Loss to lock in profits as price approaches 2900. 🔒
- Position Sizing: Never risk more than 1-2% of your account per trade. Stay disciplined! 🚨
---
💥 Boost the Heist! 💥
Support our Thief Trading Style by liking, commenting, and following for more high-octane trade plans! 🚀 Every boost strengthens our robbery crew, helping us conquer the markets together. 🤝 Let’s make money with ease and style! 🏆🎉

ETHEREUM 2025.05.01***Follow SEOVEREIGN to receive alerts.
**Boosts help SEOVEREIGN analyze more assets.
**Our team regularly publishes analysis reports on the cryptocurrency market.
Asset Overview – Ethereum (ETH)
🎯 Target 1: 1,820
🎯 Target 2: 1,787
Ethereum has currently confirmed the 1.13 Bat Pattern,
indicating a potential short-term downside move.
This may offer an opportunity to consider a short position for futures traders.
Of course, from a long-term perspective, we continue to expect upward momentum for Ethereum.
However, a short-term technical correction is possible, so please take this into account in your trading decisions.
This also serves as a good example for those interested in trading strategies based on harmonic patterns.

#ETH is hitting a major resistance next target $4000! Here's Why#ETH is back inside the legendary 1,883-day trendline, a massive bullish signal for altcoins.
Meanwhile, BTC Dominance is getting rejected from the top, adding fuel to the altcoin momentum.
But there's one key confirmation still needed before we talk about new ATHs for ETH, BTC, and the broader altcoin market:
The 200-Week EMA.
Currently sitting around $2,237, this level needs to be claimed with a strong weekly close. ETH is trading above it right now, but the next 2 days and 4 hours are crucial.
A confirmed breakout here would signal a major shift in ETH's 200-week momentum a structural change that could trigger the next big leg up.
I believe it’s only a matter of time before ETH closes above this level. Once that happens, the next target for CRYPTOCAP:ETH would be $2980, $3488 and $4000!
What do you think?
Drop your thoughts in the comments and hit the like button if you found this valuable.
#PEACE ✌️

ETH BreakoutDown‑trend break
A sharp, high‑volume candle has punched through the descending trend‑line, giving a clear bullish break of structure.
Resistance → Support flip
The 2 100‑2 150 USDT band that capped price earlier is now a potential support zone. A brief retest that holds would keep the bullish scenario intact.
First objective: 2 500‑2 550 USDT
Liquidity sits there (horizontal line on your chart). It’s a logical partial‑take‑profit area.
Expected pullback
The arrow sketches a throwback toward 2 350‑2 400 USDT to form a higher low after the breakout.
Second objective: 2 800‑3 000 USDT
3 000 is a psychological level and aligns with a higher supply zone. If that breaks, the broader 3 300‑3 600 USDT grey box comes into play.
Invalidation
A 4‑hour close back under ~2 100 USDT or a move below the broken trend‑line would kill the bullish thesis.
The arrow shows a classic breakout → retest → continuation roadmap. As long as ~2 100 USDT holds, it’s a reasonable bullish path—but keep tight risk management in case the retest fails.

$ETH just woke up. +30% in 2 days. Straight through resistance.Ethereum just woke up.
+30% in 2 days. Straight through resistance.
Reclaimed EMAs. Volume explosion.
Next stop? $2.6K+ if this momentum holds. Altcoin rotation may have just started.

Ethereum Future: Limited Upside Ahead?Ethereum price dropped roughly 25% since April 2 due to an overall market crash following Trump’s tariffs implementation.
Compared to the almost 40% drop back in February after the first tariff announcement, this time the correction wasn’t as harsh or brutal.
So what can we expect next from Ethereum in the coming weeks?
The main hope for ETH price remains the upcoming Pectra upgrade.
Historically, major Ethereum upgrades have acted as bullish catalysts — for example, ETH roughly doubled in price ahead of both the Merge and the Shanghai upgrade.
If history rhymes, we could see a similar pre-upgrade pump this time too.
However, even if that rally materializes, I expect it to be limited to the $3,000–$3,400 range. The market lacks the kind of momentum or macro tailwinds needed to push ETH beyond 4k in this cycle — unless there’s a major shift in sentiment.
Overall, I remain cautious. The broader crypto market seems to be rolling over, and Ethereum hasn't even reclaimed its ATH.
With the next bear cycle approaching, long-term bullish targets might need to be revised — at least for now.
Short-term bounce possible thanks to Pectra hype, but don’t expect miracles. ETH likely capped below 3.4k unless something big changes.

#ETHUSDT: Price to Touch All Time High $4500 By End Of YearETHUSDT has hit lowest point and we might see a price reversal towards $4500, which would be an all-time high. There are three potential targets for the price to reach.
Good luck and trade safely!
Best regards,
Team Setupsfx_
We’d love for you to support and encourage us!
- Like our ideas
- Share your thoughts
- Share our work if it helps

ETHUSDT: Progressing Well 01/05/2025 UPDATEThe ETHUSDT price is moving well, currently trading above the 1700$ area. We anticipate a continuous rise, potentially reaching $2400 first and then $3000. Our swing target remains at $4500. The current price behaviour and momentum suggest an extremely bullish outlook.
Good luck and trade safely!
Thank you for your unwavering support! 😊
If you’d like to contribute, here are a few ways you can help us:
- Like our ideas
- Comment on our ideas
- Share our ideas
Team Setupsfx_
❤️🚀

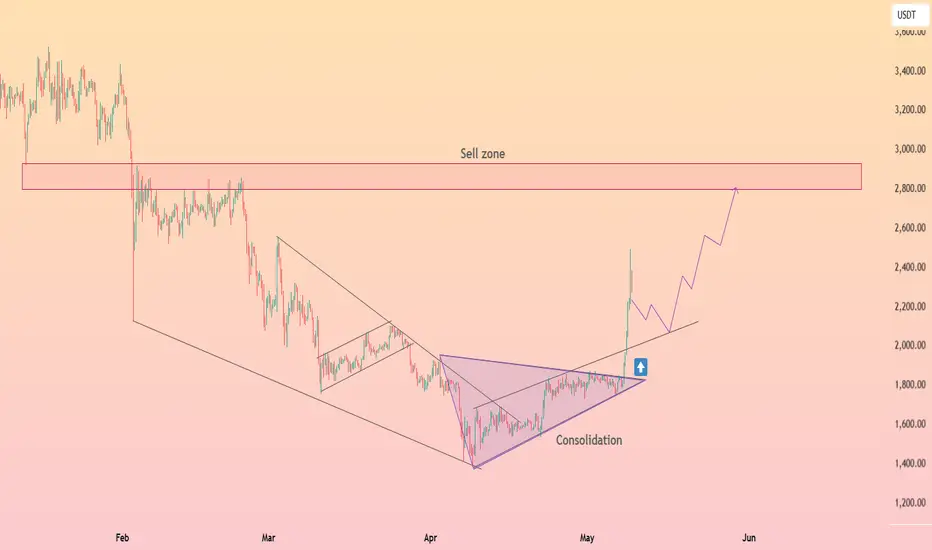
HolderStat┆ETHUSD breakout toward key resistanceAfter weeks of consolidation inside a symmetrical triangle, ETH has confirmed a bullish breakout with strong momentum. Price is now aiming for the $2800–$3000 sell zone, a key level from previous distribution. The breakout suggests increased buying pressure and a potential mid-term rally continuation.
💡 If ETH holds above the $1800 breakout zone, we could see a gradual climb toward $2800 in the coming weeks.
ETH ANALYSIS (12H)This analysis is an update of the analysis you see in the "Related publications" section
Ethereum has finally reached the flip zone.
Pay close attention: Ethereum dominance is sitting on monthly support, which is a level with strong bounce potential.
We have two possible scenarios for Ethereum | either it breaks through the flip zone, or it makes a correction and turns bullish again from around the bottom.
⚠️ What’s clear is that shorting Ethereum is risky and doesn’t make sense!
For risk management, please don't forget stop loss and capital management
When we reach the first target, save some profit and then change the stop to entry
Comment if you have any questions
Thank You

Buy Trade Strategy for ETH: Powering the Future of Web3 and DeFiDescription:
This trading idea centers on ETH (Ethereum), the second-largest cryptocurrency by market cap and the backbone of the decentralized application (dApp) ecosystem. ETH is not just a digital currency, but a programmable blockchain supporting smart contracts, DeFi platforms, NFTs, DAOs, and much more. With the successful transition to Proof of Stake through the Ethereum 2.0 upgrade, the network has significantly improved its scalability and energy efficiency, reinforcing its long-term viability. Institutional interest, widespread developer activity, and real-world utility make ETH a cornerstone asset in the blockchain space, especially as Web3 adoption accelerates globally.
Despite its strong fundamentals, the crypto market remains highly volatile and susceptible to macroeconomic trends, technological developments, and regulatory changes. Therefore, even well-established assets like ETH carry risks that investors should carefully consider.
Disclaimer:
This trading idea is provided for educational purposes only and does not constitute financial advice. Trading or investing in cryptocurrencies like ETH involves substantial risk, including the potential for complete loss of capital. Always conduct your own research, evaluate your financial situation, and consult a licensed financial advisor before making investment decisions. Past performance is not indicative of future results.

After a 37% Surge, Is Ethereum Still a Buy...?Ethereum Breaks Key Resistance, Signaling Potential Trend Reversal
Ethereum has delivered two significant technical signals indicating a potential trend reversal. The first is a breakout above the longstanding downtrend line, and the second is the breach of the critical \$2,100 resistance level. These developments suggest growing bullish momentum in the market.
With both confirmation signals in place, Ethereum appears poised for further upside. Traders may now look for a potential pullback or retest around the \$2,100 level, which could serve as a strategic entry point for long positions.
If this level holds as new support, the next target to watch is the \$2,800 mark, aligning with broader market expectations and previous price structure zones.
As always, traders should monitor price action closely and manage risk accordingly in case of volatility around key levels.

ETHUSDT UPDATE I was shared the idea almost weeks ago, now im fullyout of this trade guys,
need your support guyes to share many ideas like that,
comment if you like it.

$eth tl breakoutBINANCE:ETHUSDT about to break a multi month trendline, paying close attention to a 4h/12h/1d close above it
fibs as tps with previous highs as confluence, pretty straightforward setup
invalidation on a failed breakout

THE CLEAR SKY OF SHORTS POS by ETH As we considered "IF"
The air will go to the zone, then it will need to enter the zone of the previous range of the structure
Therefore, zone 2324 will be as a decision zone.
The zone's fixation and the impossibility of a disruption will give us the zone 2555-2822
Where would I consider the real work on altas?
That is, a reset...below 2k$.
