ETHEREUM BREAKOUT CONFIRMED!Hey Traders!
If you’re finding value in this analysis, smash that 👍 and hit Follow for high-accuracy trade setups that actually deliver!
After months of consolidation inside this massive symmetrical triangle, ETH finally breaks out on the daily chart—and this could be the spark for the next major rally! 🔥
📈 Structure: Symmetrical Triangle
✅ Breakout Confirmed
📍 CMP: ~$2,760
🎯 Next Major Target: $5,000+
This is the breakout bulls have been waiting for! If momentum sustains, ETH could enter price discovery territory soon. Buckle up—the real move might just be beginning. 🚀
Let’s see how far it runs from here!
Drop your targets in the comments 👇
ETHUSDT.P trade ideas

The Loudmouth Pattern: It Yells, We Trade!
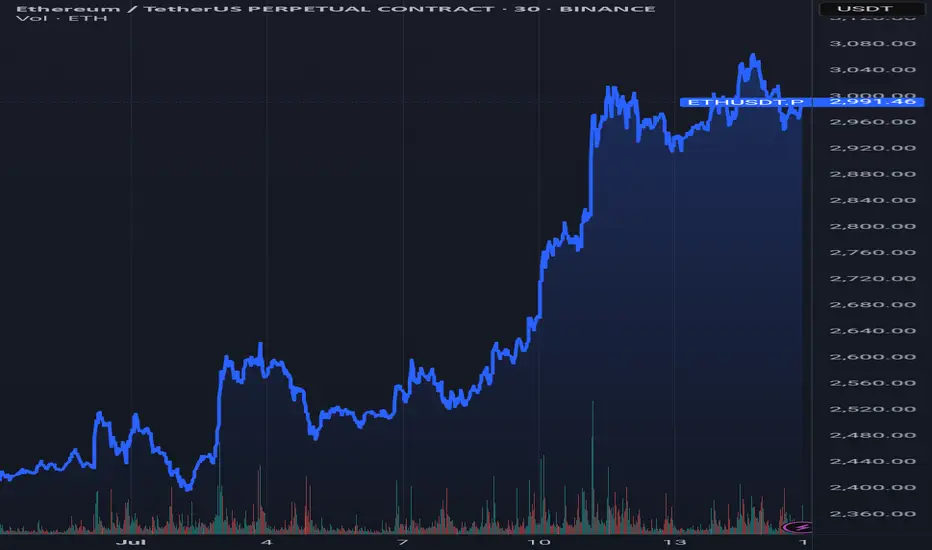
On the 30-minute chart, ETH is forming a classic Broadening Formation – or as some traders like to call it, “The Big Mouth Pattern” 😄. It’s noisy, unpredictable at first glance, but when it speaks, you’d better listen.
Right now, price is moving through the bullish leg of this setup, and if momentum holds, we’re eyeing the $4,000 psychological level, followed by the $4,120 – $4,170 supply zone.
🔹 Bullish Scenario (our expected outlook):
🎯 Target 1: $4,000
🟩 Main Resistance: $4,120 – $4,170
❌ Invalidation: Confirmed close below $2,946
If price breaks and holds below that red support zone, this setup gets thrown out the window.
📊 Risk Management:
Scale in on pullbacks – if structure remains valid
No chasing without confirmation
Keep risk under 1% of total capital
📈 The market’s big mouth is open – and until it closes below $2,946, we’re listening for bullish signals. 🤑

DeGRAM | ETHUSD above the resistance area📊 Technical Analysis
● Price burst through the 12-week compression roof, converting the 2 990 supply into support and printing the strongest close since March.
● The pull-back just retested both the purple trend-fan and the 2 960 flip zone; the active rising channel and flag depth map the next magnet at 3 410.
💡 Fundamental Analysis
● SEC’s 12 Jul request for updated spot-ETH ETF S-1s hints at imminent approval, fuelling fresh inflows.
● Glassnode reports the largest daily net-staking deposit since April, reducing exchange float and adding bid pressure.
✨ Summary
Long 2 960-3 000; holding above 2 990 targets 3 110 → 3 410. Bias void on an H4 close below 2 860.
-------------------
Share your opinion in the comments and support the idea with like. Thanks for your support!

ETHUSDTThis movement downtrend. If breake 2.790 movr to 3.500$ but breke 2.200 move trend to 1.500$.

ETH Buy Zone AlertETH Buy Zone Alert 🚨 | Eyes on 3340 & 3291
Ethereum is entering a strong demand zone between $3340 and $3291 — this could be a great long opportunity if price reacts well.
Short-term targets to watch: $3420 and then $3500.
Don’t sleep on this setup — keep it on your radar! 👀
📈 Follow for more actionable trade setups and real-time market updates.

#ETHUSDT: Time For Big Price Distribution! Get Ready $5000ETH is currently in distribution and is on our target list. We expect a smooth price movement, potentially reaching $3100, $3800, and $5000. Use the entry zone to take a position; anything below the entry will invalidate the idea. Please use accurate risk management while trading.
Like, comment, and share this idea to encourage us to post more.
Team Setupsfx_

#ETH Update #4 – July 17, 2025#ETH Update #4 – July 17, 2025
Ethereum is currently facing a significant resistance zone. The recent bullish move has been very steep, which often leads to a correction. If that happens, the first potential retracement level is around $3,010.
If Ethereum continues to rally without correcting, the next upside target is $3,700. However, USDT Dominance has reached a support level. If that support holds, we could see capital rotation into USDT, accelerating a pullback in ETH.
At this point, a slowdown in Ethereum’s momentum is likely. If you're holding altcoins, it might be a good moment to take some profits.

Ethereum's Road to $7500 – Strategic Entries & Profit Optimizati🔵 Entry Zone: My first position is placed at $2225.5, aligning with a strong support level, while a secondary entry at $1857.5 serves as an additional safeguard against unexpected market swings—lowering my average purchase price and protecting capital.
💰 Profit-Taking Strategy: For low-risk traders, securing a 40% profit from the first entry is a prudent move to lock in gains early. However, my long-term target remains ambitious.
🚀 Main Target: Based on valuation models and fundamental news, Ethereum’s upside potential points toward $7500. However, I personally plan to secure 90% of my holdings at $6000, ensuring strong profit realization while leaving room for further upside.
This setup balances risk management, smart positioning, and strategic profit optimization. Let’s see how ETH’s trajectory unfolds!
Entry1: 2225.5
Entry 2: 1857.5
If your second entry is successful, you are required to withdraw 50 to 70 percent of your capital to maintain your capital. I will definitely update this setup.

ETH LONG TRADELooking for a retest of approximately $3000 for a bounce off the top of the prior channel.

Ethereum (ETH): Targeting $3300-$3400 | Detecting Buy ZonesIt's not a secret to anyone that we are targeting $3300-$3400 next on ETH, where we have detected 2 potential buy zones for us.
One of the zones is near the lower support area, where we should see proper MSB in order to enter into a trade, which would mean a switch in trend.
The second entry is upon forming BOS on upper zones, which would be the ideal buying entry for us if performed well (I mean the break of structure).
Swallow Academy

#ETHUSDT: Currently On The Way Towards Filling The FVG?ETCUSDT is currently experiencing a significant correction as the price approaches a pivotal juncture where a substantial bullish price reversal is anticipated, potentially propelling it to new all-time highs or even surpassing them. It is imperative to exercise meticulous risk management and conduct your own thorough analysis before engaging in any cryptocurrency trading or investment activities.
Should the price indeed undergo a major correction, it is likely to decline to our second designated area, where it is anticipated to fill the liquidity gap and subsequently reverse course, continuing its trajectory towards our established targets.
Please consider this analysis as a secondary influence only, or even solely for educational purposes. It is crucial to conduct your own independent analysis and risk management prior to engaging in any cryptocurrency trading or investment endeavours, as they inherently carry substantial financial risks.
We extend our best wishes and encourage you to trade safely and responsibly.
Should you wish to demonstrate your support, you are welcome to express your appreciation through likes, comments, or sharing this information.
Thank you for your consideration.
Have a pleasant weekend.
Team Setupsfx_

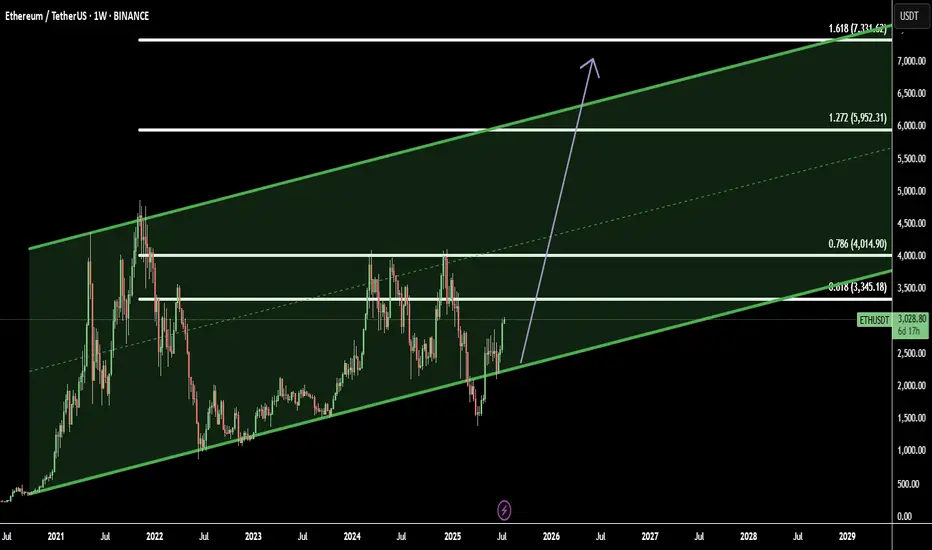
Ethereum in Ascending Channel: Targeting Weekly Breakout ZonesEthereum (ETHUSD) is currently trading within a well-defined ascending channel on the weekly timeframe, indicating sustained bullish momentum. This structure suggests higher lows and higher highs, consistent with a long-term uptrend.
Based on this formation, I’ve identified four key target zones as ETH continues to respect the channel boundaries:
Target 3345.18: Initial resistance area, likely a short-term reaction zone
Target 4014.90: Mid-channel resistance — potential consolidation point
Target 5952.31: Upper bound of the channel — critical breakout test
Target 7331.62: Extension level — price discovery zone if breakout is confirmed
Traders should monitor price action closely near each level. A strong breakout above the channel top could signal continuation toward uncharted highs, while a breakdown may invalidate the pattern.
Disclaimer: This is not financial advice. Please do your own research and manage risk accordingly.
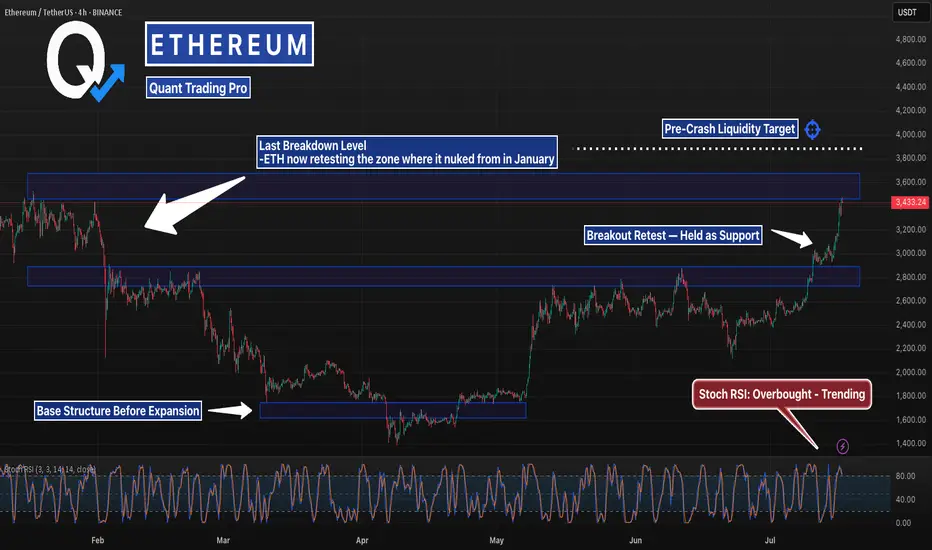
This Level Crashed ETH Last Time… It’s BackETH just blasted back into the same zone it collapsed from in January — but this time the structure underneath is stronger, tighter, and holding.
Stoch RSI is stretched, but bullish momentum remains intact. If it clears $3,870, lights out.
#Ethereum #ETHUSD #CryptoCharts #BreakoutLevels #ChartAnalysis #TradingView #QuantTradingPro #CryptoTraders #BacktestEverything
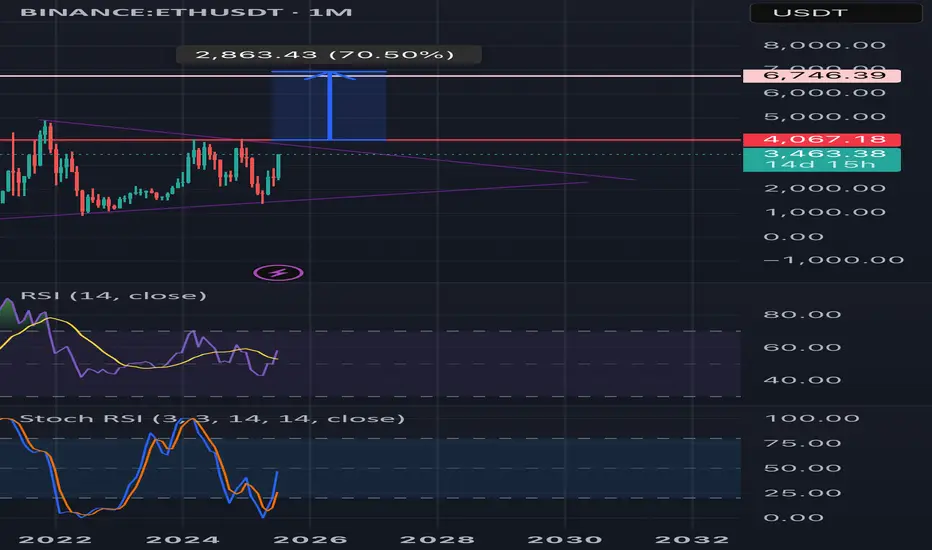
Upward breakout for ETH monthly?🟣 Ethereum Monthly Timeframe Analysis – Large Symmetrical Triangle
📌 Current Situation:
• On the monthly chart (1M), Ethereum (ETH) has formed a large symmetrical triangle pattern.
• This pattern typically signals a major price consolidation before a significant move.
• The descending resistance line connects the 2021 all-time high to recent lower highs.
• The ascending support line is drawn from the 2018 low through the 2022 bottom.
• Price is nearing the apex of the triangle, indicating a breakout is likely soon.
⸻
🔼 Bullish Scenario (Breakout to the Upside):
If ETH breaks above the triangle resistance and confirms the move:
✅ Signs of a Bullish Continuation:
• Strong breakout above the $4,000–$4,500 zone
• Increased volume confirming breakout
• Price holds above resistance-turned-support
🎯 Potential Price Targets by 2027 (based on triangle height & Fibonacci projections):
1. Target 1: $6,800 – $7,500
2. Target 2: $9,000 – $10,000
3. Long-term Target: $12,000 – $15,000 (if macro bull market continues)
⸻
🔽 Bearish Scenario (Fakeout or Breakdown):
If the breakout fails or price breaks down:
• ETH could revisit lower supports around $2,000 or even $1,400
• Bullish momentum delayed until another strong base forms
⸻
🔍 Conclusion:
• This triangle could mark the beginning of a major rally into 2027, especially if supported by fundamentals (e.g., ETF approval, DeFi growth).
• Wait for a confirmed breakout with volume and retest before entering a long-term position.
HolderStat┆ETHUSD prepare for a breakthroughBINANCE:ETHUSDT is trending upward with strong conviction after triangle breakouts and clearing the $2,900 level. Structure points toward a move into the $3,300–$3,400 region. The trend is reinforced by repeated bullish retests and channel momentum.

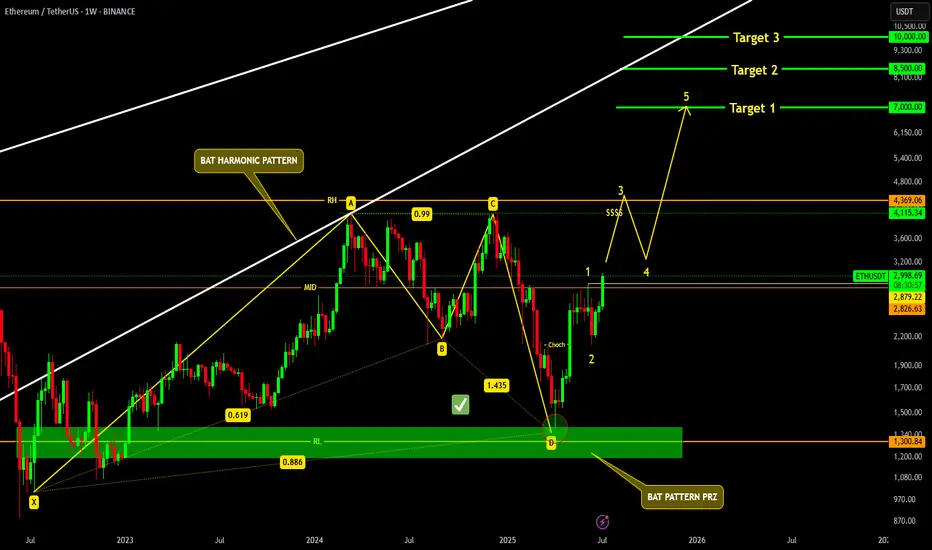
ETHEREUM READY TO SMASH 10K !!!AS per previous Ethereum update, CRYPTOCAP:ETH successfully tapped our Bat PRZ and making it's way to the top.
as per micro elliott wave count, we will see Ethereum slamming 7k, and could potentially smash 10k in coming months.
Ethereum · No Reason To Stop · Will Continue RisingEthereum will continue rising. Remember Ether is number two and it is awesome, to start, and it follows Bitcoin like darkness follows the light. There is no reason for Ether to move down. There is no necessity for ETH to stop its major advance, in fact, it has been lagging behind and it needs to catch up. Bitcoin is waiting and will continue waiting but it won't wait forever so Ethereum must wake up and is waking up. We are going up.
Ethereum has grown 165% since its 7-April low. This is more than XRP and its capital is twice as much. Boom! The best part? Ethereum will continue growing straight up for weeks and months. It needs to be trading at a new all-time high as soon as possible just so that the market can feel at ease and know, once again, that Crypto is here to stay.
What has been suppressed can't stay suppressed forever. Crypto went through a fight but challenges only made us that much stronger. We are now happy and grateful for everything that we went through because we know that we can take anything the world throws at us.
The chart. Green, green, green straight up. Two months of consolidation. That's the key. ETHUSDT went sideways for almost two months and this reveals what comes next. The advance outside the consolidation range has been happening for 8 days. 60 days of sideways can support at least an entire month of growth. When the entire month is consumed, we can expect a retrace, nothing more, followed by additional growth.
In short, Ethereum will continue rising. If you see a shakeout, know that growth will always resume in a matter of days. If you see a drop, know that this is a bear-trap, the bulls now own the game. If you are in doubt, come read my articles and I will publish something that you will understand and agree is right, so you can continue holding until you can reach the big prize.
The time to sell will come, but it isn't now. Right now is the time to hold strong. Not only Ethereum, but Cardano, XRP, BTC, Dogecoin, Solana and the rest of the altcoins. This is only the start.
I expect Ether will continue rising. $8,000 now looks like such an easy target...
Very good indeed. If you enjoy the content, follow me.
Namaste.

ETH ~ It Gives you a chance ~ $4000 soon!ETH will soon go to $4000 bidding Lower TF for actual buys and shorts to stay till there, will post the buy moves soon!

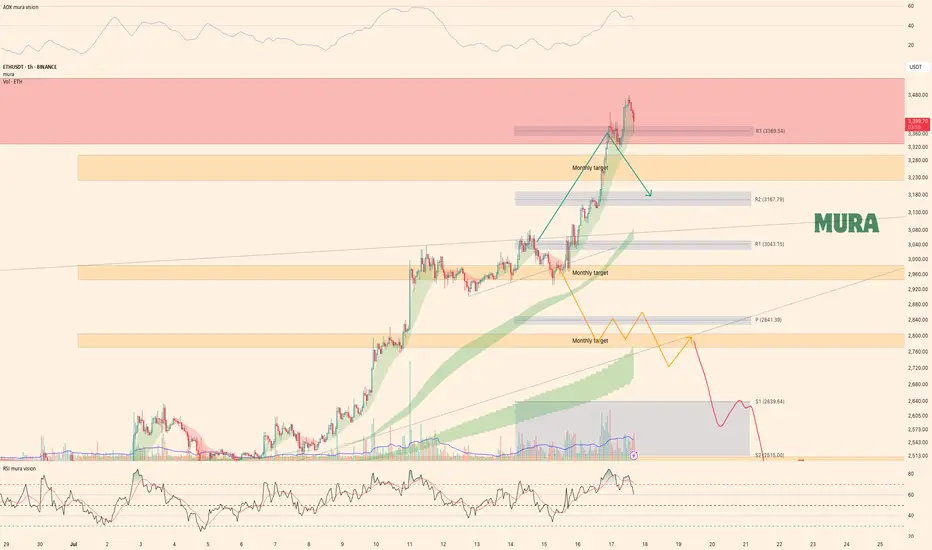
Ethereum Weekly UpdateAs anticipated, Ethereum has achieved all weekly targets, perfectly following our bullish (green) scenario. Price currently tests a key resistance zone after:
Holding critical monthly support at $2,966
Rallying to our projected upside targets
Technical Observations:
Bearish Divergence (4H RSI)
Trend Weakness (H1 & H4 ADX decline)
Seller Reaction at resistance, yet holding above $3,300
Key Levels:
Break above resistance → Continuation likely
Break below $3,300 → Pullback toward $3,000-3,100 expected
Conclusion:
While the trend remains intact, weakening momentum signals potential short-term correction. Trade plan aligns with Monday’s video analysis.
$eth/usdt short swing zoneth: htf/ltf liq + stop hunt (1.204 fibonacci) + ote zone (88.6/91.5 fibonacci) + bat harmonic

ETH – $7k Target in Sight
7k incoming on CRYPTOCAP:ETH —timing is up in the air, but the chart looks stellar.
A decisive break above $3,500 should kick off aggressive expansion.
Meanwhile, ETHBTC has been rallying hard off its lows; I’m eyeing a 50% gain against BTC over the next 2–3 months.
Holding through this strength makes sense—it’s been a long time since we’ve seen these setups.

Ethereum’s Next Fair Value Gap is $3.8K — And the Road to $26K 🚀 Ethereum’s Next Fair Value Gap is $3.8K — And the Road to $26K Remains On Track
Ethereum ( CRYPTOCAP:ETH ) just reclaimed key structure — and despite a temporary pullback, all signals remain aligned for a parabolic breakout toward $26,000 this cycle.
Here’s why the next Fair Value Gap (FVG) sits near $3.8K, and why the Schiff Pitchfork structure still implies Ethereum is coiling for exponential upside in the coming months.
🔹 The $3.8K FVG: ETH’s Next Magnet
Looking at the daily chart:
The $3.8K zone is a clear untapped FVG (Fair Value Gap) from late 2021, created by a sharp breakdown candle that never got properly filled.
ETH is currently consolidating just below the $3.1K resistance band, and once that breaks, liquidity will naturally gravitate toward the next inefficiency — at $3,800–3,900.
This gap aligns with a previous supply zone and intersects with the upper resistance trendline from late 2021, creating a powerful magnet for price once momentum returns.
🔹 All-Time Schiff Pitchfork Still Intact
The Schiff Pitchfork structure drawn from Ethereum’s 2018 low through its COVID crash low and 2021 all-time high paints a highly disciplined range:
ETH is respecting the midline of the lower channel and recently bounced off the support of the median zone, with price now grinding higher within the ascending structure.
The upper band of the pitchfork intersects with price in late 2025 near the $26,000–28,000 zone, forming a natural cycle top target.
Historically, Ethereum has respected this long-term structure remarkably well — and this current move is no different.
🔹 Moving Averages & Bullish Market Structure
ETH recently flashed a Golden Cross — the 50-day SMA crossing above the 200-day SMA — which historically front-runs explosive upside in post-halving years.
All major SMAs (20/50/100/200) are now curling upward, creating a supportive launchpad.
Price is breaking out of the consolidation wedge that defined Q2 2025 — and has room to run toward $3.8K before meeting major overhead resistance.
🔹 Post-Halving Explosiveness
Let’s not forget: we’re in a post-halving year — and ETH has a consistent pattern of multiplying 5x–10x in the 9–12 months following Bitcoin halving events:
In 2017 (after 2016 halving): ETH went from ~$8 to $1,400 — nearly 175x.
In 2021 (after 2020 halving): ETH went from ~$120 to $4,800 — roughly 40x.
A move from the current ~$3K level to $26,000 is just an 8.5x — well within historical precedent.
🔹 Macro Tailwinds: ETH ETFs & Institutional Flows
BlackRock, Fidelity, and other asset managers are positioning Ethereum ETFs for approval, which would unlock billions in institutional inflows.
A staking ETF would dramatically compress supply — Ethereum already has over 27% of its supply locked — amplifying upside through supply-demand squeeze.
Meanwhile, stablecoin settlement volume is growing faster than Visa — all powered by Ethereum infrastructure.
🔹 Timing the Move: August to December Explosion?
The verticals on your chart highlight key windows:
A breakout window between early August and mid-September coincides with both macro liquidity injections and historical altseason patterns.
If ETH hits $3.8K by August, the runway to $8K–$14K opens by October, with $26K still well within reach by December 2025, in line with your pitchfork’s top boundary.
🟣 Summary: Ethereum’s Next Stop Is $3.8K — Then Moon
✅ Untapped FVG magnet at $3.8K
✅ Schiff Pitchfork upper boundary intersects near $26K
✅ Post-halving year + Golden Cross = Explosive setup
✅ ETH ETF narrative just beginning
✅ Structural breakout from consolidation wedge
Ethereum is no longer just the base layer of DeFi — it’s becoming the base layer of global financial infrastructure. And price hasn’t yet priced that in.
"If the internet had a price, it would be Ethereum."
Don’t fade this breakout. We’re still early.

Eth killer Today was a solid trading day with some interesting moves across the markets:
S&P 500: The market trended upwards from the open, gradually moving into and above the prior day’s value area, closing near the high of that range.
NASDAQ 100: After some initial back-and-forth, it climbed above the prior day’s high and value area, showing strength into the close.
Russell 2000: This market was quite choppy and balanced for a good part of the session, but eventually pushed up to close near the prior value area high.
Gold: It stayed range-bound, moving between the CVA high and the prior day’s value area without breaking out.