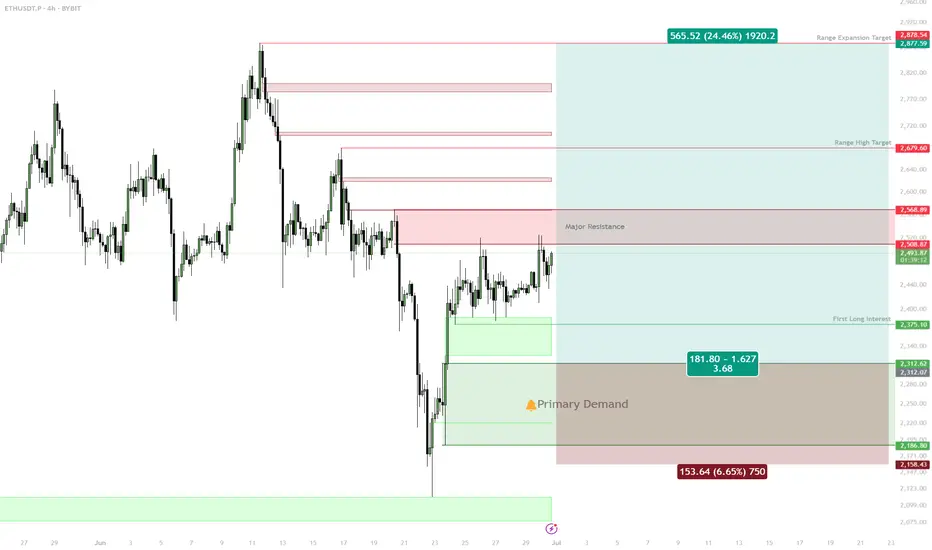
#ETHUSDT: Currently On The Way Towards Filling The FVG?ETCUSDT is currently experiencing a significant correction as the price approaches a pivotal juncture where a substantial bullish price reversal is anticipated, potentially propelling it to new all-time highs or even surpassing them. It is imperative to exercise meticulous risk management and conduct your own thorough analysis before engaging in any cryptocurrency trading or investment activities.
Should the price indeed undergo a major correction, it is likely to decline to our second designated area, where it is anticipated to fill the liquidity gap and subsequently reverse course, continuing its trajectory towards our established targets.
Please consider this analysis as a secondary influence only, or even solely for educational purposes. It is crucial to conduct your own independent analysis and risk management prior to engaging in any cryptocurrency trading or investment endeavours, as they inherently carry substantial financial risks.
We extend our best wishes and encourage you to trade safely and responsibly.
Should you wish to demonstrate your support, you are welcome to express your appreciation through likes, comments, or sharing this information.
Thank you for your consideration.
Have a pleasant weekend.
Team Setupsfx_
ETHUSDT.P trade ideas

You need smol Scalps for ETH!ETH SMOL scalps but u know it takes your liquidity on top blowing ur accounf! Keep mindful where the trade goes! good short oppurtunity!
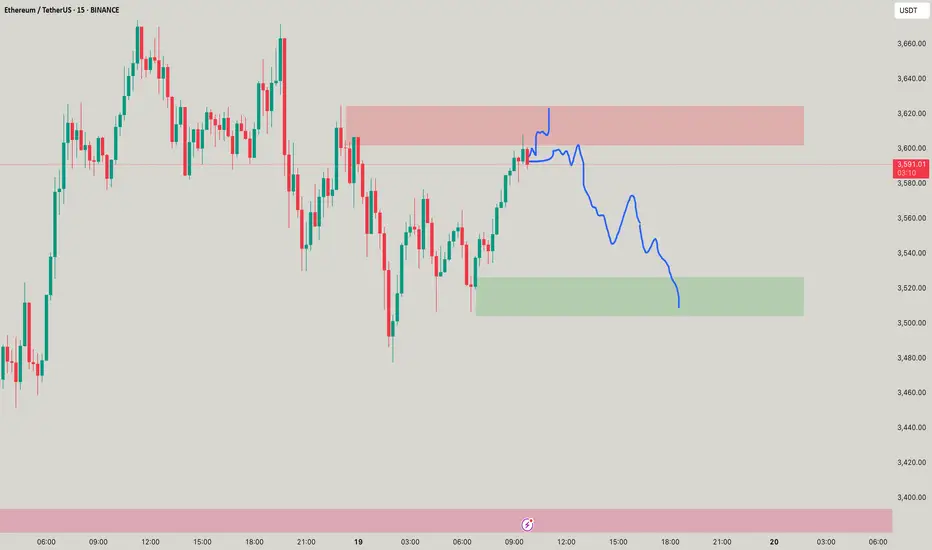
ETH 3rd Attempt at Resistance — Breakout or Bull Trap?Ethereum is back at a major level that’s rejected it twice already. A breakout here could finally end the range and send price into discovery — but if history repeats, this might be the ultimate fakeout before a sharp reversal. All eyes on the next few candles.

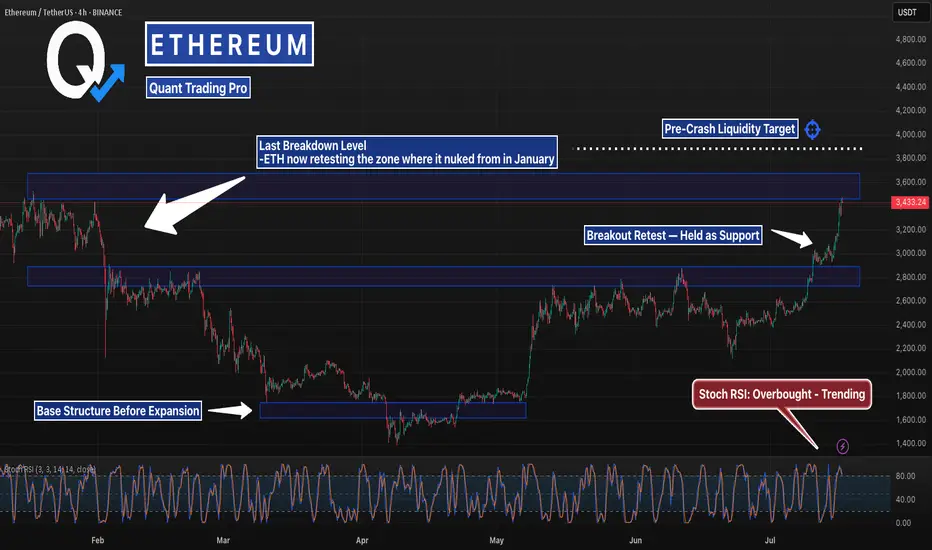
This Level Crashed ETH Last Time… It’s BackETH just blasted back into the same zone it collapsed from in January — but this time the structure underneath is stronger, tighter, and holding.
Stoch RSI is stretched, but bullish momentum remains intact. If it clears $3,870, lights out.
#Ethereum #ETHUSD #CryptoCharts #BreakoutLevels #ChartAnalysis #TradingView #QuantTradingPro #CryptoTraders #BacktestEverything
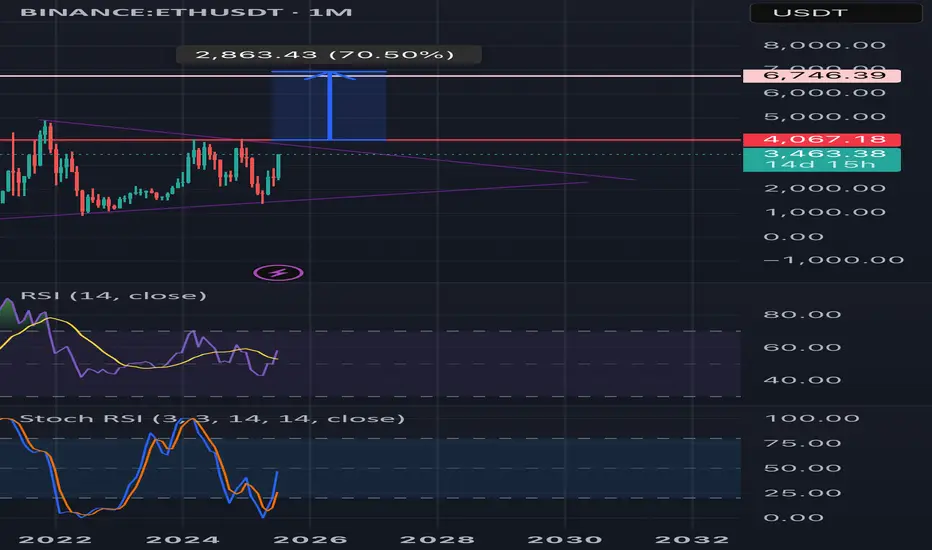
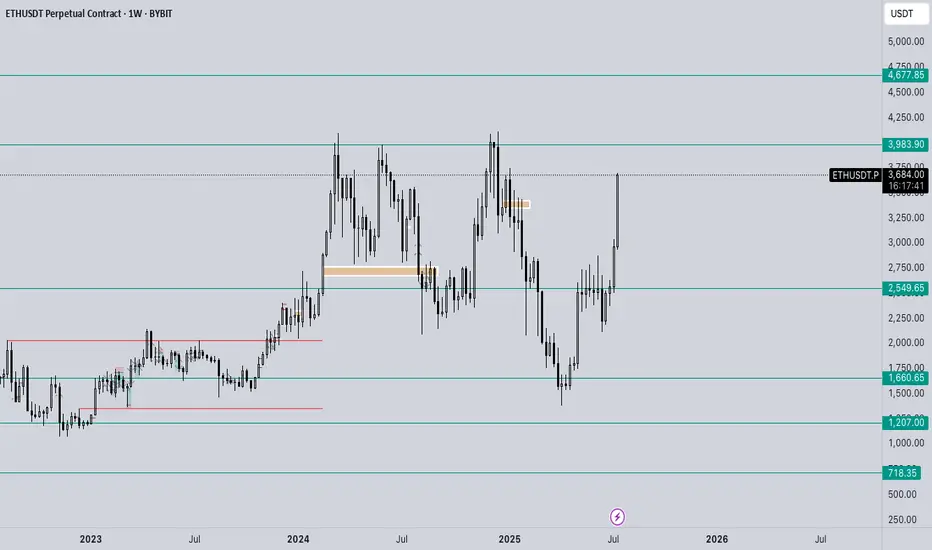
Upward breakout for ETH monthly?🟣 Ethereum Monthly Timeframe Analysis – Large Symmetrical Triangle
📌 Current Situation:
• On the monthly chart (1M), Ethereum (ETH) has formed a large symmetrical triangle pattern.
• This pattern typically signals a major price consolidation before a significant move.
• The descending resistance line connects the 2021 all-time high to recent lower highs.
• The ascending support line is drawn from the 2018 low through the 2022 bottom.
• Price is nearing the apex of the triangle, indicating a breakout is likely soon.
⸻
🔼 Bullish Scenario (Breakout to the Upside):
If ETH breaks above the triangle resistance and confirms the move:
✅ Signs of a Bullish Continuation:
• Strong breakout above the $4,000–$4,500 zone
• Increased volume confirming breakout
• Price holds above resistance-turned-support
🎯 Potential Price Targets by 2027 (based on triangle height & Fibonacci projections):
1. Target 1: $6,800 – $7,500
2. Target 2: $9,000 – $10,000
3. Long-term Target: $12,000 – $15,000 (if macro bull market continues)
⸻
🔽 Bearish Scenario (Fakeout or Breakdown):
If the breakout fails or price breaks down:
• ETH could revisit lower supports around $2,000 or even $1,400
• Bullish momentum delayed until another strong base forms
⸻
🔍 Conclusion:
• This triangle could mark the beginning of a major rally into 2027, especially if supported by fundamentals (e.g., ETF approval, DeFi growth).
• Wait for a confirmed breakout with volume and retest before entering a long-term position.
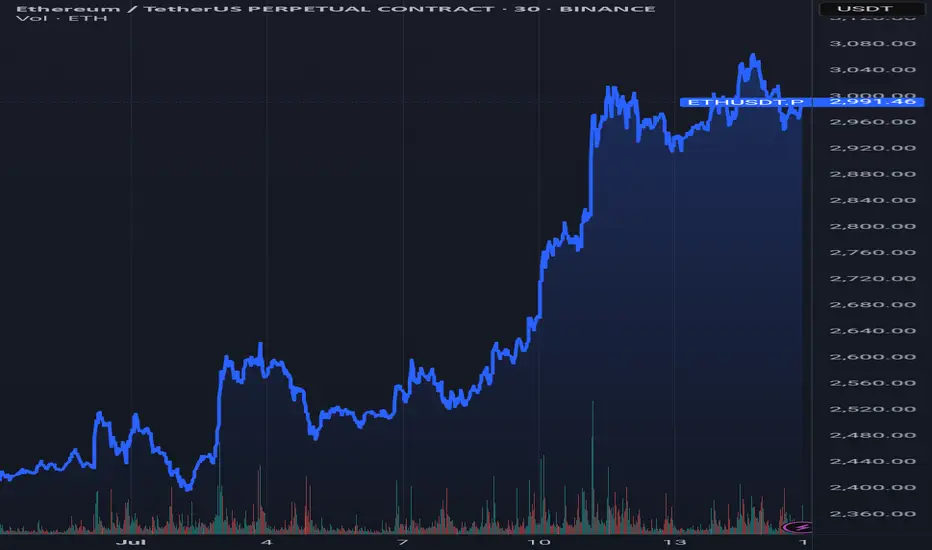
HolderStat┆ETHUSD prepare for a breakthroughBINANCE:ETHUSDT is trending upward with strong conviction after triangle breakouts and clearing the $2,900 level. Structure points toward a move into the $3,300–$3,400 region. The trend is reinforced by repeated bullish retests and channel momentum.

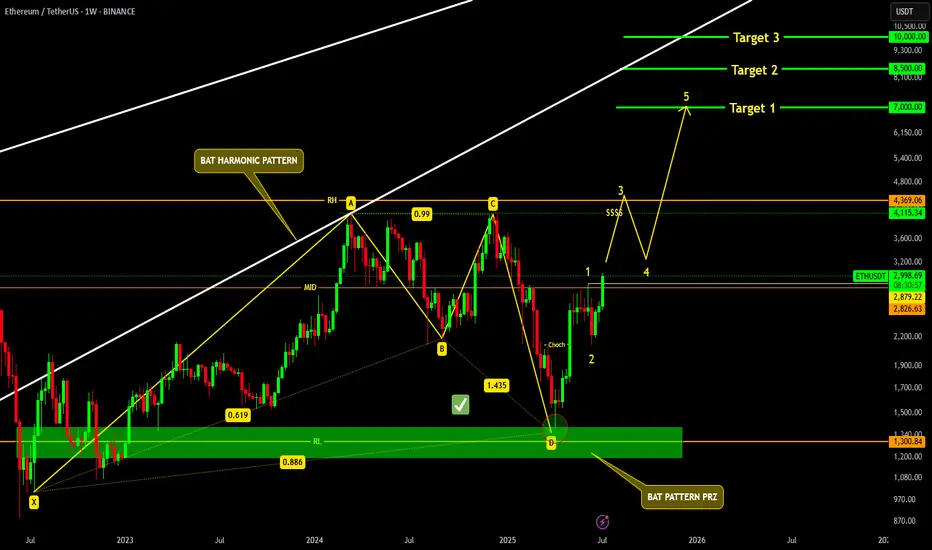
ETHEREUM READY TO SMASH 10K !!!AS per previous Ethereum update, CRYPTOCAP:ETH successfully tapped our Bat PRZ and making it's way to the top.
as per micro elliott wave count, we will see Ethereum slamming 7k, and could potentially smash 10k in coming months.
ETH ~ It Gives you a chance ~ $4000 soon!ETH will soon go to $4000 bidding Lower TF for actual buys and shorts to stay till there, will post the buy moves soon!

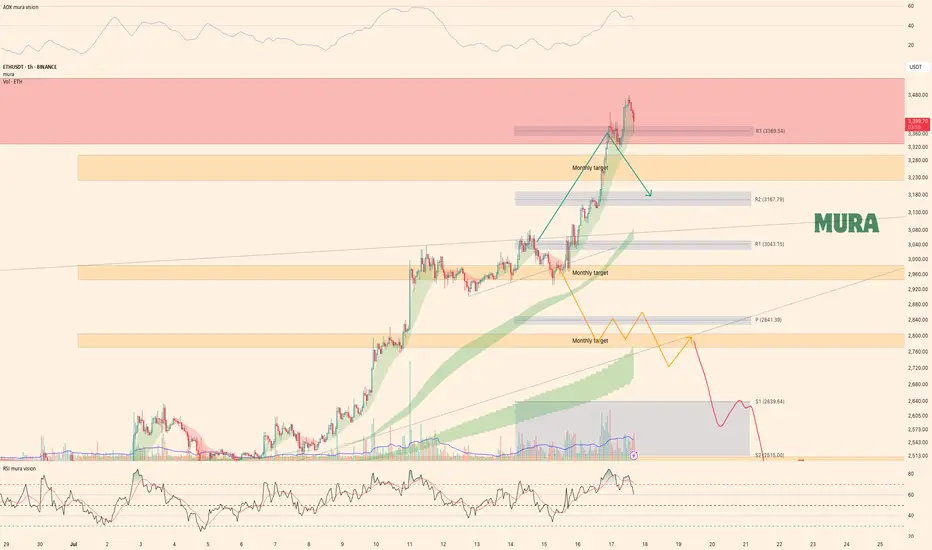
Ethereum Weekly UpdateAs anticipated, Ethereum has achieved all weekly targets, perfectly following our bullish (green) scenario. Price currently tests a key resistance zone after:
Holding critical monthly support at $2,966
Rallying to our projected upside targets
Technical Observations:
Bearish Divergence (4H RSI)
Trend Weakness (H1 & H4 ADX decline)
Seller Reaction at resistance, yet holding above $3,300
Key Levels:
Break above resistance → Continuation likely
Break below $3,300 → Pullback toward $3,000-3,100 expected
Conclusion:
While the trend remains intact, weakening momentum signals potential short-term correction. Trade plan aligns with Monday’s video analysis.
$eth/usdt short swing zoneth: htf/ltf liq + stop hunt (1.204 fibonacci) + ote zone (88.6/91.5 fibonacci) + bat harmonic

ETH – $7k Target in Sight
7k incoming on CRYPTOCAP:ETH —timing is up in the air, but the chart looks stellar.
A decisive break above $3,500 should kick off aggressive expansion.
Meanwhile, ETHBTC has been rallying hard off its lows; I’m eyeing a 50% gain against BTC over the next 2–3 months.
Holding through this strength makes sense—it’s been a long time since we’ve seen these setups.

ETH - Ranges overview (update) We've had some nice movements on ETH lately so let's have a look at where we are.
As previously discussed IF we reclaimed 2.5K we should expect the market to aggressively trade towards the HTF buyside (3.4K and 4K).
The buyside at 3.4K has been traded through already so no let's be PATIENT and see IF we get through 4K and higher.
As always WAIT FOR THE MARKET TO SHOW YOU ITS HAND.
Stay safe and never risk more than 1-5% of your capital per trade. The following analysis is merely a price action based analysis and does not constitute financial advice in any form.
Eth killer Today was a solid trading day with some interesting moves across the markets:
S&P 500: The market trended upwards from the open, gradually moving into and above the prior day’s value area, closing near the high of that range.
NASDAQ 100: After some initial back-and-forth, it climbed above the prior day’s high and value area, showing strength into the close.
Russell 2000: This market was quite choppy and balanced for a good part of the session, but eventually pushed up to close near the prior value area high.
Gold: It stayed range-bound, moving between the CVA high and the prior day’s value area without breaking out.
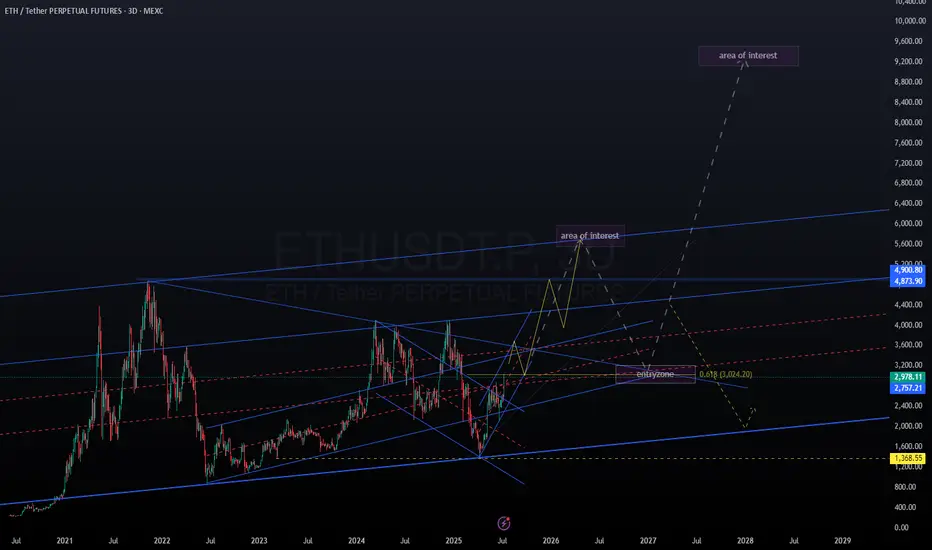
ETH long term outlook 2025-2028 (crystal ball version)Based on time fibs and fib projections.
No financial advice.
If ETH pushes up, looking at a pull back starting early to mid september, then retrace to 0.5 fib and push up into dec. After which possibly come back and test the 4k area where price broke out from. Next push up with a top in Mar/April.
The next is purely speculative (as is this whole post).
Deep retrace after local top in April26, to the 3k level.
If price finds support at 3k, then the next leg up has a chance at 9k end of 2027, Jan 2028.
Otherwise, if support doesn't hold, continuation down into bear market.
Ethereum & monthly 20MAEthereum is gaining strength and will likely break above the monthly 20 MA. Will it maintain this momentum by month's end and remain bullish in the coming months?
Good luck HODLRS ✌️🤞

HolderStat┆ETHUSD retest of the resistance lineBINANCE:ETHUSDT has exited a falling wedge and is forming a bullish continuation pattern. With price action building above $2,500, a breakout toward $2,800 is in play, targeting the supply zone around $3,000. Structure favors bulls.

Long trade
ETHUSDT 4H Chart Analysis
Date: Sat 05th July 2025, 4:00 PM
Session: London to NY AM
Key Trade Details
Entry: 2,515.17
Profit Target: 2,864.44 (+13.89%)
Stop Loss: 2,479.01 (−1.43%)
Risk-Reward: 9.66
Key Reasons for the Trade:
Bullish Breakout above 2,515, supported by strong volume surge.
Price Above EMA & WMA: Clear trend confirmation.
Strong Momentum: The RSI is overbought, indicating bullish strength, but watch for a potential short-term pullback as the price approaches resistance.
Target Zone: Prior resistance cluster at 2,820–2,860.
Current RR in Play: Trade already moving

Ethusdt bullish cup and handle dailyEthusdt is forming a big cup and handle pattern in daily time frame. A close above 2850 in daily time frame may activate the pattern.
Targets are 3300, 4000 and 5500
Pattern invalidation: A close below 2100

ETH | Bullish Pattern - Cup and Handle +15%A Bullish pattern is appearing on the Ethereum chart.
From a Cup and Handle pattern, we can easily expect atleast a 15% increase. This is true for the near term. A +15% would put us here:
Just under $3K we may see heavy resistance. This is also the neckline resistance, as it was the previous support for the breakout that ultimately led to a new ETH ATH.
_______________________________
BYBIT:ETHUSDT

ETHUSDT minor trendsEthereum BINANCE:ETHUSDT is downtrend with lower highs from the bottom is nearly finished 📉 . For a stronger rise, it needs to stabilize above $2500 ⚡. Mid-term targets are $3300 (end of second leg) and $3700 (major resistance) 🎯. Key supports are $2500, $2070, $1800, and $1550, the base where the uptrend began 🛡️.
Supports & Resistances:
Supports: \$2500, \$2070, \$1800, \$1550
Resistances: \$2500 (critical level), \$3300, \$3700

ETH: Deep Retrace or Shallow? Two Key Long Zones into Next Week✅ Two main long setups: Equal Lows @ $2,376, Untapped Demand $2,250–$2,314
✅ Best R/R from deeper demand zone, but will watch both levels
✅ Targets: $2,738 (range high), ~$3,000 (expansion)
✅ Shallow retrace may limit upside to a new local high, not full expansion
Setup 1:
Buy trigger on sweep and reclaim of $2,376 (equal lows)
Target: $2,508, then $2,738
Setup 2:
Preferred: Buy trigger into $2,250–$2,314 untapped demand
Target: $2,738, $3,000
Risk:
Wait for reaction/confirmation at both zones; no FOMO in between
🚨 Risk Warning:
If no strong bounce from these levels, stand aside — don't force the setup.
ETHUSDTHere is a great move for ETH after a long time.
So I can recommend some levels to trade and bullish move has been started.
good luck
DYOR!

ETH - Lots of Crazy Important LinesPlease refer to our previous post:
Some of the colors of the lines have changed, but the trajectory stays the same.
One of the most important trendlines we have been fighting (red trendline) is seeing the first daily candle try to close above it. Right now ETH is fighting the pivotal $3k psychological level, but if price is able to break above we could see a swift move towards the green trendline.
Depending on when price could visit the green trendline could put price anywhere between $3,400-$3,500.
All these lines will probably play a role in the future of price action so I have extended them to watch how prices handles these levels in the future.
