Ethereum (ETH): Strong Breakout Happened | Targeting $3200-3300 Ethereum had a strong breakout, and we are getting closer and closer to our major target of $3200-3300.
A smaller target of $3000 has been reached and we see that after smaller rejections, buyers still keep the pressure, so our major target remains the same
Swallow Academy
ETHUSDT.P trade ideas

ETH New Analysis (12H)This analysis is an update of the analysis you see in the "Related publications" section
The previous analysis is still valid | its timeframe is higher, but in this update, we've moved to the lower timeframes.
It seems a valid bottom has been formed on Ethereum, and we may not see a lower low, provided that the price doesn't move higher first but instead drops directly into our support zone. If that happens, the price could potentially move upward from there.
Ethereum seems to be searching for a support zone to reach higher levels. The marked area could potentially launch the price upward.
In this analysis, the support zone, targets, and invalidation level have been updated.
For risk management, please don't forget stop loss and capital management
When we reach the first target, save some profit and then change the stop to entry
Comment if you have any questions
Thank You

Ethereum:Daily signalhello guys👋
According to the drop we had, you can see that buyers came in and the price had a good growth, and after that a trading range was made in which the price got stuck.
Now, considering that the price is in the trading range and it seems that the buyers have shown their support, it is possible to step into the specified support areas with risk and capital management and move up to the set goals.
🔥Follow us for more signals🔥
*Trade safely with us*

When does Bolran start?Read carefullyhello friends👋
💰Many of you are asking when Bolran will start or if it will start at all, we decided to explain it to you in a full post.
Well, you can see the Ethereum chart moving in a channel, and with a drop, it created a big fear that a fall is coming, and meanwhile, the buyers returned the price to above 2000 dollars with a strong and unexpected return.
✅️Now the price is stuck in the specified box between 2200 and 2500, and if this range is maintained, the price will easily move up to the range of 3200 in the first wave, and if it fails to maintain this range, the price will fall below 1500 dollars.
🧐Now, in our opinion, due to the rapid return of the price from the channel, this failure is a fake channel and the range will be maintained, and we are likely to see Ethereum rise in the coming weeks.
🤔You know that Ethereum is the leader of altcoins, and if it grows, important altcoins will grow, which is the beginning of Bolran, and there are important altcoins that can be used for good profit.
🌟You can join us if you like.🌟
🔥Follow us for more signals🔥
*Trade safely with us*

$ETHUSDT: Uptrend signal in the daily timeframeEthereum is ready to move higher, as I anticipated when the BINANCE:ETHBTC signal flashed...
Best of luck lads!
Cheers,
Ivan Labrie.

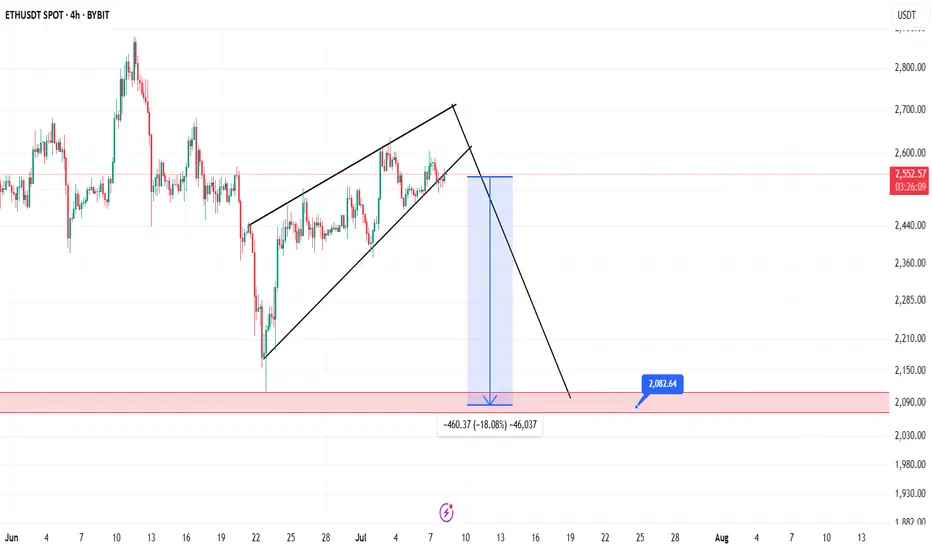
ETH Needs big money injection ASAPRising wedge presented in the chart is a bearish pattern.
To cancel this bearish pattern we need :
- Break the $2,800 level with bigh green candle
- The break should occur with big volume
- The break should be as soon as possible.
Otherwise, the downtrend will continue and he decline will be sharp.
COINBASE:ETHUSD BITSTAMP:ETHUSD CRYPTOCAP:ETH CRYPTOCAP:ETH.D

ETH BREAKING OUT?Ethereum is making a strong weekly push into resistance around $2,817 – a key level that acted as support throughout 2023 before flipping to resistance in early 2024. Price is now testing this zone after a steady string of higher lows, and the move is backed by increasing volume, signaling genuine momentum. ETH has already reclaimed its 200-week moving average and is now challenging the 50-week MA from below. A weekly close above both would mark a major technical shift, suggesting the end of a long consolidation phase and the potential start of a sustained uptrend. If bulls can push decisively above this level, the next major target sits near $4,093. For now, all eyes remain on whether Ethereum can reclaim this final resistance before the path higher opens up.

ETH Ascending TriangleETH has formed a clear ascending triangle pattern with a possibility of imminently breaking out to the upside. If rejected, we could see a breakdown to the ~2,300 support and subsequent rebound.
My bias is still bullish. We'll let the market tell us what happens and respond accordingly. Worst case scenario is more boring consolidation.
Stay patient.
Happy trading,
Melonfarmer


ETHUSDTThis is very easy...
best support level 2300 to 2500 for jump price. but was needed for jump price for get enrgy for movement to high levels by fake breakout.
First level of resistance 2800 to 3000.
⚠️Control Money Management in your capital.

DeGRAM | ETHUSD rebound from the support line📊 Technical Analysis
● Bounce off the purple up-trend and 2 320 support printed a bullish engulfing, maintaining the sequence of higher-lows that has guided price since April.
● Price is squeezing into an ascending triangle under 2 700-2 730, where the former wedge cap meets horizontal supply; a break projects to the 3 040 macro fib / channel roof.
💡 Fundamental Analysis
● Net-staking deposits keep rising while, per FXStreet (25 Jun), whales add ETH ahead of the SEC’s spot-ETF S-1 verdict, underpinning demand.
✨ Summary
Long >2 320; triangle breakout above 2 730 targets 3 040. Thesis void on a 16 h close below 2 200.
-------------------
Share your opinion in the comments and support the idea with like. Thanks for your support!

Short oppurtunity for ETHShort Opportunity on Ethereum (ETH)
Ethereum has recently failed to reclaim key resistance near \$2,800 and is showing signs of renewed bearish momentum. A brief pullback toward \$2,705 is likely before any meaningful bounce back to retest \$2,800. This setup offers a shorting opportunity with defined risk and reward.
Technical Rationale
Resistance at \$2,800 : Price has been unable to close convincingly above this level on multiple attempts, indicating strong overhead supply.
Bearish Momentum : Recent lower highs on the 4-hour chart and a break of the short-term uptrend line suggest sellers are in control.
Support Target at \$2,705 : The next logical area where buyers may step in confluence of the 50-period moving average (4h) and prior swing low from late June.
Outlook
If ETH reaches \$2,705 and shows bullish signs (hammer or bullish divergence on RSI), expect a retest of the \$2,800 area. Conversely, a decisive break below \$2,705 could open the path to \$2,650 and lower. Adjust your plan accordingly based on how price behaves around these key levels.
Disclaimer : Always conduct your own due diligence and size positions according to your risk tolerance. Markets can be unpredictable, use proper risk management.

ETH Long Swing Setup – Sideways Hold with Dip-Buy OpportunityETH continues to hold above the key $2,300 support, showing resilience and consolidating within range. We’re watching for one more dip into the $2,300–$2,375 zone to trigger a long entry, with momentum building for a potential breakout.
📌 Trade Setup:
• Entry Zone: $2,300 – $2,375
• Take Profit Targets:
o 🥇 $2,900 – $3,000
o 🥈 $3,300 – $3,400
o 🥉 $4,000 – $4,200
• Stop Loss: Daily close below $2,000

Short-Term ETH Setup – Bearish Bias with Target at $2536Short-Term ETH Setup – Bearish Bias with Target at $2536 🐻
Ethereum is showing signs of weakness below resistance, and a short-term pullback could be on the table. If bearish momentum holds, I’m watching $2536 as the next key target.
Tight risk management is crucial — this setup offers solid R/R if played with precision.
📉 Follow for real-time analysis, sharp entries, and no hype.

ETH Short IdeaRising trend broken. You can see MSB easily
Volume going down during price rising.
I am waiting correction to 1860

Ethereum (ETH): Will Say It Again $2800 Is Scripted!Ethereum buyers are dominating currently, with the price climbing closer and closer to our major target of $2800.
What to pay attention to are the 100 and 200 EMAs, where usually once we have shifted apart from them, we have seen some kind of correctional movement if buy-side momentum is lost so that's what we are keeping an eye on.
If we see currently further buy-side pressure, then we might reach our target within this week, but if sellers take even slight control, we most probably will retest the EMAs before another attempt to upper zones.
Swallow Academy

ETH TRADE IDEA 23 06 25If price retest this FVG, we could look for a long position
That equal highs are dangerous right now, but we could expect to form a BKR
Maybe a Futures Grid could be a great idea

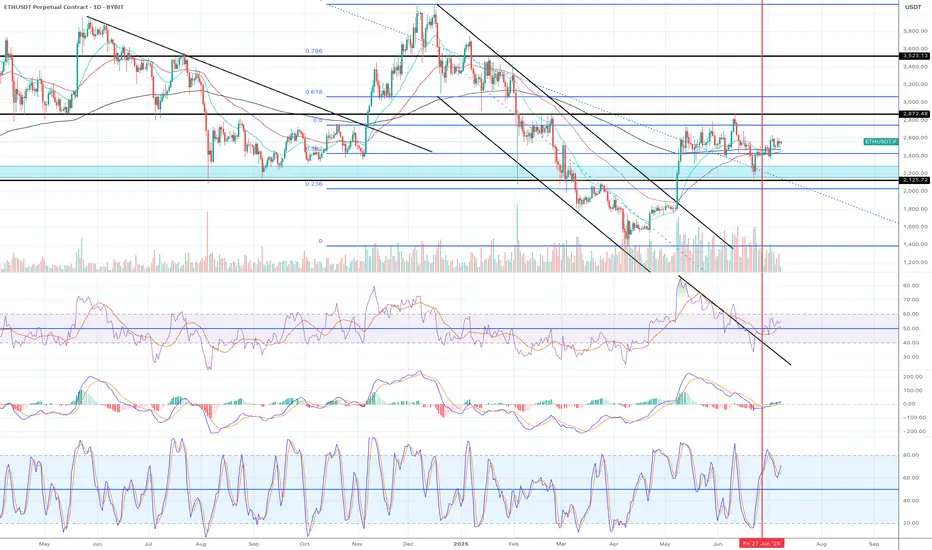
ETH/USDT 1W Chart📊 Trend structure (Price Action)
Downtrend (historical):
A series of Lower Highs (LH) and Lower Lows (LL) — a classic downtrend.
Confirmed by the orange downtrend line.
A change in structure — a possible beginning of an uptrend:
A Higher Low (HL) has recently been formed after a Lower Low (LL).
Suggests a possible end to the downtrend and an attempt to break out upwards.
Currently:
The price is testing the upper downtrend line.
A breakout above the orange line may confirm a trend change.
🟢 Key Resistance Levels (Green Lines):
Level Meaning
3.058 USDT Potential target after a breakout from consolidation
2.767 USDT Nearest strong resistance - currently being tested
3.427 USDT Deep resistance level from the previous high (HH)
🔴 Key Support Levels (Red Lines):
Level Meaning
2.234 USDT Nearest support - previous breakout
1.883 USDT Early 2023 support
1.507 USDT Local bottom
1.204 USDT Historical support - LL extreme
📉 Stochastic RSI (Momentum Indicator):
Currently in the overbought zone.
This may suggest a short-term correction before an actual breakout.
However, in a strong uptrend, the indicator may "hang out" in the overbought zone for a long time.
📈 Potential scenario:
If the breakout above 2.767 and the orange trendline holds:
A possible move to 3.058 USDT as the first target.
Extended target: 3.427 USDT (HH).
If the breakout fails:
Correction to 2.234 USDT or lower.
There is a risk of returning to a downtrend.
✅ Bullish signals:
Higher Low (HL) formation after Lower Low (LL).
Testing the upper downtrend line with an attempt to breakout.
Volume is increasing (based on candles).
⚠️ Bearish threats:
Stochastic RSI in the overbought zone.
Breakout not confirmed by 100% (needs a weekly closing candle above 2.767).
Resistance at 3,058 could halt the move.
📌 Conclusion:
Ethereum (ETH) could be on the cusp of a new uptrend, but a breakout above 2,767 USDT is needed for confirmation. If it does, a move to 3,058 and then 3,427 is possible. However, the current overbought level on the Stochastic RSI could signal a short-term correction before the trend gains strength.

ETHUSDT Long / Buy SetupMust take from the entry and USE tight SL. Can be a fakeout, if real breakout then tps are mentioned. In case sl hit, use the previous setup, it's still valid. While for short I'm still waiting for 3k or above.

Ethereum Facing Key Resistance, Breakout or Fakeout?ETH is pressing into major horizontal resistance near $2,600 after breaking out from a double-bottom structure. Price is moving within a wide range capped near $2,900 and supported by the 0.5 and 0.618 fib zones.
🟢 Scenario 1 – Bullish:
Clean break and hold above $2,600 opens room to test the top of the range around $2,900. Watch for a higher low retest to confirm strength.
🔴 Scenario 2 – Bearish:
Rejection here could send ETH back toward $2,340 (0.5 fib) or even $2,220 (0.618). The stochastic RSI is approaching overbought, signaling caution.
This chart is for educational purposes only — not financial advice.

Time to go long!!
1) A candle broke out and closed above the descending parallel channel.
2) The price has been consolidating above Fib0.0382 level for weeks.
3) The recent candles are sitting above EMA21.
4) EMA 21 is above EMA55.
5) EMA200 is running horizontally still but it is getting close to cross EMA55.
6) All momentum indicators are in the bull zone and still plenty to go before it hits overbought territory.
There might be a strong breakout to the upside.
It is time to go long.
$ETH - SELL to BUY BiasOn the Daily Timeframe, Ethereum cleared the liquidity sitting on the $1755 zone and bounced off the support around $1500 region. It then rallied hard and swept the liquidity at $2800 , doubling and confirming it as a solid Resistance zone.
Using strong buy rejection and good volume as confirmation, a sell from the $2700 - $2750 zone is feasible, with target at the liquidity sitting at $2100 - $2110 zone.
We then, can consider buying from any POI below that zone.
Remember to REACT and not PREDICT. DYOR‼️
