ETH-technical structure, momentum, and confirmation🕐 Daily Chart Analysis
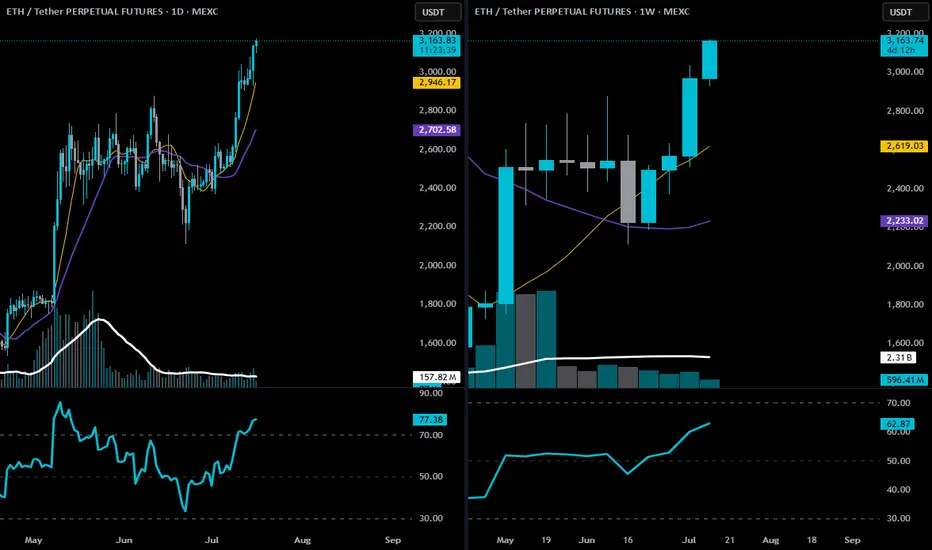
Trend: Clear uptrend. Price is trading well above both the 9 EMA (gold) and 20 EMA (purple), with strong angle and separation.
Price Action: ETH is pressing into multi-month highs with no major resistance between here and the $3,350–$3,500 range.
Volume: Healthy increase in volume on bullish candles; recent bullish expansion looks organic, not low-volume driven.
RSI: At 77.15 — yes, overbought, but in a trending market, this is confirmation, not a sell signal. You want RSI to stay elevated during impulsive legs.
📅 Weekly Chart Analysis
Breakout Structure: This is the second full bullish candle after breaking out of a multi-month base ($2,800 range), following an accumulation period.
9 EMA Just Crossed Over 20 EMA: First time since early 2024 — bullish trend confirmation.
Volume: Large expansion bar from May shows institutional interest; current bar remains strong and building.
RSI: Pushing up to 62.75 — well below overbought, meaning there’s room to run.
🧭 Strategic Trade Plan (Swing Long)
✅ Bias: Long
Targeting $3,300–$3,500 with trailing logic to extend if momentum continues.
THIS IS NOT FINANCIAL ADVICE. Drinkin Smöökëē Whizkee. Edumacational Purpiz Only!
ETHUSDT.P trade ideas
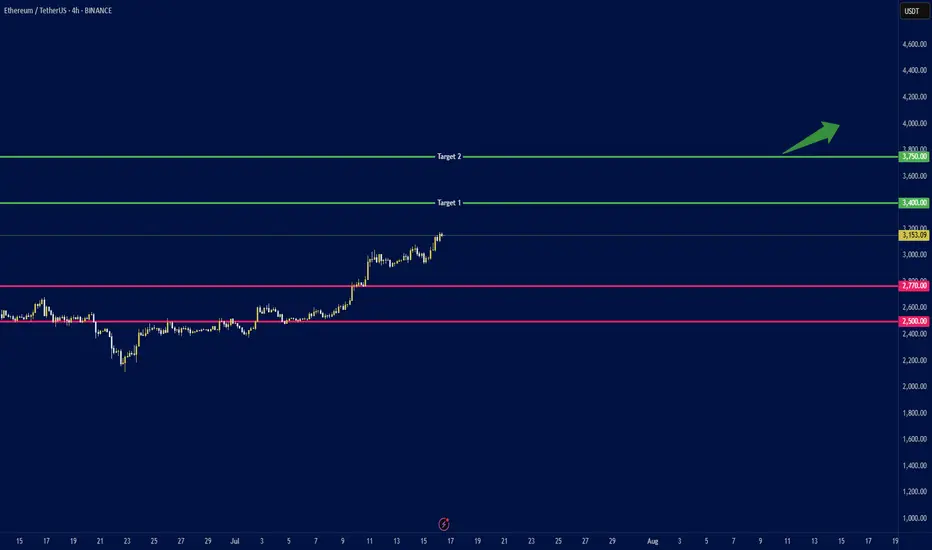
ETH to $4K ? Whales Accumulate as ETFs Break Records🕞 Timeframe: 4H
.
🟢 Bias: Bullish
1. 🧭 Fundamental Overview:
📈 Massive Institutional Inflows:
Ethereum ETFs have recorded over $1.2 billion in net inflows this July, with $908M just in the week ending July 11. This strong demand from institutional players (notably through ETHA and Bitwise) has pushed ETF AUM above $13.5 billion.
🏢 Corporate Accumulation:
Companies such as SharpLink Gaming have begun adding ETH to their balance sheets. SharpLink's 10,000 ETH (~$49M) purchase highlights growing corporate adoption of Ethereum as a store of value and strategic reserve.
🛠️ Ecosystem Resilience:
Ethereum continues to lead in network upgrades (e.g., Dencun), institutional DeFi, and tokenized assets—strengthening the long-term fundamentals of the chain.
2. 🧠 Sentiment & On‑Chain Metrics
🏦 Institutional Sentiment:
Ethereum ETFs have seen 12 straight weeks of inflows, outperforming Bitcoin in institutional allocation growth (ETH: 1.6%, BTC: 0.8%).
🐋 Whale Activity & Exchange Flows:
Declining ETH balances on exchanges suggest accumulation and reduced sell pressure. Whales and smart money are taking positions.
📊 Public Sentiment:
Bullish expectations remain strong amid price consolidation above key levels and positive ETF momentum.
3. 🔼 Key Levels:
Support: $2,770 and $2,500 (major trendline and psychological level).
4.🎯 Price Targets:
Short‑term (2–4 weeks):
If ETH breaks above $3,150: next targets at $3,400 and $3,750.
Medium‑term (by end of Q3 2025):
ETH could reach $3,500 with potential upside to $4,000.
.
.
.
⚠️ Disclaimer: This analysis is for educational purposes and not financial advice. Please do your own research and risk management.
.
✅ If you like this analysis, don't forget to like 👍, follow 🧠, and share your thoughts below 💬!
ETHUSD – Final Resistance Test Ahead Ethereum is ripping toward a major historical resistance zone between $4,000–$4,300 — a level that rejected price cleanly in both 2024 and early 2025. With momentum high and sentiment bullish, this area becomes the real test of trend strength.
Failure here could form a triple top.
Breakthrough? Expect fireworks.
#ETHUSD #Ethereum #Crypto #ResistanceZone #SmartMoney #QuantTradingPro #TradingView

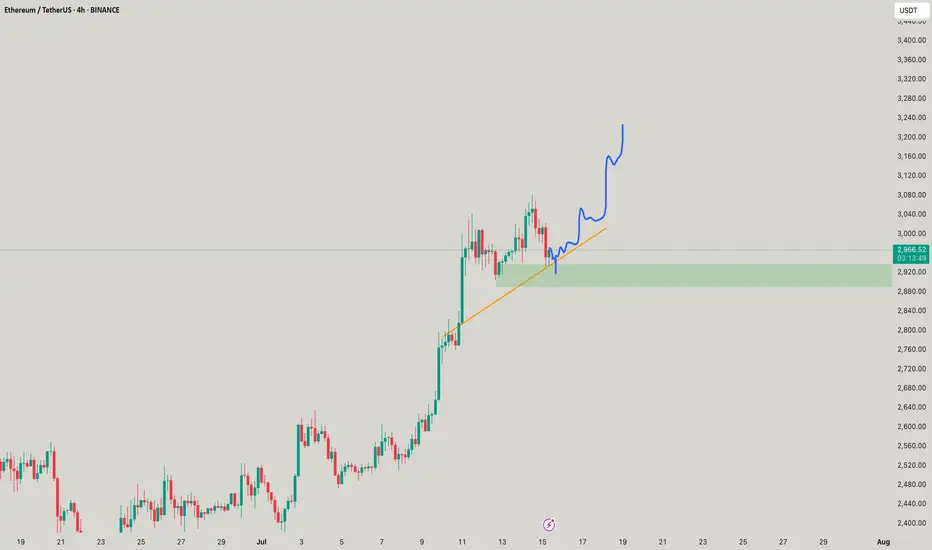
#ETH Update #3 – July 15, 2025#ETH Update #3 – July 15, 2025
After its recent impulsive move, Ethereum appeared to make a slight correction. However, this correction did not complete and instead formed a second peak. Since a full correction hasn't played out yet, caution is still warranted when trading Ethereum.
The first correction level is around $2,850, the second around $2,780, and the third around $2,700. If Ethereum pulls back to the second correction level, it will balance out the second imbalance zone created during the last impulse, which could allow for a healthier continuation upward.
As long as Ethereum doesn't break down below the $2,900 zone, I do not expect a correction. But if it does break below $2,900, corrections are likely to occur one after another.
At this point, neither a long nor a short position seems suitable for Ethereum.

ETH - Can it go $3200??Yes looks good until stays above 2890, all buys are good in this range as scalps! AWESOME aint it?
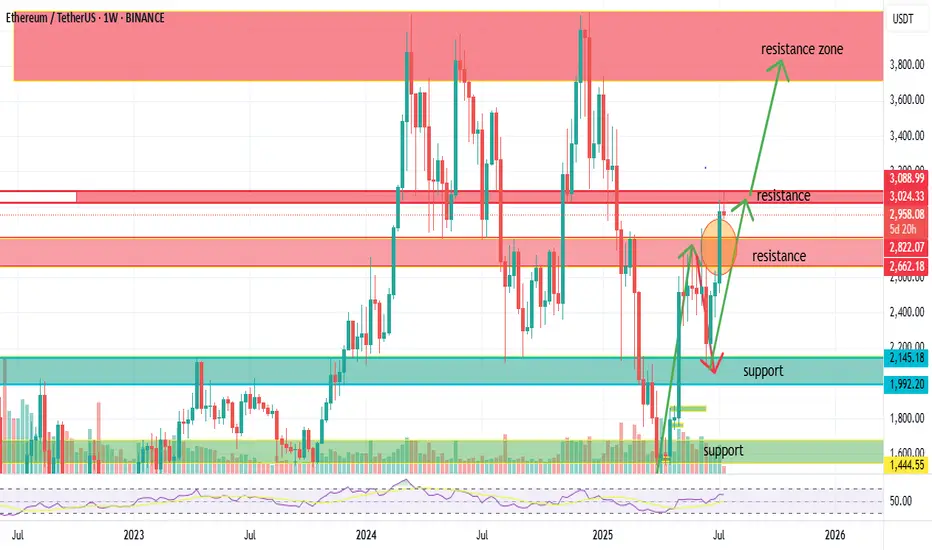
Ethereum Just Broke Out! Is $4,000 Next?Looking at the chart, ETH had a solid bounce from the key support zone around $1,992 to $2,145.
After consolidating, ETH broke above the critical resistance zone between $2,600 and $2,822 last week.
And more importantly – ✅ Last week’s candle closed firmly above this zone, backed by strong volume.
This was one of the most difficult resistance areas in recent months – and now that ETH has broken it, it’s a clear confirmation that the bullish trend is continuing.
🎯
📌 With this breakout confirmed, ETH is now targeting the next major resistance between $3,100 and $3,750.
If that area gets cleared, we could see a move toward the psychological level of $4,000.
📌 However, if ETH faces rejection at $3,100 – we may see a pullback to retest the breakout zone around $2,822 – $2,662 before another leg up.
📈
RSI is currently neutral and has room to climb – a good sign for further upside
Volume on the breakout was strong, confirming that smart money is stepping back in
🎙️
So here’s the bottom line:
✅ ETH successfully broke out of the $2,600–$2,822 resistance zone
✅ Weekly candle closed strong with high volume
✅ Uptrend looks ready to continue
🎯 Short-term target: $3,100 – $3,750
🎯 Long-term breakout target: $4,000+
📌 Support zone to watch: $2,822 – $2,662 (for potential retest)
⚠️ Disclaimer: This is just my personal analysis – not financial advice.
Always do your own research and manage risk properly!
👉 Follow Dat Vinh Airdrop for more solid crypto insights every week!
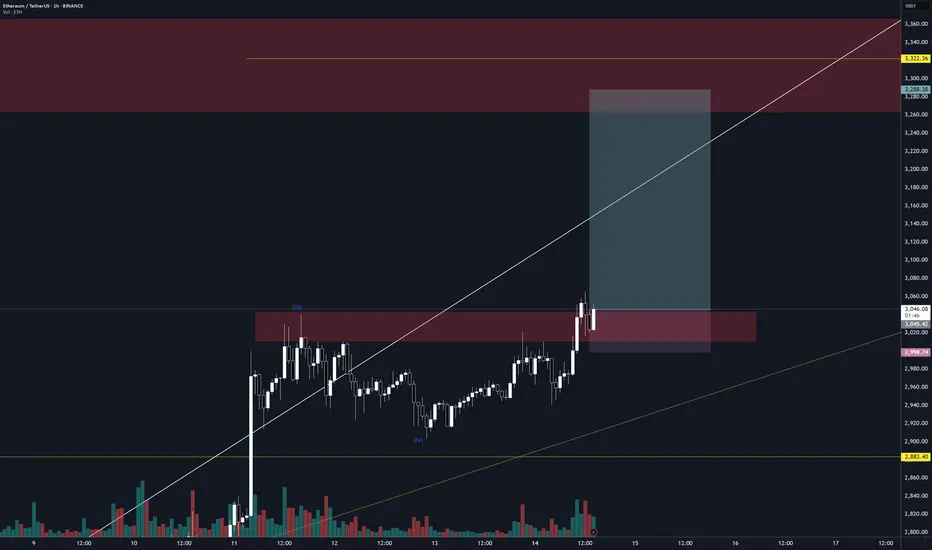
Ethereum Just Hit Resistance — Will It Explode or Recoil?Ethereum has powered through previous resistance levels, riding a clean ascending trendline and now entering a key supply zone around $3,000. While bulls have dominated the recent run, price is now brushing up against historical resistance with Stoch RSI entering overbought territory.
This is a pivotal area — if ETH breaks through with volume, the next target sits near $3,400–$3,700. But if momentum fades, a pullback into the $2,800 zone or even a retest of trendline support could offer better entries.
Momentum is hot, but traders should stay sharp — this zone has rejected price before. Smart money watches reactions, not just breakouts.

ETH-----Buy around 3000, target 3070 areaTechnical analysis of ETH contract on July 14:
Today, the large-cycle daily level closed with a small positive line yesterday, the K-line pattern continued to rise, the price was above the moving average, and the attached indicator was running in a golden cross. The general trend of rising was relatively obvious, but it was not as strong as the big cake. The previous historical high was in the 4877 area in November 2021, so in this way, the later rise may be more fierce than the big cake; the short-cycle hourly chart intraday starting point is in the 2970 area, and the current K-line pattern shows a trend of continuous negative retracement. The attached indicator is running in a golden cross, but the general trend is still strong. The four-hour chart retracement moving average support is in the 3000 area.
Today's ETH short-term contract trading strategy:
Purchase in the 3000 area, stop loss in the 2970 area, and target the 3070 area;

$ETH LONG POSISI I see potential In CRYPTOCAP:ETH Hi break high , i will take hi for retectment area and order block .
If u want entry area see on chart

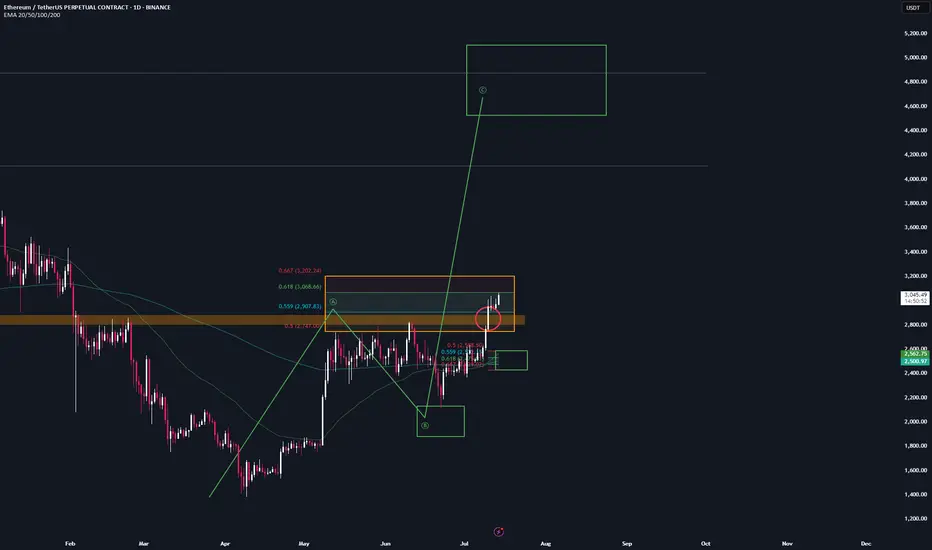
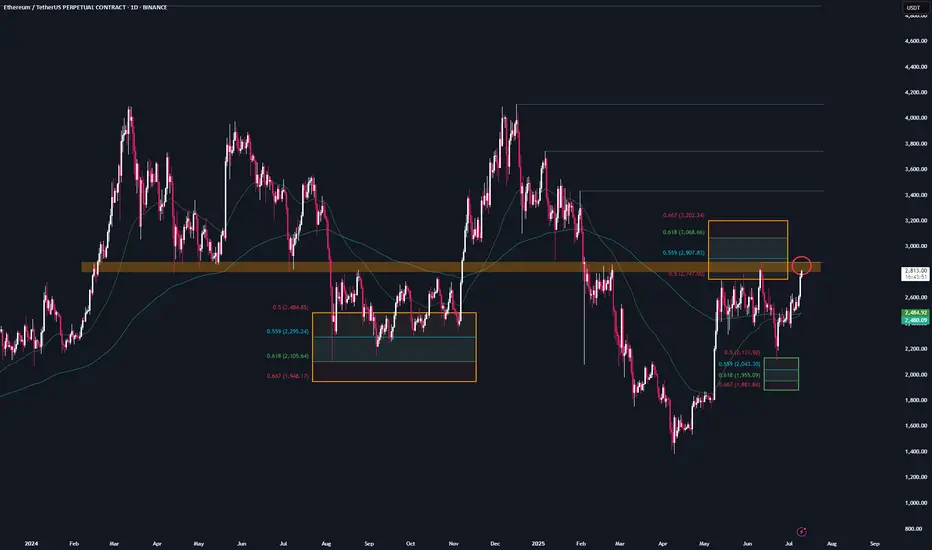
ETH - Trade setup📌 After the breakout from the last high at 2.9k, a bullish sequence (green) has now been activated.
📊 These setups typically occur no more than twice per year on any given altcoin, so I’ll be aggressively buying each level at the B-C retracement area.
Trademanagement:
- I'm placing long orders at each level. ((If the price continues climbing, I’ll adjust the trend reversal level (green) accordingly and update my limit orders.)
- Once the trade reaches a 2 R/R, I’ll move the stop-loss to break-even.
- From a 3 R/R onward, I’ll start locking in profits.
✅ I welcome every correction from here on —
but I won’t enter any new positions at these top levels.
Stay safe & lets make money
new long order on etheth backtest-ed, eth/btc looking good to move, btc reached new all time high.
Good to go ? ./.
ETH – Watching the $2,900 Trigger for ATHsJust need BINANCE:ETHUSDT to break above $2,900 for the next trigger.
Feeling confident it will chew through the current supply zone.
Plenty of other coins are already showing clear direction, and Ethereum should follow.
Be patient—I doubt ETH will challenge the #1 spot, but a move above $2,900 opens the door to a potential new ATH.

ethusd to 70 000 or 700 and 70 in two Months we seeEthereum in parallel channel and huge bull flag. if in next two months it will break out of the 4000 could go to 75000.
If not will range in channel till 700 and breaking down would mean even 70 and lower

Ethereum Idea and Buying Plan⚪️ CRYPTOCAP:ETH
We mentioned earlier that our goal is 3290 - 3473 which is the gap formed in CME contracts
⭕️ Currently, for speculative thinking or looking to enter the support range after all this rise is between 2789.57 to 2685.87
🚨 The important thing is to stay above 2326 to support the continuation of the rise strongly
🔼 The key to the rise will be maintaining movement above 3000 on the 4h and 1d frames
📄 The closest targets for this model, upon meeting the conditions, are 3356 reaching the range of 3567 - 3857

ETH Ethereum (ETH/USDT) Technical Analysis (April 29, 2025)
🔵 Trend Analysis:
Overall trend remains bearish on the daily timeframe.
ETH is trading below the Ichimoku Cloud, indicating continued downward pressure.
The price is struggling around $1,790, facing strong resistance and unable to break into bullish territory.
🌫️ Ichimoku Cloud Insight:
Kumo (Cloud) is thick and bearish ahead, suggesting strong resistance at higher levels.
Conversion Line (Tenkan-sen) and Base Line (Kijun-sen) are flat, showing a range-bound market recently.
The Lagging Span (Chikou Span) is below the price and the cloud, confirming bearish sentiment.
📏 Fibonacci Retracement Levels:
ETH is retracing after a heavy downtrend.
Key Fibonacci levels:
0.236 at ~$1,721 — already surpassed.
0.382 at ~$1,927 — acting as a next resistance.
0.5 at ~$2,093 and 0.618 at ~$2,260 — higher resistance zones.
Immediate local resistance sits near the $1,927 - $1,930 region.
🔥 Support and Resistance:
Strong range support near $1,700 is marked (labeled "Eth range support 1700" on the chart).
Resistance above at:
~$1,809 (local highs and the edge of Ichimoku Cloud).
~$1,927 (Fibonacci 0.382).
If ETH breaks below $1,700, the next major support is at $1,621 and even deeper at $1,387.
⚡ Momentum (RSI Indicator):
RSI 14 is at 54.37, slightly above neutral (50), suggesting mild bullish momentum.
RSI above 50 usually indicates buyers are gaining slight control.
RSI has risen recently, but without strong divergence from the price action, meaning strength is moderate, not explosive.
📊 Volatility:
Volatility has compressed recently (visible from smaller candlestick sizes).
Price action remains in a tight range between $1,750 and $1,810.
A breakout from this range could trigger larger moves.


Ethereum Wave Analysis – 11 July 2025- Ethereum broke resistance zone
- Likely to rise to resistance level 3140.00
Ethereum cryptocurrency recently broke the resistance area lying at the intersection of the key resistance level 2885.00 (which has been reversing the price from February) and the resistance trendline of the daily up channel from June.
The breakout of this resistance zone accelerated the active impulse waves 3 and (3).
Given the predominantly bullish sentiment seen across the crypto markets, Ethereum cryptocurrency can be expected to rise to the next resistance level 3140.00 (former support from December and January).

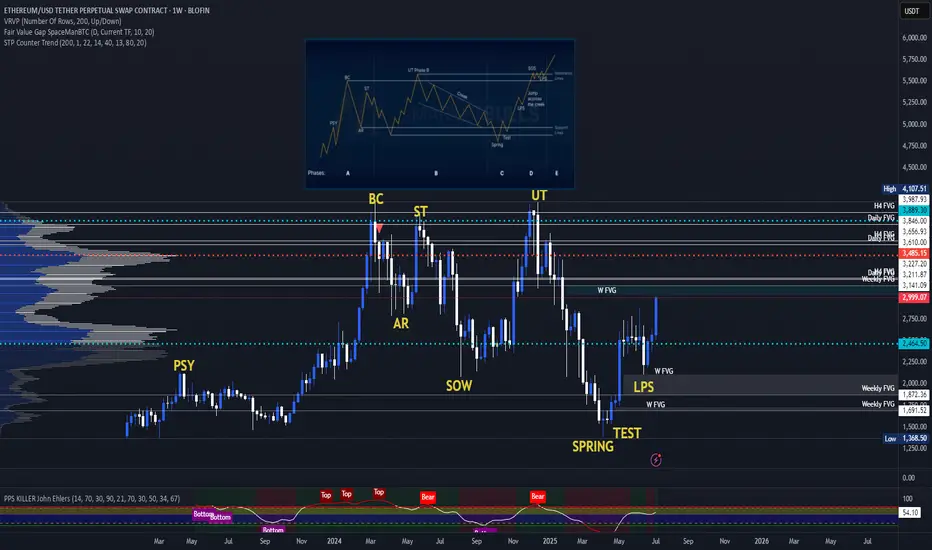
ETH Wyckoff Re-AccumulationETH (and many of the major altcoins) has a macro re-accumulation going on right now. The targets would be well beyond our current all-time highs. There has been a lot of bullish news recently with large investors buying heavily into ETH, which should act as a catalyst to jump-start the mark-up phase of this re-accumulation and "Jump Across the Creek" as they say.
ETH Long / Buy SetupAs of many times mentioned that, will short eth above 3k or 3k, but it still shows Bullish momentum no sign of weakness, maybe this entry triggers during weekend due too low volume, search for ifvg, if any 1D or 4hr Bullish fvg truns into bearish ifvg then will take short on ETH. For now will take long with SL and proper risk management.

EthusdEasy target here if it can keep pushing above 3k and the weekly ends above it it will sure go to 4k where is a good point to sell . Alt season it’s starting now
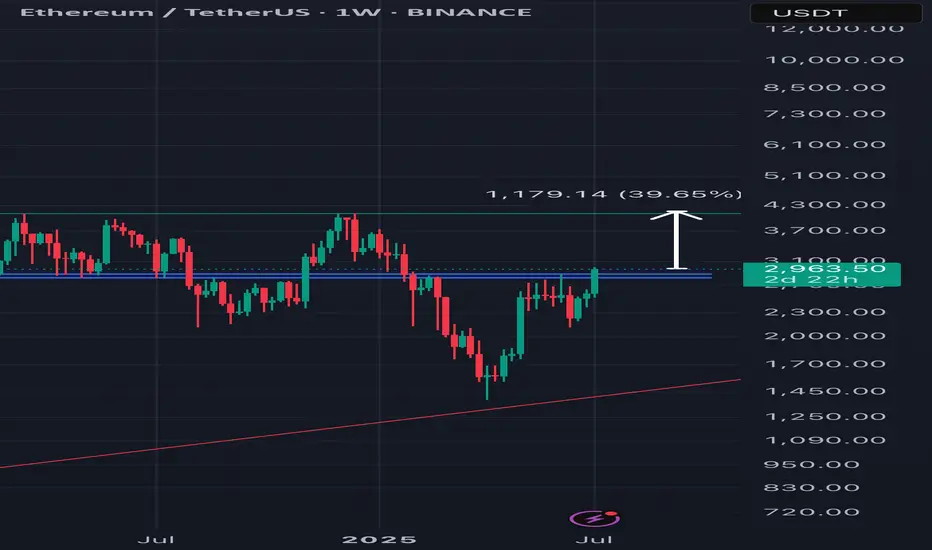
ETH is at a crucial areaETH is currenty retesing its key support & resitasnce area over the last 2 years, every breakthroiugh let to an major rally
Once we can close above it expect bullish moomentum to contiue to new ATH reagions
#ETH Update #2 – July 10, 2025🟢 #ETH Update #2 – July 10, 2025
Ethereum has formed a new high above its previous impulsive leg. Although this peak is lower than the one a month ago, the current structure looks healthy. During this move, ETH left an imbalance around the 2373 level, which aligns closely with a potential retracement zone. Volume appears to be decreasing or reaching exhaustion, suggesting the rally may be losing strength. A correction towards 2685 could be on the table. For now, the setup does not favor either a long or short position.

ETH/USDT Long term ContinueAbsolutely! Here's your Ethereum long position analysis in English based on the chart you shared:
🧠 My Position – Long at $2,590
📍 Current Price: ~$2,605
👉 That means you're currently ~$15 in profit (small gain for now).
📊 Chart-Based Technical Analysis (1D timeframe)
✅ Key Support Levels
$2,423 – Fibonacci 0.382 level
$2,450–$2,475 – Close to the 50 EMA (blue line)
These zones serve as strong support, holding the price up.
🚀 My Entry Strength
You entered at $2,590, which is:
Above EMA 20 (red) — bullish short-term signal
Right in the tight moving average cluster (20/50/200) — often a sign of an upcoming breakout
📈 Risk/Reward Ratio
Entry: $2,590
Stop-Loss: $2,575 → Risk: $115
TP1: $2,743 → Reward: $1530
R/R ratio for TP1: ~1
✔️ Overall: Very good entry with balanced risk.
🔔 Recommendations:
If ETH moves above $2,650, consider moving SL to break-even ($2,590) — protect your capital
Near $2,743, you could:
Close 50% of my position
Or use a trailing stop to lock in more profit
