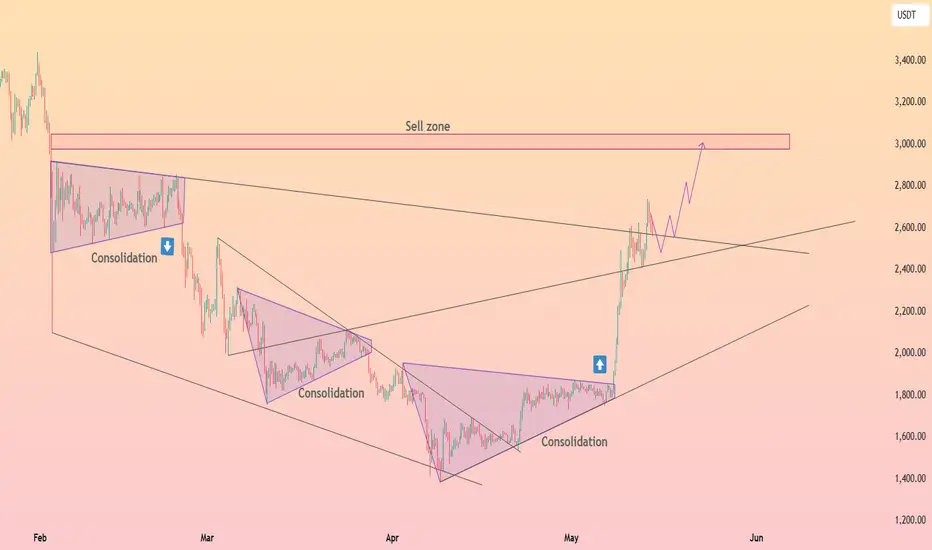
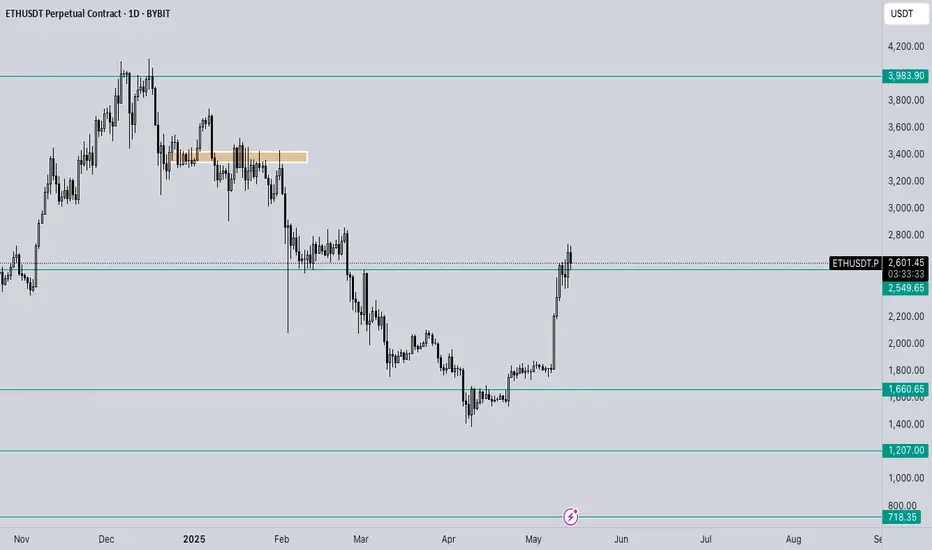
HolderStat┆ETHUSD wedge catapult toward 3kEthereum price tore out of its multi‑month falling wedge and smaller consolidation triangle, blasting through the mid‑2 k range before pausing around 2.7 k. As long as price respects the former wedge roof as trendline support, bulls retain scope to probe the highlighted 2.8‑3.1 k sell zone. A soft pullback into 2.4‑2.5 k would be viewed as a constructive retest rather than trend failure.
ETHUSDT.PS trade ideas
Ethereum (ETH): Targeting Bearish CME Gap | $2,349Ethereum is heading towards our target zone, where we will be looking for another support to form and an upward movement to start from there. We will not try to catch that movement here to downward movement but rather wait for our CME to be filled and then look for a buy entry once again.
Swallow Academy

Ethereum Has Bearish DivergenceI was looking for a local top in Ethereum and altcoins, and somehow forgot to mention this yesterday. Ethereum has bearish divergence with over bought RSI on every time frame from the daily down. This was a great topping signal, but also should indicate a bit more downside. The difference now is that I am looking to buy dips, not sell rips on altcoins.

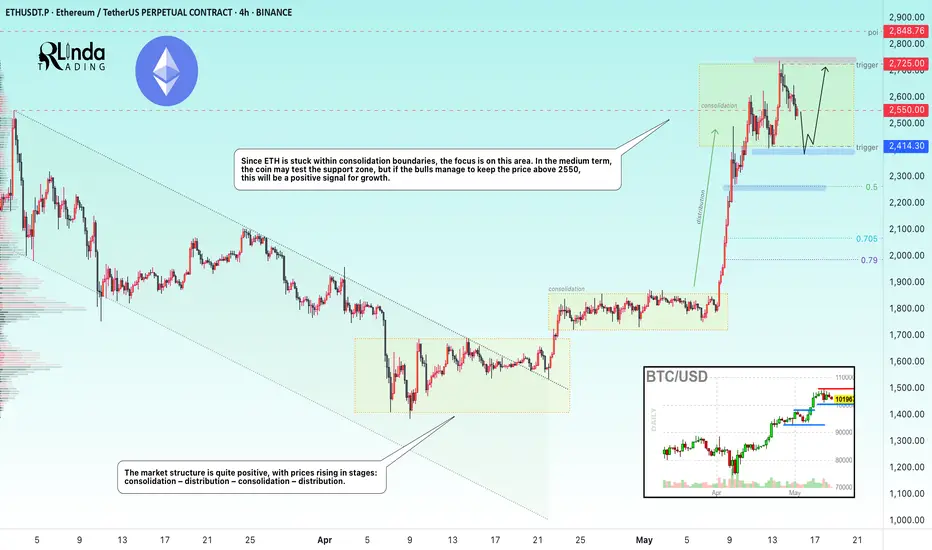
ETHEREUM → Consolidation. Which way will the distribution go?BINANCE:ETHUSDT.P has moved into a consolidation phase after the distribution phase. Focus on the 2414-2725 range. A retest of support is possible during the current phase. Despite the bullish trend, there are risks of a reversal...
ETH has been a fairly unprofitable project over the past few years, with the price hitting one bottom after another. While Bitcoin and altcoins were flying high, ETH has only shown itself to be a bull in the last few days.
In the current phase, the focus is on the consolidation boundaries, as well as the 2550 level. If the bulls keep the market above 2550, then the coin could strengthen to 2725, which would be a positive sign for us that buyers are interested in continued growth.
If ETH continues its correction towards support at 2414, then we will need to monitor the market's reaction to this level. I remain skeptical about ETH due to its weak long-term performance despite a strong fundamental backdrop.
Resistance levels: 2550, 2725
Support levels: 2414, 2260
Further movement will determine the price's exit from consolidation: a breakdown of support means a fall, a breakout of resistance means growth. But the current scenario is trading within the range. If ETH trades near 2725 and forms a pre-breakout consolidation, then we will have a chance for growth.
The opposite scenario is if the price falls below 2550 and begins to test 2414. In this case, sticking to the support level and numerous retests will indicate that the bull market has exhausted its strength and we can expect a correction to 2260-2065.
Best regards, R. Linda!
ETH: The moment looks goodEthereum is trying to show strength. The price is surging and it's important for ETH to not loose the 2350 level. This is an important support zone, loosing it will probably lead the price to $1900-1950
ETH Mid-Term TargetETH will make this chickpea, hazelnut, walnut pattern in the medium term.
**Not investment advice

Will ETH Hit 16% Upside With $3,100 In Sight?Hello and greetings to all the crypto enthusiasts, ✌
All previous targets were nailed ✅! Now, let’s dive into a full analysis of the upcoming price potential for Ethereum 🔍📈.
Ethereum continues its bullish trajectory 🚀 following last week’s impressive rally. With strong volume backing the move, a breakout above the $3,000 psychological level appears imminent. I’m targeting a 16% upside with a primary resistance at $3,100 , supported by daily structure, Fibonacci alignment, and a long-term trendline 🔍.
🧨 Our team's main opinion is: 🧨
Ethereum is gaining momentum with a 16% upside in sight — main target at $3,100 after a clean $3,000 breakout 🚀.
Give me some energy !!
✨We invest hours crafting valuable ideas, and your support means everything—feel free to ask questions in the comments! 😊💬
Cheers, Mad Whale. 🐋

Ethereum Monthly: Bull-Bear Market & Transition Until 2029Ethereum closed five months red, something seen only once in the past in 2018 in a bear market. Needless to say, after such a strong bearish period the market produced an equally strong bull market.
Back in 2018 Ethereum went beyond five months red but this is the only time ever in its history, then now in 2025 this is the longest stretch of continued bearish action. This is good because we know that the market will produce a bull market that is many times stronger, just to balance things out.
These five red months resulted in a long-term higher low.
The bottom was hit at $1,385 in April, last month. This month we already have a full green candle going mid-way through February. All the loses incurred in April and March have been recovered.
The low last month hit levels not seen since March 2023. In March 2023 ETHUSDT was rising but produced first some bearish action; the month closed green. After more than eight months of consolidation it produced a major advance and the highest prices since the 2021 All-Time High.
This time it will be different. Ethereum will be rising steadily, month after month. Rather than sideways-neutral, up-up.
In 2024 there was a double top. March 2024 and December 2024.
In 2025 we will have one top, a blow-off top. So there will be only one chance to sell when prices are really high up.
It will grow steadily month after month as bullish momentum builds up. After several months, we will have a bull run reaching mania levels, euphoria, excitement and a very strong new All-Time High. After this phase is over, the classic bear market in 2026.
The bear market will produce a multi-year low price, then a period of consolidation, sideways-neutral, and then back again bullish, a major bull market in 2029. There will be growth in the transition years, 2027 and 2028. You can equate these with 2023 and 2024.
2022 was the last bear market.
2026 will be the next bear market.
2021 was the last bull market.
2025 is the next bull market.
2023-2024 were the transition years.
2027-2028 will be transition years.
Thank you for reading.
Namaste.

Ethereum Ethusdt Elliott wave impulse
Altseason in July
1bearishing all market
2bitcoin season
3altseason
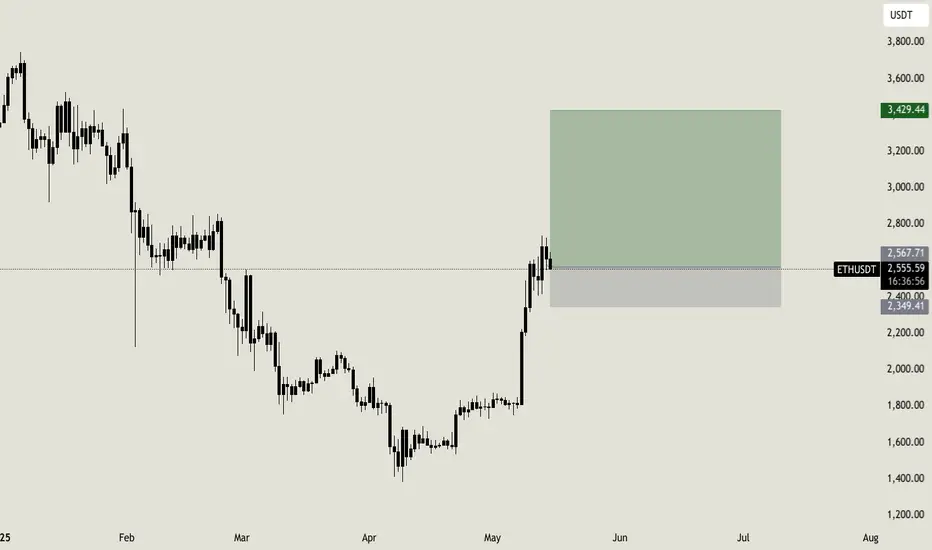
ETH - Ranges overview Let's have a look at how ETH is currently trading.
From a monthly (1 month) perspective we have deviated the sellside and have started to regain 2.5K.
IF we hold 2550 expect us to push back up towards the buyside liquidity sitting around 3.4K and 4K as second target IF the market holds.
IF we get a clean break below 2.2K expect us to retrace towards 1.8K.
BE PATIENT...WAIT FOR THE MARKET...TRADE WITH IT.
As always in crypto...keep an eye on BTC who will be the main indicator.
For those who have been trading ETH for more than 5 years you'll fully understand the importance of 2.5K.
For the rest...TRUST YOUR SYSTEM and WAIT FOR THE MARKET TO SHOW YOU ITS HAND.
Stay safe and never risk more than 1-5% of your capital per trade. The following analysis is merely a price action based analysis and does not constitute financial advice in any form.
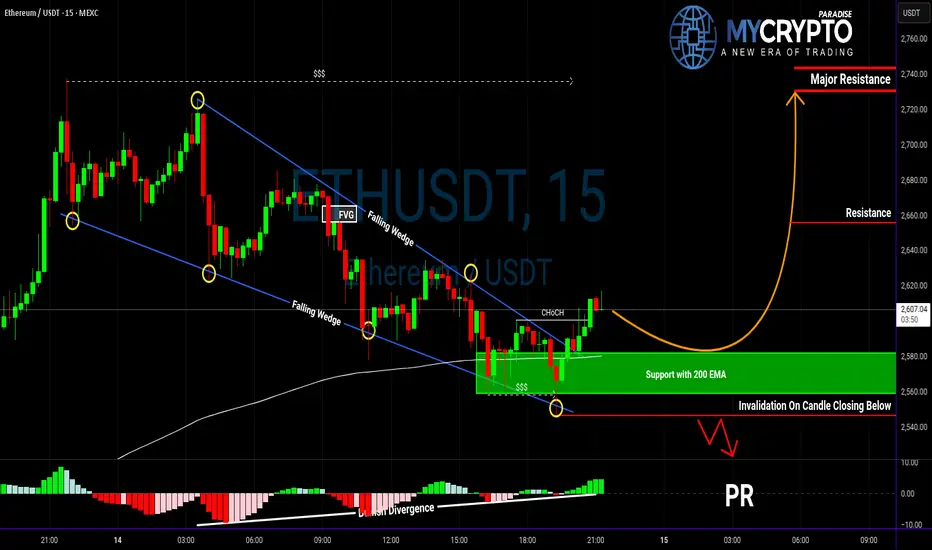
ETH Bulls on Alert: Is This the Move We've Been Waiting For?Yello Paradisers, did you catch that bullish breakout on ETH or are you still stuck waiting for confirmation?
💎Ethereum has officially broken out of its falling wedge pattern, which is a well-known bullish structure often signaling a trend reversal. What gives this breakout even more weight is that ETH has established a support zone exactly at the 200 EMA—an area that historically acts as a key level for institutional traders.
💎Adding to the bullish case, we’ve also identified a bullish divergence on the momentum indicators, which often suggests weakening selling pressure and the potential for upside. More importantly, there has been a clear bullish CHoCH (Change of Character), confirming that market structure is shifting in favor of the bulls. With all of these signals aligning, the probability of a continued bullish move is significantly higher.
💎However, the most disciplined traders understand that no setup is perfect without confirmation. A pullback to the support zone would offer a textbook opportunity for a high-risk-to-reward entry—ideal for bulls who are patiently waiting for a safer entry point rather than chasing the move. This kind of setup allows us to manage our risk properly and act only when the odds are clearly in our favor.
💎That said, if the price breaks down and closes below the support zone, the bullish idea is completely invalidated. This is the level where we draw the line and step aside. Being able to invalidate your own bias is what separates traders who survive from those who don't.
🎖We are playing it safe right now. If you want to be consistently profitable, you need to be extremely patient and always wait only for the best, highest probability trading opportunities.
MyCryptoParadise
iFeel the success🌴
Bitcoin Wave Analysis.Bitcoin (1D) Wave Analysis:
BTC/Tether Perpetual Futures on the daily chart displays a consistent wave pattern.
The first impulse saw an 11.4% rise, followed by an 8-day consolidation.
A second impulse of 9.1% preceded a 13-day consolidation.
The third impulse delivered a 9.6% gain, with a subsequent 5-day consolidation.
With an average impulse range of 10%, a fourth impulse is projected, potentially pushing #BTC to new highs.
The current price is approximately $103,000 which is about 7% below the 52-week high and all-time high of $109,967 reached on January 20, 2025.
The three prior legs were driven by a combination of macroeconomic and market factors: the US-China Tariff Agreement, strong corporate earnings, a benign inflation report, and the S&P500 crossing above its 200-day moving average.
These catalysts fueled bullish sentiment across markets, including #BTC. However, for a fourth leg to materialize, BTC may require another strong catalyst. Without such a trigger, it might struggle to muster the momentum needed for a new impulse.
Having already seen three impulses, BTC is on the horizon to challenge the 52-week high and all-time high levels.
The key question is whether buyers have enough strength to drive another impulse (leg). If this occurs, will it be sufficient to break through and establish a new all-time high ?

Don't overlook the buying opportunities that may arise.Hello friends.
The growth that Ethereum has had in the past few days can be up to the range it is currently in.
If you are left with the profit that Ethereum has made in the past few days, you can make your purchases in case of correction.
How long can this correction last?
If Ethereum corrects, you can complete your purchases below the $2,000 range for fair purchases.
Is it possible that it will correct further?
Yes, it is possible that it will correct further, so you can divide the amount of capital you want to buy into two parts, so that the second step is lower in case of correction.

I see ETH break the trend lineETH owner buy enough coin in their wallet with breaking the descend line.

ETH => Shift In Momentum Almost Done!Hello TradingView Family / Fellow Traders. This is Richard, also known as theSignalyst.
📉 Since breaking below its last major low in December 2024, Ethereum (ETH) has been stuck in a bearish trend.
But don’t lose hope, bulls! 🐂
⚠️It’s evident from the last correction phase, marked in blue, that it's larger than the previous ones — a clear sign that the bulls are stronger than ever.
A growing correction phase is often the first signal of an upcoming momentum shift.
This shift will be confirmed once ETH breaks above the last major high marked in red at $2,100.
📈A break above $2,100 would flip ETH’s trend from bearish to bullish, signaling the potential start of the Altcoin season!
Until then, patience is key. 🧘♂️
📚 Always follow your trading plan regarding entry, risk management, and trade management.
Good luck!
All Strategies Are Good; If Managed Properly!
~Rich

Ethereum ETH Will Go Insane Soon!Hello, Skyrexians!
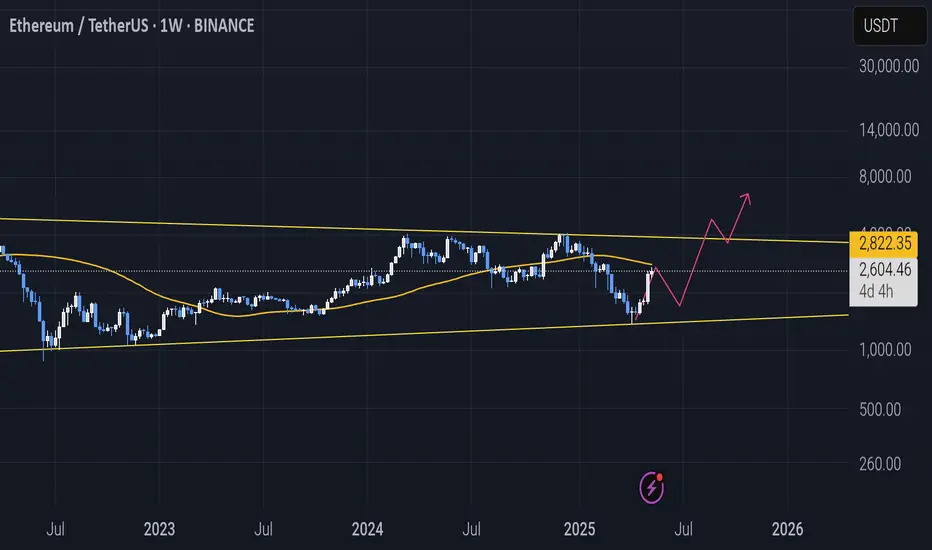
It's not a top secret that Bitcoin dominance is about to finish the uptrend and it can give the second life to BINANCE:ETHUSDT . We have already seen the bounce, but now asset is struggling to break through $2600. We can really see small correction in the upcoming week, but finally uptrend has been already confirmed.
Let's take a look at the weekly chart. I marked the Elliott waves structure for you and in my opinion now price is printing the wave 3. At the bottom there was a green dot on Bullish/Bearish Reversal Bar Indicator which is huge confirmation of the bull run. The target for wave 3 is 1.61 Fibonacci at $6500. Anyway, please take into account the second scenario, when BTC dominance will reach 67% and ETH will retest the low (wave 5 in C). Now I have 50/50 probability, but anyway if you bought alts at the 65.3% dominance your deposit will not suffer significantly.
Best regards,
Ivan Skyrexio
___________________________________________________________
Please, boost this article and subscribe our page if you like analysis!

Ethereum (ETH): We Reached Our Major Target | Possible DropWe reached our major target zone where ETH touched the $2,700 area (where we caught the movement from $1,950 to $2,700). We had a good upward movement and now it is time for a smaller correctional movement before another BOS and bullish movement.
Now we also might not see the correctional movement that would fill the bearish CME gap (but it would be an ideal buy zone for us). The other scenario would be seeing a proper BOS on smaller timeframes with a successful retest.
Swallow Academy

Bump and Run Reversal Bottom Pattern (BARR)Ethereum on Daily Tim Frame formed a bump and run reversal bottom pattern which is a bullish reversal pattern. During the beginning of the pattern, price often follows a down-sloping trendline that ranges from 0 to 45 degrees or little more in rare cases. Afterwards, a sharp decline in the price of an asset happens that is often followed by a relief bounce till the price touches key resistance level. A breakout above this key resistance level confirms the validity of Bump and Run Reversal Bottom Pattern.
Ethereum broke the key resistance level and we are expecting the price to retest the broken structure and trendline before it continues to upside and the target price measured from Lead In phase. In this scenario Ethereum looks more bullish then ever and all Atl coins will follow suit.
Also Ethereum’s major Pectra upgrade, combining Prague and Electra, went live on May 7, 2025. It introduced 11 key changes to improve speed, cost-efficiency, and usability which helped the price of Ethereum to bump to the upside.

Don't miss Ethereum todayHello friends
Given the good rise we had, you can see that the price has entered a correction and has provided us with a good opportunity to buy in steps, of course with capital and risk management.
*Trade safely with us*


It's just one lineSimplicity meets precision.
This single line captures every major support and resistance level on the ETH/USDT chart — no clutter, just clarity.
Whether you're a breakout trader or range hunter, this level tells the whole story. Watch closely how price respects it.
#ETH #Ethereum #Crypto #SupportResistance #TradingView #CryptoAnalysis #PriceAction

HOW: TradeAgent Pro Technical Analysis FrameworkWelcome to our technical analysis community! This comprehensive guide explores advanced trading concepts and systematic risk management approaches.
SYSTEM OVERVIEW
TradeAgent Pro combines multiple technical analysis tools into an educational framework for market analysis and risk management.
KEY FEATURES:
1. Advanced Market Analysis
• Multi-Timeframe Integration
- Long-term trend identification (EMA/SMA)
- Short-term momentum signals
- Market structure validation
• Visual Confirmation System
- Strong trends: Green/Red signals
- Moderate trends: Yellow/Orange indicators
- Multiple confirmation points
2. Risk Management Suite
• Dynamic Stop Loss Technology
- ATR-based volatility adaptation
- Multiple timeframe validation
- Automatic adjustment system
• Strategic Take Profit Framework
- Multiple TP levels
- Position scaling methodology
- Risk-reward optimization
• Intelligent Trailing System
- Dynamic trailing activation
- Position-based adjustments
- Momentum-driven modifications
3. Professional Tools
• Entry Management
- Systematic confirmation signals
- Risk-adjusted sizing
- Market structure analysis
• Exit Framework
- Multiple exit strategies
- Risk reduction system
- Position adjustment logic
EDUCATIONAL RESOURCES:
• Regular technical analysis updates
• Community trading discussions
• Educational content sharing
• Risk management concepts
IMPLEMENTATION GUIDE:
1. Study the framework thoroughly
2. Practice in demo environment
3. Document your observations
4. Adapt to market conditions
5. Focus on risk management first
IMPORTANT DISCLAIMERS:
• Educational content only
• Not financial advice
• Requires extensive testing
• Trading involves significant risk
• Past performance isn't indicative
JOIN OUR COMMUNITY:
1. Send private message
2. Include:
- Trading experience
- Preferred markets
- Analysis timeframes
3. Await verification
No public access requests.
Stay updated with our latest educational content and technical analysis discussions.

Short trade 🟥 Sellside Trade Log
📉 Pair: ETH/USD
🏷️ Type: Intraday | NY Session PM
🧠 Setup: Breakout (Downside)
📅 Date: Tuesday, 13th May 2025
🕕 Time: 6:20 PM
🔹 Entry Price: 2,702.20
🔹 Profit Target: 2,654.27 (-1.77%)
🔹 Stop Loss: 2,710.31 (+0.30%)
🔹 Risk-Reward Ratio: 5.91
🔍 Reasoning:
Sellside breakout trade assumes a clear momentum-driven directional bias during the NY PM session. The move was reinforced by forming a Fair Value Gap (FVG) on the lower timeframe (5min), indicating institutional selling pressure and inefficiency. Price broke below a key structural level and continued into the FVG, confirming bearish intent. Entry was taken with confluence from the gap, targeting the next liquidity pool while maintaining tight stop control above the invalidation zone.
5min TF entry
