Ethereum at Key Resistance After Short Squeeze BounceEthereum recently found a local bottom at $2,111, triggering a sharp bounce that resembles a short squeeze. However, the rally has met a significant resistance zone—a former support level now flipped into resistance. This zone is technically loaded with multiple confluences: the point of control, th
Related pairs

ETHUSDT.P I Daily CLS I KL OB I Model 1Yo Market Warriors ⚔️
Fresh outlook drop — if you’ve been riding with me, you already know:
🎯My system is 100% mechanical. No emotions. No trend lines. No subjective guessing. Just precision, structure, and sniper entries.
🧠 What’s CLS?
It’s the real smart money. The invisible hand behind $7T/d

Ethereum's Rally Looks Like a Trap. Here's Why.In this analysis, you will find a clear scenario for a potential short setup with precise conditions for confirmation and invalidation. No fluff or guesswork—only institutional analysis of capital footprints and pure price action. I will provide updates for every stage of price interaction with the

$ETH: The 1-week chart is an absolute disaster!Once again, I want to make it clear: I’m naturally a bull. But I live in Thailand, far from the noise of influencers shouting "buy, buy, buy!" I’ve learned my lesson—when they scream buy, you get rekt. That’s why I rely solely on the charts.
Charts are just mathematics—they don’t lie. So here’s my

ETH Building Blocks - Keep it Simple🧱 Building Block - ETH Weekly Analysis 🧱
Ethereum has been trading within a well-defined structure, respecting key horizontal zones — each acting as a crucial building block in ETH’s macro journey.
🔹 Zone 1 ($1,700 - $2,100)
A strong demand and accumulation zone. ETH bounced from here multiple

Ethereum (ETH): Buyers Taking Back Control!Ethereum had a nasty fall both on Sunday and Saturday where price dipped from $2500 to $2100.
Despite that movement took place during the weekends it was harsh one and we are expecting osme kidn of re-test to happen towards the local broken area (near 200EMA).
Swallow Academy

Ethereum (ETH): Buyers Dominating | Going For $3000Ethereum is pushing, and we are back near EMAs and possibly going for another breakout attempt from here.
We are looking for a proper breakout, which would then trigger for us an opportunity for a long position towards the $3000.
Swallow Academy

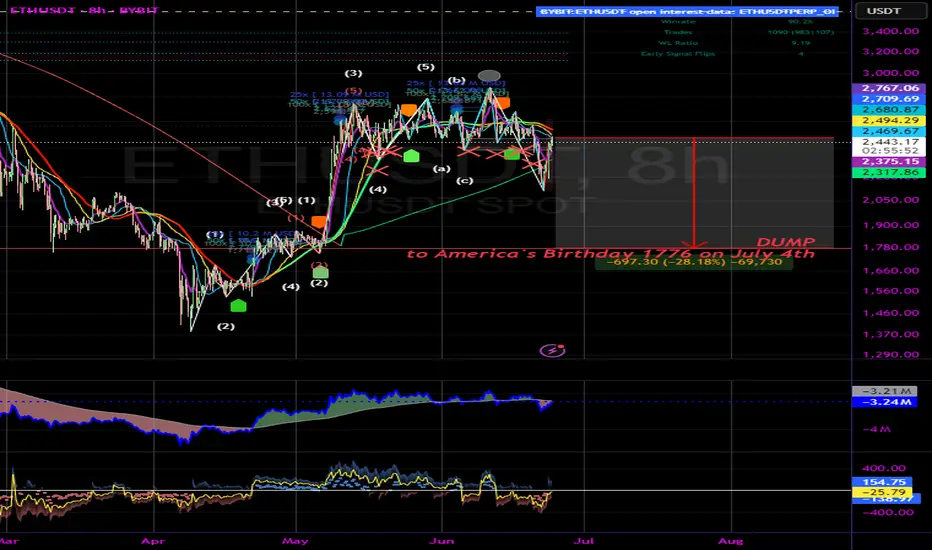
ETH Dumping to 1776 in honor of America's birthdayBART express incoming. Nice liquidity grab down there as well.
Not financial advice.
Happy July 4th!
#ETHUSDT: Currently On The Way Towards Filling The FVG?ETCUSDT is currently experiencing a significant correction as the price approaches a pivotal juncture where a substantial bullish price reversal is anticipated, potentially propelling it to new all-time highs or even surpassing them. It is imperative to exercise meticulous risk management and conduc

ETHEREUM → Rally and liquidity capture. Up or down?BINANCE:ETHUSDT.P is strengthening following Bitcoin. This is a reaction to developments in the Middle East, namely Trump's comments on peace. But there are doubts...
The crypto market is reacting to the situation in the Middle East, namely Trump's statements about peace. But apart from him, n

See all ideas
Summarizing what the indicators are suggesting.
Oscillators
Neutral
SellBuy
Strong sellStrong buy
Strong sellSellNeutralBuyStrong buy
Oscillators
Neutral
SellBuy
Strong sellStrong buy
Strong sellSellNeutralBuyStrong buy
Summary
Neutral
SellBuy
Strong sellStrong buy
Strong sellSellNeutralBuyStrong buy
Summary
Neutral
SellBuy
Strong sellStrong buy
Strong sellSellNeutralBuyStrong buy
Summary
Neutral
SellBuy
Strong sellStrong buy
Strong sellSellNeutralBuyStrong buy
Moving Averages
Neutral
SellBuy
Strong sellStrong buy
Strong sellSellNeutralBuyStrong buy
Moving Averages
Neutral
SellBuy
Strong sellStrong buy
Strong sellSellNeutralBuyStrong buy
Displays a symbol's price movements over previous years to identify recurring trends.
Frequently Asked Questions
The current price of Ethereum / Tether (ETH) is 2,461.57 USDT — it has risen 3.08% in the past 24 hours. Try placing this info into the context by checking out what coins are also gaining and losing at the moment and seeing ETH price chart.
Ethereum / Tether price has risen by 9.34% over the last week, its month performance shows a −4.59% decrease, and as for the last year, Ethereum / Tether has decreased by −27.15%. See more dynamics on ETH price chart.
Keep track of coins' changes with our Crypto Coins Heatmap.
Keep track of coins' changes with our Crypto Coins Heatmap.
Ethereum / Tether (ETH) reached its highest price on Nov 10, 2021 — it amounted to 4,868.48 USDT. Find more insights on the ETH price chart.
See the list of crypto gainers and choose what best fits your strategy.
See the list of crypto gainers and choose what best fits your strategy.
Ethereum / Tether (ETH) reached the lowest price of 82.00 USDT on Dec 15, 2018. View more Ethereum / Tether dynamics on the price chart.
See the list of crypto losers to find unexpected opportunities.
See the list of crypto losers to find unexpected opportunities.
The safest choice when buying ETH is to go to a well-known crypto exchange. Some of the popular names are Binance, Coinbase, Kraken. But you'll have to find a reliable broker and create an account first. You can trade ETH right from TradingView charts — just choose a broker and connect to your account.
Crypto markets are famous for their volatility, so one should study all the available stats before adding crypto assets to their portfolio. Very often it's technical analysis that comes in handy. We prepared technical ratings for Ethereum / Tether (ETH): today its technical analysis shows the neutral signal, and according to the 1 week rating ETH shows the neutral signal. And you'd better dig deeper and study 1 month rating too — it's sell. Find inspiration in Ethereum / Tether trading ideas and keep track of what's moving crypto markets with our crypto news feed.
Ethereum / Tether (ETH) is just as reliable as any other crypto asset — this corner of the world market is highly volatile. Today, for instance, Ethereum / Tether is estimated as 3.69% volatile. The only thing it means is that you must prepare and examine all available information before making a decision. And if you're not sure about Ethereum / Tether, you can find more inspiration in our curated watchlists.
You can discuss Ethereum / Tether (ETH) with other users in our public chats, Minds or in the comments to Ideas.