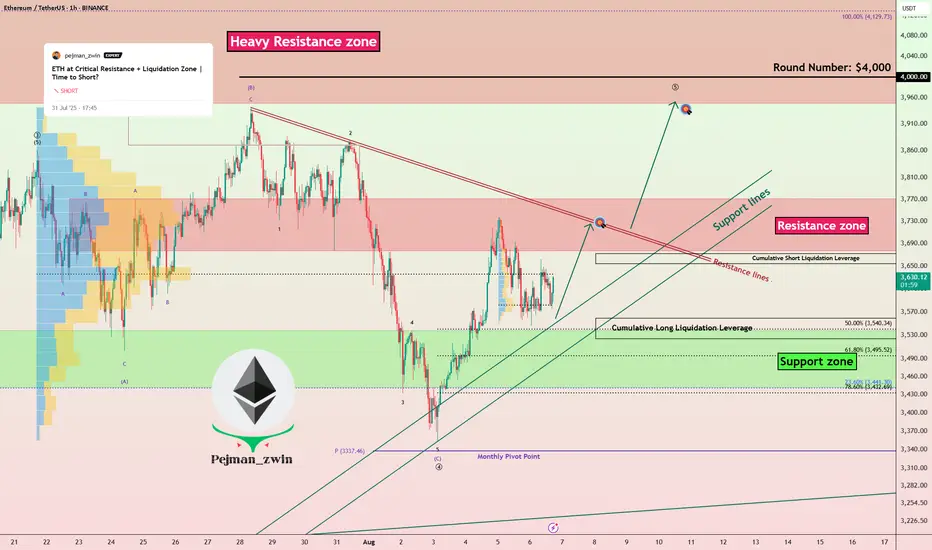
Ethereum Ready to Attack Resistances — Time to Long ETH?Ethereum ( BINANCE:ETHUSDT ) fell to the Support zone($3,538-$3,442) and Support lines as I expected in the previous idea .
Ethereum is currently trading near the Support zone($3,538-$3,442) , Support lines , and Cumulative Long Liquidation Leverage($3,559-$3,524) .
In terms of Elliott Wave theory , it seems that Ethereum has completed the main wave 4 . The main wave 4 has an Expanding Flat structure(ABC/3-3-5) . To confirm the main wave 4, we must wait for the Resistance zone($3,771-$3,677) and Resistance lines to be broken.
I expect Ethereum to trend higher in the coming hours and attack the Resistance lines and Resistance zone($3,771-$3,677) .
Cumulative Short Liquidation Leverage: $3,672-$3,645
Note: Stop Loss: $3,450 =Worst
Please respect each other's ideas and express them politely if you agree or disagree.
Ethereum Analyze (ETHUSDT), 1-hour time frame.
Be sure to follow the updated ideas.
Do not forget to put a Stop loss for your positions (For every position you want to open).
Please follow your strategy and updates; this is just my Idea, and I will gladly see your ideas in this post.
Please do not forget the ✅' like '✅ button 🙏😊 & Share it with your friends; thanks, and Trade safe.
ETHUSDT trade ideas
ETH - Eyes on a New All-Time High?ETHUSDT has been on fire lately, following a textbook bullish structure of Impulse → Fakeout → Impulse.
After breaking above the previous range in July, ETH confirmed strength with a sharp impulse move, only to shake out weak hands via a fakeout retest before pushing higher again. 📈
Currently, ETH is in the midst of another impulsive leg, with the next major target sitting at the ATH around $4,876.
📊 Key Notes:
- Fakeouts have served as liquidity grabs before strong rallies 🏹
- Current momentum favors the bulls 🐂
- As long as price holds above the last breakout zone (~$4,050–$4,150), the path of least resistance remains up.
🎯 Next Stop: ATH and beyond if bullish pressure sustains.
📚 Always follow your trading plan regarding entry, risk management, and trade management.
Good luck!
All Strategies Are Good; If Managed Properly!
~Richard Nasr

ETH Started Another Impulsive Wave!ETH Started Another Impulsive Wave!
Today ETH ended another bullish wave and is expected to rise further.
The price reaction looks good so far. The market is expecting a rate cut by the FED during the September meeting. According to Reuters, the chances of a rate cut by the FED increase to 85.5%.
It seems that the cryptocurrency market is also absorbing the news and ETH could benefit from this volume in the short term to rise to 3850.
You may find more details in the chart!
Thank you and Good Luck!
PS: Please support with a like or comment if you find this analysis useful for your trading day

my view on ethAfter carefully observing the current ETH price structure, I’m leaning toward a bearish bias in the short to mid-term.
As always, this is not financial advice — just sharing my personal view based on market structure and price action. Risk management remains the most important tool in this game.

Ethereum: just a little bit correction hereHello guys!
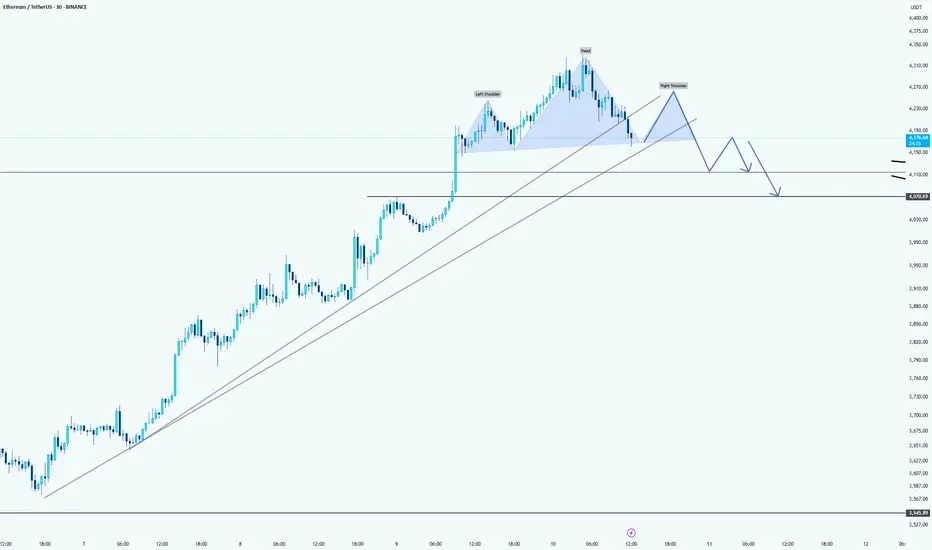
Chart Pattern: Head and Shoulders
The chart shows a Head and Shoulders pattern forming on the Ethereum price action. The trendline drawn across the neckline of the pattern is a crucial support level to monitor.
Potential Breakdown:
If Ethereum fails to hold above the neckline (around $4,130), we might see a pullback and potentially a breakdown from the pattern. This suggests a bearish outlook for ETH in the short term.
Target:
A possible target for this bearish move could be around th e $4,050 - $4,100 range , where the price could find support from the upward trendline (in light gray). The price may retrace towards these levels before deciding whether it will continue higher or confirm further downside.
Uptrend Support:
Ethereum remains in an overall uptrend, as indicated by the sloping upward trendline beneath the price action. If the price pulls back to this trendline and holds, there could still be bullish potential.
Ethereum's Last Wave? Bearish Trend Incoming!Ethereum ( BINANCE:ETHUSDT ) started to rise and pump as I expected in the previous idea .
Ethereum is currently trading in a Heavy Resistance zone($4,868(ATH)-$3,977) near the Potential Reversal Zone(PRZ) , Cumulative Short Liquidation Leverage($4,527-$4,452) , and the upper line of the ascending channel(potential) .
In terms of Elliott Wave theory , Ethereum appears to be completing microwave 5 of main wave 5 . Main wave 5 could complete at the Potential Reversal Zone(PRZ) .
Also, we can see the Regular Divergence(RD-) between Consecutive Peaks .
Before any conclusions, let's take a look at the ETHBTC ( BINANCE:ETHBTC ) chart.
ETHBTC also indicates the end of the uptrend, and if the market falls , we can expect ETH and the tokens on the Ethereum blockchain to undergo a correction this time.
I expect Ethereum to bearish trend in the coming days and at least close the CME Gap($4,185-$4,080) .
One of the tokens that we can use for short positions alongside Ethereum is the ENS token ( BINANCE:ENSUSDT ). ENS is the decentralized naming system built directly on the Ethereum blockchain, simplifying crypto addresses into human-readable names .
Cumulative Long Liquidation Leverage: $4,145-$4,094
CME Gap: $3,461-$3,417
Note: Stop Loss: $4,780
Do you think Ethereum will create a new All-Time High(ATH) soon, or should we wait for a correction?
Please respect each other's ideas and express them politely if you agree or disagree.
Ethereum Analyze (ETHUSDT), 4-hour time frame.
Be sure to follow the updated ideas.
Do not forget to put a Stop loss for your positions (For every position you want to open).
Please follow your strategy and updates; this is just my Idea, and I will gladly see your ideas in this post.
Please do not forget the ✅' like '✅ button 🙏😊 & Share it with your friends; thanks, and Trade safe.

ETH Remains Bullish – No Reversal Signals YetETH Remains Bullish – No Reversal Signals Yet
Following our earlier analysis, ETH has surged from the $2,500 zone to $4,300, showing a strong and sustained bullish trend.
Currently, there are no signs of a reversal, and momentum remains intact across multiple time frames.
I've prepared a multi-timeframe analysis indicating that ETH has the potential to reach $4,800 as a minimum target, with room for further upside if bullish conditions persist.
You may watch the analysis for further details!
Thank you!

ETH | NEW ATH or DUMP ?Ethereum recently peaked at $3900. And allthough this is not a new ATH (close by a few hundred dollars), it is a local high for the year.
My last update was on an inverse Head and Shoulders pattern on ETH, which has since increased over 50%:
(The original idea here:)
The question now, is what's next for ETH - further increase, or are the increases over for the near term and is a correction more likely?
I'm going to say that the increases for ETH are over for now. This is because we correction is most definitely due after such a large increase in a fairly short timeframe. I'm not saying we're heading into a full out bearish cycle, but a 20-25% correction would be most normal at this point.
Additionally, XRP has also made it's peak and lost the high, now trading just under $3. This is a strong sign that the alts have likely already rallied, since XRP used to be the last to increase (if it increased at all, historically. (Thanks Jedd).
I was very lucky to call that top here:
Either way, buyers may use this correction to scoop up on smaller alts over the next few weeks. This ultimately depends on whether the market has ONE MORE pump, and if the correction will bounce back from a 20-25% pullback.
_________________
BINANCE:ETHUSDT

Ethereum ETH price analysis📉 Three possible scenarios for #Ethereum CRYPTOCAP:ETH :
🟢 Bullish:
Minor correction to $3950–$4000, followed by a breakout to new all-time highs (ATH).
🟡 Neutral:
Drop to $3400, bounce to $3950 — and then the decision point: breakout or breakdown?
🔴 Bearish:
Deeper correction to $2650 — possibly the last great buying opportunity before the next major rally.
👉 Which scenario for OKX:ETHUSDT resonates most with you?
Let us know in the comments!

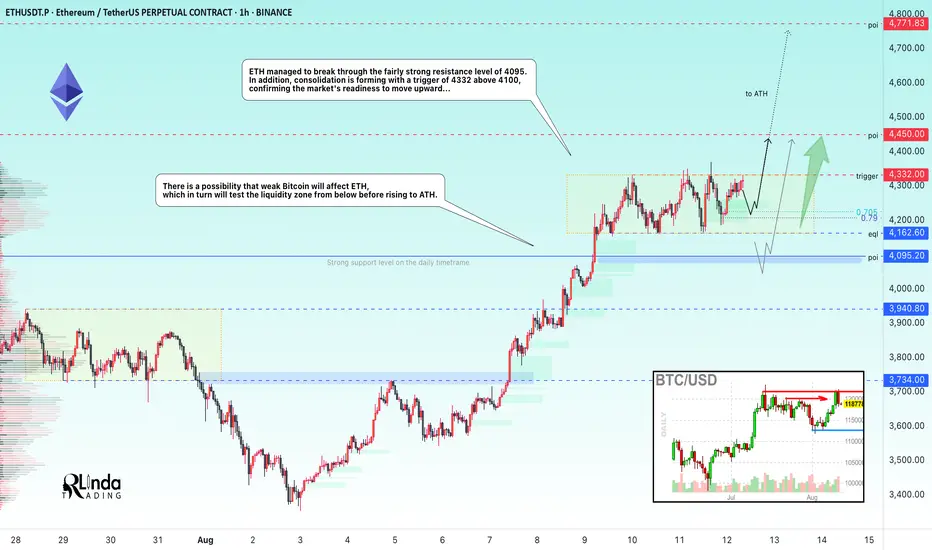
ETHUSDT → A new range has been opened. Onward to ATH!BINANCE:ETHUSDT is breaking through strong resistance formed in the 4090-4100 area on D1-W1. Consolidation is forming after strong growth, which can be seen as a positive sign.
Bitcoin has been looking quite weak recently against ETH, which continues to rally despite Monday's red market. ETH managed to break through the fairly strong resistance level of 4095, and after a strong 25% rally, the price moved into consolidation (trading range 4325-4160, with resistance at 4325 as the trigger). Technically, we see that the market has stopped updating local lows, and a fourth retest of resistance is forming with reduced volatility, which in general could lead to a breakout attempt. Consolidation of the price above the consolidation resistance could trigger further growth. A channel to the ATH is open...
Resistance levels: 4325, 4450, 4800
Support levels: 4220, 4162, 4095
ETH is quite strong and the market may not allow the price to fall too low, as there is a lot of excitement. However, I do not rule out the possibility that weak Bitcoin will affect ETH, which in turn will test the liquidity zone (4162 - 4095) from below before rising to ATH.
Best regards, R. Linda!
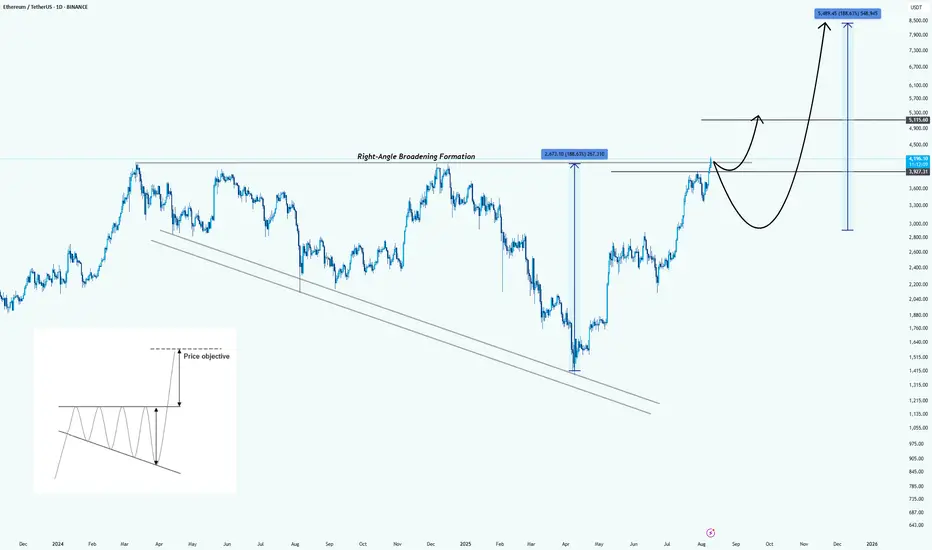
Ethereum: Formed a Right-Angle Broadening FormationHello guys!
Pattern Identified:
This is a Right-Angle Broadening Formation (characterized by a flat resistance level at the top (around $4,200 – $4,300) and a rising lower trendline). It shows increasingly volatile swings upward while repeatedly testing the same ceiling.
Technical Implication:
RABFs are typically bullish continuation patterns. The flat top acts as a breakout trigger, while the rising base indicates consistently higher lows and aggressive buyer support.
Price Objective:
According to the pattern’s measured move principle, the breakout target is projected by the vertical height of the formation, added to the breakout point:
Height : $2,070
Breakout point : $4,300
Target : $6,370 (first objective)
Extended bullish run could reach $8,500 if momentum sustains.
Key Levels:
Resistance: $4,200 – $4,300 (breakout trigger)
Support: $3,700, then $3,200
First measured target: $6,370
Extended target: $8,500
Bullish Scenario:
Strong daily close above $4,300 with volume could kickstart a rapid move toward the first target, possibly with only a brief consolidation at $5,100 before continuation.
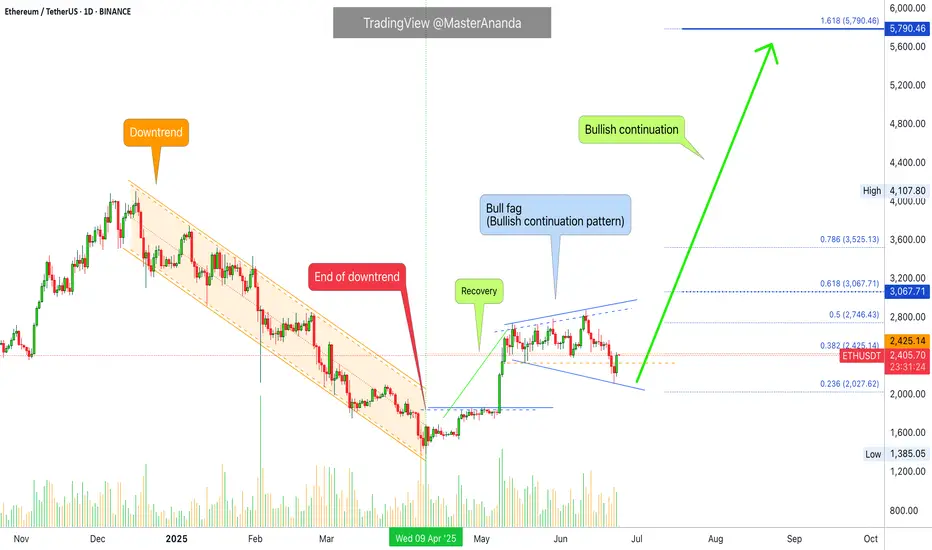
Ethereum vs Small Cap. & The 2025-26 Cryptocurrency Bull MarketThe last three days ended up being a very nice flush, a strong one but the action quickly recovered above the 18-May low.
Ethereum was trading above $2,300 since mid-May and always stayed above this level. It broke suddenly below, out of nowhere, but the action is bullish again. We can say that this was a stop-loss hunt event, a bear-trap and nothing more or else we would see a continuation of the bearish action rather than a strong inverse reaction, a bullish jump.
It is not only Ethereum of course that is experiencing this type of bullish action, some altcoins are going nuts. Really crazy right now producing so much momentum that people are still wondering if the market is going down... Or is it going up?
It is obviously up, just look at the 7-April low.
Ethereum hit a low of $1,385 on 7-April. The higher low yesterday ended at $2,111.
You see what I mean?
The market is ultra-bullish because the last low is so far away. It is impossible that it will be tested even less possible for it to break. Ok, so a market shakeout we agree but now that the shakeout is complete what is supposed to happen next?
Watch the smaller altcoins.
Thank you for reading.
Namaste.
ETH ~ Ive given him some laxatives!okay, me giving him laxative means you know what gonna happen and till where it gonna fall loololl
DeGRAM | ETHUSD above the resistance line📊 Technical Analysis
● ETHUSD broke above the long-term resistance at ~$4,027, confirming a bullish continuation from the rising purple trend channel.
● Price retested that breakout as support and is setting up for a measured move toward the key $4,926 supply zone, with on‑chart channel geometry and breakout structure supporting further upside.
💡 Fundamental Analysis
● Spot Ethereum ETFs surged with record trading volume of $2.725 B on August 11, signaling strong institutional and retail demand.
● Derivatives market is deepening—Ethereum futures open interest exceeded $30 B, while CME futures hit a record $7.85 B—as institutional flows fuel momentum.
● Corporate treasury adoption jumped sharply: small public companies now hold 966,000 ETH ($3.5 B), underscoring real‑asset confidence.
✨ Summary
Buy above $4,027; target $4,926. Setup remains valid while holding above $4,000.
-------------------
Share your opinion in the comments and support the idea with like. Thanks for your support!

ETH looking bad while reaching ATHThe price is rewriting its local ATH and pushing for a breakout toward a new all-time high.
However… the chart still looks like crap.
How long can this kind of growth last? Let’s break it down:
➡️ First thing you notice — almost flat buying volume for the last two months. The price is climbing, but there’s practically no buying volume behind it. Historically, real breakouts to new highs are accompanied by massive volume spikes and strong volatility.
ETH, on the other hand, is just cruising up like a chill guy. That doesn’t mean there’s huge demand — it just means nobody’s in a rush to sell.
➡️ Money Flow — even worse. The indicator shows a divergence with price. These current levels were reached while liquidity was actually flowing out of ETH and positions were being closed. This only confirms that interest in the asset is still declining.
➡️ Along the way, two large gaps have formed — at $3556–2981 and $2474–1851. And as we all know, in 99% of cases, gaps get filled sooner or later.
➡️ Price is also still moving inside an ascending channel and is currently testing the upper boundary — right at the major resistance of $4377.
📌 Conclusion:
Right now, market sentiment on ETH is insanely bullish. People are already talking about $10,000 like it’s around the corner. But the chart doesn’t look genuinely impressive — similar to what we saw with Bitcoin last year.
In my view, even $5,000 seems like a distant dream at this point. And let’s not forget — we’ve had an unreal bullish summer, which is extremely rare for crypto. Do you really think this rally will just keep going in September? And in October? And that bear markets are gone forever?
Yeah… not so fast 😁

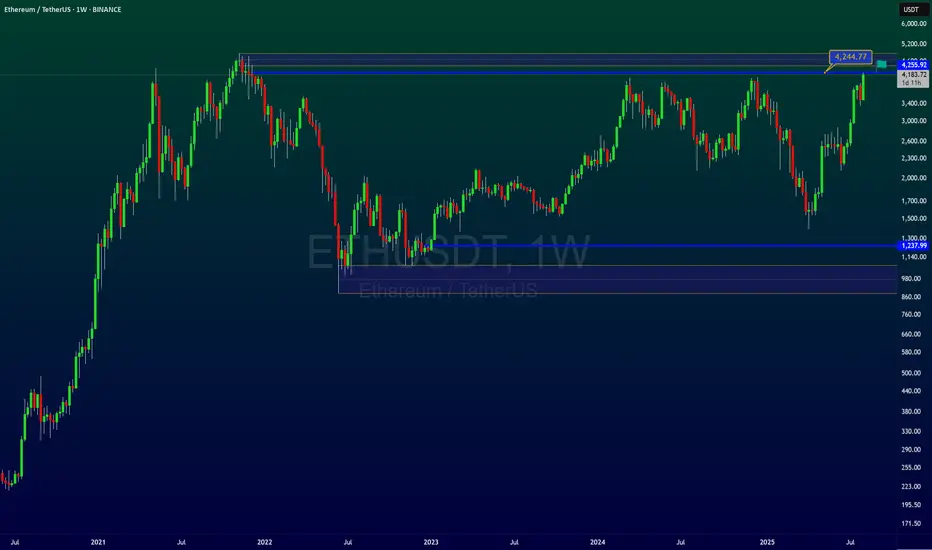
ETH at 4.5 yr resistance. Whats next ??1) if it brakes resistance it goes to $5k sooner
2) if it gets rejected at resistance it goes to $5k later

ETH is ready to Drop Sharply Now it time to Short ETH, a big drop is going to start .
Fasten your seatbelt

ETH Highly chance to go bearish Basic structure levels are indicating the sell there's a huge supply to sell


ETHUSDT 4H Breakout: Symmetrical Triangle Targets AheadMEXC:ETHUSDT
Key Elements:
Pattern: The chart shows a symmetrical triangle pattern formed by two converging trendlines connecting the highs (resistance) and lows (support). The breakout appears to have occurred upward from point D, with a measured move of 1.683 times the height of the triangle (from 0.619 to 4.49).
Price Levels:
Entry/Breakout Point (D): Approximately 4.49.
Stop Loss: Set at 4,333.59, just below the upper trendline and recent high.
Targets:Target 1: 4,047.34.
Target 2: 3,963.67.
Target 3: 3,651.82.
The price range spans from around 3,250 to 4,500 USDT.
Indicators:The triangle's height (0.619) and the breakout move (4.49) suggest a calculated target projection.
Green and red candlesticks indicate bullish and bearish periods, respectively.
Analysis:The upward breakout from the triangle suggests bullish momentum, with the price potentially aiming for the listed targets.
The stop loss at 4,333.59 is strategically placed to limit downside risk if the breakout fails.
The targets decrease incrementally, indicating a possible profit-taking strategy as the price progresses.

ETH all time high or reverse????Ethereum has returned to the top after a long time and is on the verge of breaking the top, but in my opinion this will not happen. Of course, it is possible to see new prices, but then it will enter a correction and this will happen in the next move that will start in the future.
So we should wait for a very good entry with a cheap and lower price.
Stay with me and boost me after introducing me to your friends.
Eth I also changed my mind about Ethereum. Let's see what happens. Does the math work out? Let's go see.

Ethereum Hits a New All-Time High? Altcoins Bull MarketEthereum just hit its highest price since December 2024. Here is the thing, first XRP moves forward and we know the rest of the market will do the same. We saw this happen with Bitcoin Cash, it just kept on moving straight up and with this we knew the rest of the market to do the same. Then we have Litecoin and now Ethereum keeps on going higher. What one does, the rest follows.
Crypto will continue to grow; the altcoins will continue to grow and because the altcoins are growing Bitcoin will also continue growing. The altcoins growing and moving forward confirms that Bitcoin's top is not in, far from this being the case. So, Ether will continue to grow, Bitcoin will continue to grow and the smaller altcoins will follow.
Watch Solana go next and Dogecoin. Litecoin will be big of course. If you buy Litecoin now below $200, you will do good when Litecoin trades at $1,000 plus. The thing is that the next advance will change everything with the ETFs. Each time there is a bear market there is a crash and flush you can always buy again at market bottoms and lows. When a Crypto gets ETFs, corrections will not be the same. Demand will be too strong and we will experience long-term growth. Something like how Bitcoin is behaving now but also on some major altcoins. There will continue to be and appear new variations across the market. The altcoins will separate into different groups and cycles. The broader market cycle will continue to evolve. Things will never stay the same. Change is the only constant.
Namaste.
