Ether: Signs of an Impending Decline?On July 21, 2025, Peter Schiff, a well-known Bitcoin critic and gold advocate, posted on X. His tweet, garnering over 1.5 million views, immediately captured the crypto community's attention:
"Ether is back near the upper end of its trading range again. If you own any, this is a great time to sell. As much as it pains me to say, selling Ether and buying Bitcoin with the proceeds is a better trade than holding Ether."
While coming from a skeptic, this statement resonates with concerns from many analysts who point to potential bearish signals for the second-largest cryptocurrency. Several factors could contribute to a further decline in Ether's price in the near future.
Technical Analysis
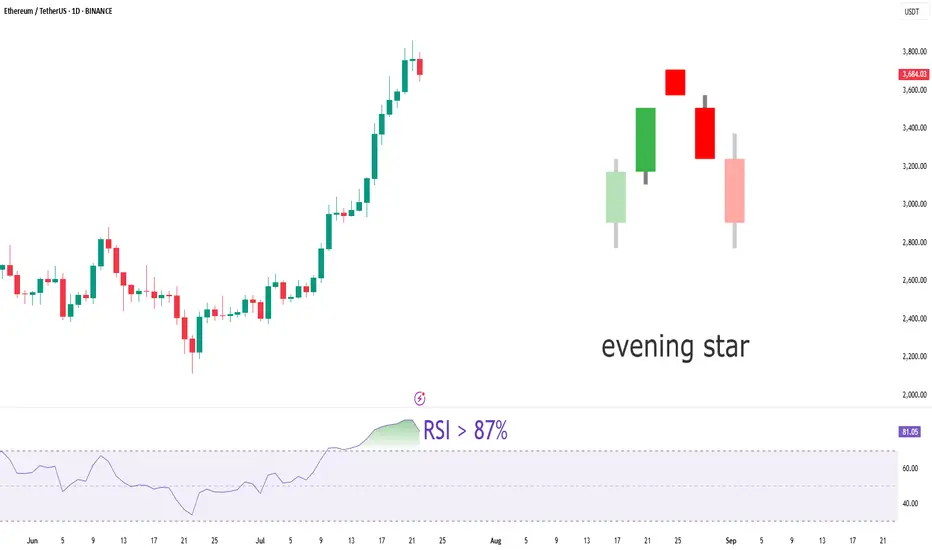
From a technical analysis perspective, the outlook for Ether also appears concerning. Yesterday, July 21, on the daily timeframe, the RSI (Relative Strength Index) surged past 87%. Such a high RSI value frequently signals an overbought asset, indicating a strong likelihood of an imminent price correction or decline. Investors who rely on technical analysis might interpret this as a clear signal to take profits.
Concurrently, on the same daily timeframe, a "Bearish Evening Star" candlestick pattern formed. This three-candle pattern is considered a powerful bearish reversal signal. An "Evening Star" typically emerges after an uptrend, pointing to a potential start of a downward movement. The combination of an extremely high RSI and a bearish candlestick pattern significantly reinforces the probability of a decline in Ether's price in the immediate future.
ETHUSDT trade ideas
ETHUSDT LongThis is not a financial advice. I don't sell signals or tips. It's just for educational purposes.


Analysis for entering Ethereum after an incomplete correctionSure! Here's the complete and fluent English translation of your text:
---
Ethereum Price Analysis and Buy Strategy for a 3–4 Month Hold (as of July 22, 2025)
When considering Ethereum (ETH) for a medium-term hold of 3 to 4 months, it's important to keep a few key points in mind. The cryptocurrency market is highly volatile, and there's no guarantee of profit. The following information is based on available analysis as of July 22, 2025, and should not be taken as financial advice. Always do your own research and consult a financial advisor if necessary before making any investment.
---
✅ Current Ethereum Price Analysis (as of July 22, 2025):
Current Price: Ethereum is currently trading in the range of $3,750 to $3,800.
Short-Term Trend: ETH has seen a significant rise in recent weeks, climbing from around $2,900 to its current price range. This growth is partly due to increased investor interest in Ethereum spot ETFs, as well as ecosystem developments like Dencun upgrades and the expansion of Layer 2 solutions.
Technical Analysis:
Moving Averages: Most short-term and long-term moving averages (e.g., MA5, MA10, MA20, MA50, MA100, MA200) are signaling a "Buy", indicating a strong bullish trend.
Relative Strength Index (RSI): Ethereum’s RSI is currently high (around 67 to 87), suggesting strong bullish momentum. However, an RSI above 70 also signals a possible overbought condition, which could lead to a short-term price correction.
Key Support & Resistance Levels:
Support: $3,400, $3,200–$3,250, and $2,900–$2,700
Resistance: The psychological barrier at $4,000 is a major resistance level. Breaking above this could open the path toward ETH’s all-time high (ATH) of around $4,878.
Short-Term Forecast (Next 3–4 Months):
Many analysts and forecasting models suggest a positive outlook for Ethereum over the coming months.
Some projections estimate ETH could reach $4,200 to $5,150 (or even higher) by late 2025.
Factors contributing to potential growth include capital inflows into spot ETFs, rising ETH staking, and continued Ethereum network development.
---
📈 Buy Strategy for a 3–4 Month Hold:
For a medium-term hold, Dollar-Cost Averaging (DCA) is a highly recommended strategy. DCA helps reduce exposure to short-term volatility and makes capital management easier both financially and psychologically.
Why DCA Works Well for 3–4 Month Holds:
Mitigates Volatility Risk: Instead of investing your entire capital at once, divide it into smaller amounts and invest at fixed intervals (weekly or biweekly). This way, you buy at both high and low prices, achieving a more balanced average entry point.
Reduces Emotional Pressure: You don’t have to worry about timing the market perfectly. With consistent buying, you reduce the stress of “buying the dip” or “selling at the top.”
Takes Advantage of Dips: If ETH experiences a dip during your holding period, you can buy at lower prices, reducing your average cost.
---
📌 How to Execute the DCA Strategy (Example for 1 ETH Investment):
Assume you want to invest the equivalent of 1 ETH (about $3,750 at current price).
1. Determine Your Total Budget: Decide how much you want to invest—only use funds you can afford to lose. In this case, $3,750.
2. Break the Holding Period into Weeks: Divide the 3–4 month period into weeks:
3 months = 12 weeks → $3,750 / 12 = $312.50 per week
4 months = 16 weeks → $3,750 / 16 = $234.37 per week
3. Set a Fixed Buy Schedule: For example, buy every Monday at 10 AM, regardless of the price at that moment.
Sample DCA Timeline (with hypothetical price movements):
Week 1: Buy $312.50 ETH at $3,750
Week 2: ETH dips to $3,600 → Buy $312.50
Week 3: ETH rises to $3,900 → Buy $312.50
Week 4: ETH falls to $3,500 → Buy $312.50
… Continue this process for the full 3–4 months.
---
🛡️ Additional Tips for a 3–4 Month Hold Strategy:
Know Your Risk Tolerance: ETH is a high-risk asset. Understand your personal risk level before investing.
Stay Informed: Even while holding, monitor ETH-related news, upgrades, and crypto market developments.
Use a Secure Wallet: Store your ETH in a secure wallet (preferably a hardware wallet) to protect against hacks or exchange risks.
Optional Partial Profit-Taking: If ETH experiences an unexpected surge (e.g., above $4,500 or $5,000), you could consider taking partial profits (e.g., sell 10–20% of your holdings) to reduce risk and lock in gains. This is optional and depends on your strategy.
Stop-Loss (if active trading): If you’re only holding passively, you likely won’t set a stop-loss. But if you plan to do active trades later, make sure to use stop-loss orders to protect capital in case of a steep price drop.
Take-Profit (TP) Planning: Even when holding, you can plan price targets. For example:
Sell 25% if ETH reaches $4,500
Sell another 25% if ETH hits $5,000
(Adjust based on your goals.)
---
🔮 Outlook for the Next 3–4 Months:
With Ethereum spot ETFs launching and generating excitement, capital inflow is likely to grow. Continued development of Layer 2 solutions, DeFi applications, and the overall ETH ecosystem may increase demand for ETH. Many analysts are optimistic about ETH’s performance in the second half of 2025, with potential to break above $4,000 and possibly approach or exceed $5,000.
---
✅ Summary:
For a 3–4 month Ethereum hold, DCA (Dollar-Cost Averaging) is the most practical and risk-managed strategy. Decide your total budget, split it into weekly or biweekly investments, and stick to the plan—regardless of daily price fluctuations. This strategy helps reduce emotional decision-making and improves your average entry price. Remember: crypto markets are risky, so never invest more than you can afford to lose.
---
Let me know if you'd like this formatted as a downloadable PDF, infographic, or a Notion-ready summary.

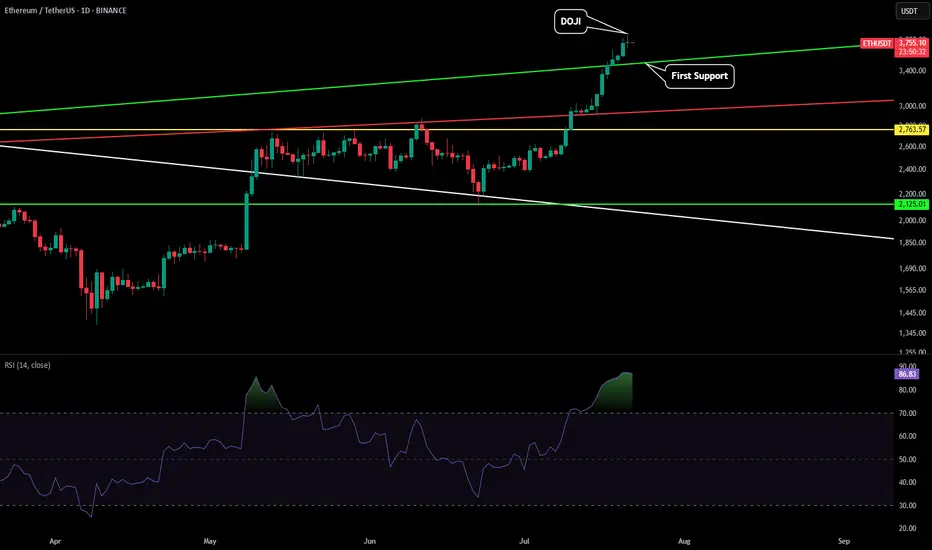
ETH - Pullback IncomingETH just printed a 1D doji reversal that could indicate a pullback should be expected. There is a lot of resistance between $3,800-$4,100 so a cooldown here would be nothing to worry about.
If we start seeing the price drop the first level of support we would want to watch is the green trendline. This could put price somewhere between $3,450-$3,530.
However if we see a wick down, or just start pumping back up creating a green daily candle following this reversal candle, that would signal this uptrend wants to climb to the $4k levels.
Be prepared for a pullback, but if we start seeing the momentum negate the reversal candle we will update this post.
Powell also speaks tomorrow so depending on what he has to say will most likely affect markets in a big way. Expect volatility.
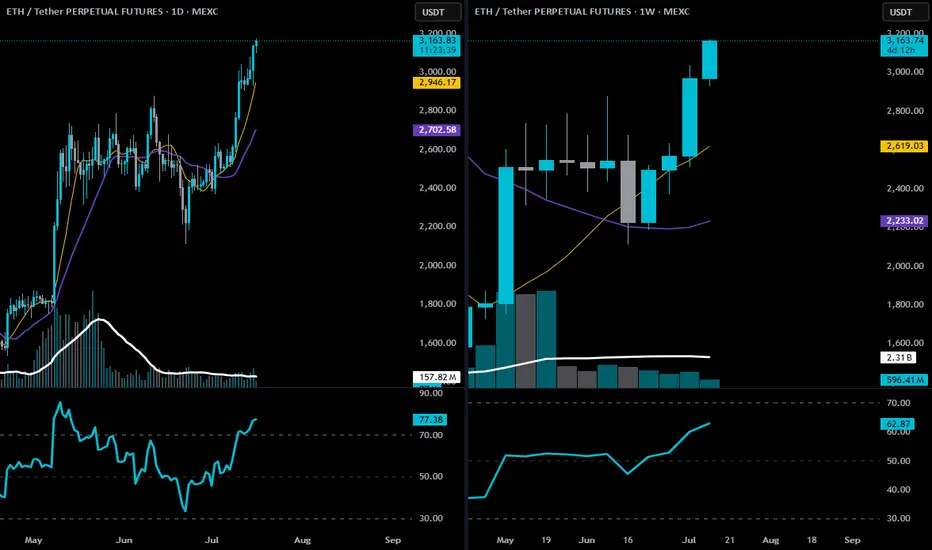
ETH-technical structure, momentum, and confirmation🕐 Daily Chart Analysis
Trend: Clear uptrend. Price is trading well above both the 9 EMA (gold) and 20 EMA (purple), with strong angle and separation.
Price Action: ETH is pressing into multi-month highs with no major resistance between here and the $3,350–$3,500 range.
Volume: Healthy increase in volume on bullish candles; recent bullish expansion looks organic, not low-volume driven.
RSI: At 77.15 — yes, overbought, but in a trending market, this is confirmation, not a sell signal. You want RSI to stay elevated during impulsive legs.
📅 Weekly Chart Analysis
Breakout Structure: This is the second full bullish candle after breaking out of a multi-month base ($2,800 range), following an accumulation period.
9 EMA Just Crossed Over 20 EMA: First time since early 2024 — bullish trend confirmation.
Volume: Large expansion bar from May shows institutional interest; current bar remains strong and building.
RSI: Pushing up to 62.75 — well below overbought, meaning there’s room to run.
🧭 Strategic Trade Plan (Swing Long)
✅ Bias: Long
Targeting $3,300–$3,500 with trailing logic to extend if momentum continues.
THIS IS NOT FINANCIAL ADVICE. Drinkin Smöökëē Whizkee. Edumacational Purpiz Only!
ETH Short Setup — Waiting for Range Formation After Parabolic Mo
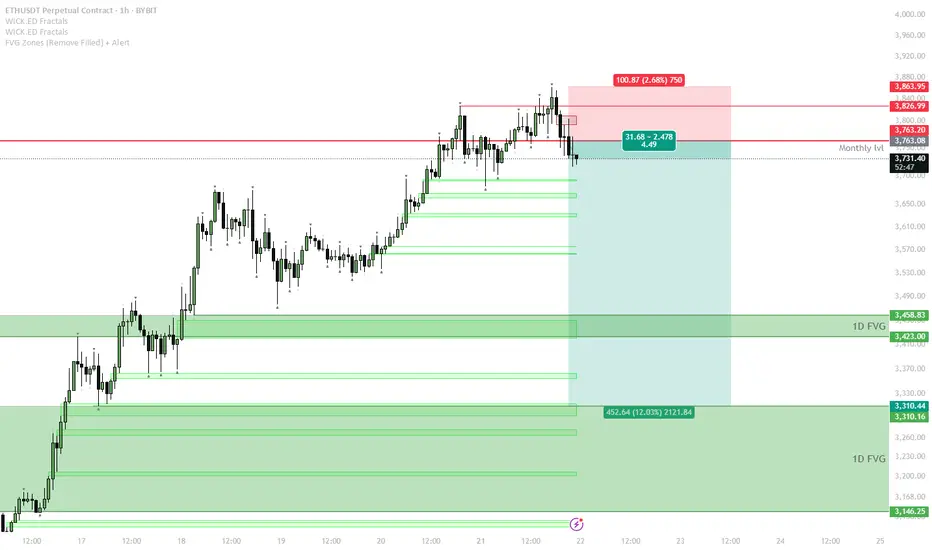
The parabolic uptrend has broken, and ETH is testing the previous monthly resistance at $3,763.
If price fails to reclaim the monthly level and continues to range below it, expect a sideways range to form between $3,760–$3,850 (red box) and local support zones.
The short trigger is a sweep of the range high (top of the red box) followed by rejection or failure to hold above $3,850.
If price confirms a failed sweep, a short position can target the 1D FVG zone around $3,460, with the next possible target at $3,310.
Invalidation: A strong reclaim and acceptance above $3,850 invalidates the short idea — switch to neutral or bullish bias in that case.
The setup follows a classic pattern after a parabolic run: momentum stalls, a range forms, and liquidity is swept at the range top before a correction. Sellers are likely to step in if price fails to establish new highs above the red zone. Downside targets align with major FVGs and previous breakout areas, providing logical levels for profit-taking.
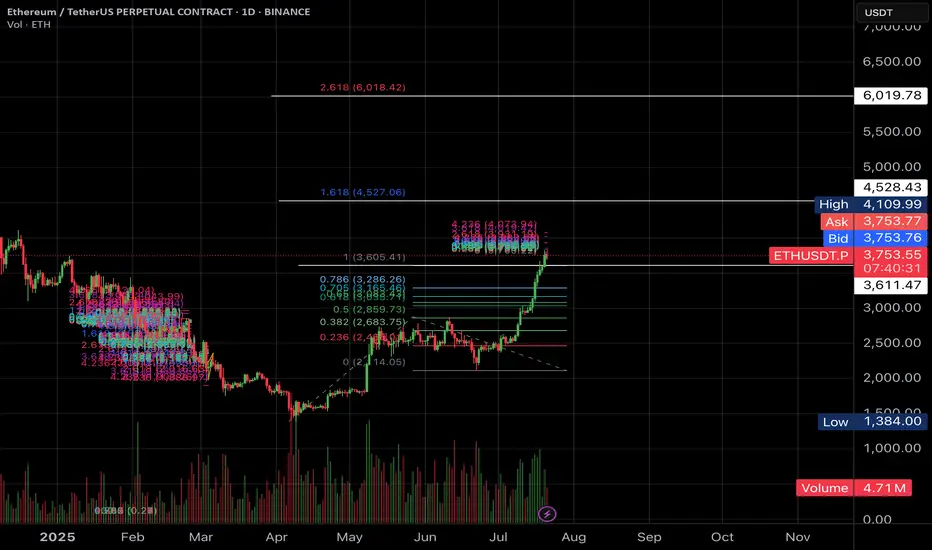
$6000 worth ETH?Hi Padawans,
ETH is showing strong bullish momentum, currently trading around $3,766. If it breaks above the resistance near $4,500–$4,900, the 2.618 Fibonacci extension points to a potential target around $6,000.
Best Regards,
CryptoObi
ETH: Huge Reversal or Correction Still in the Horizon?The recent price action in Ethereum (ETH) has left market participants questioning its next major move. With volatility high and sentiment shifting, is ETH headed for a massive reversal, or is a correction still looming on the horizon?
Key Points to Consider
Macro Environment: Global markets are facing uncertainty from shifting interest rates and regulatory developments in crypto. These factors may spark continued volatility for ETH in the near term.
Technical Analysis: ETH has many analysts watching key support and resistance areas. A clean break above resistance could signal a reversal, while a failure to hold recent gains may suggest a correction is not over yet.
On-Chain Data: Activity on the Ethereum network, including DeFi usage and staking patterns, can offer clues as to whether accumulation or distribution is taking place.
Market Sentiment: Traders remain divided, with some calling the recent bounce a bull trap, and others anticipating renewed upside momentum.
My Take
While the case for a reversal is gaining strength, the possibility of a broader correction can’t be dismissed. It’s crucial for investors to stay alert, watch the charts, and position size accordingly. I'm not longing any crypto in the short run...As for the long run, extremely BULLISH!
*not investment advice*
#Ethereum #Crypto #Investing #MarketAnalysis #Web3 #crypto #bitcoin #trading

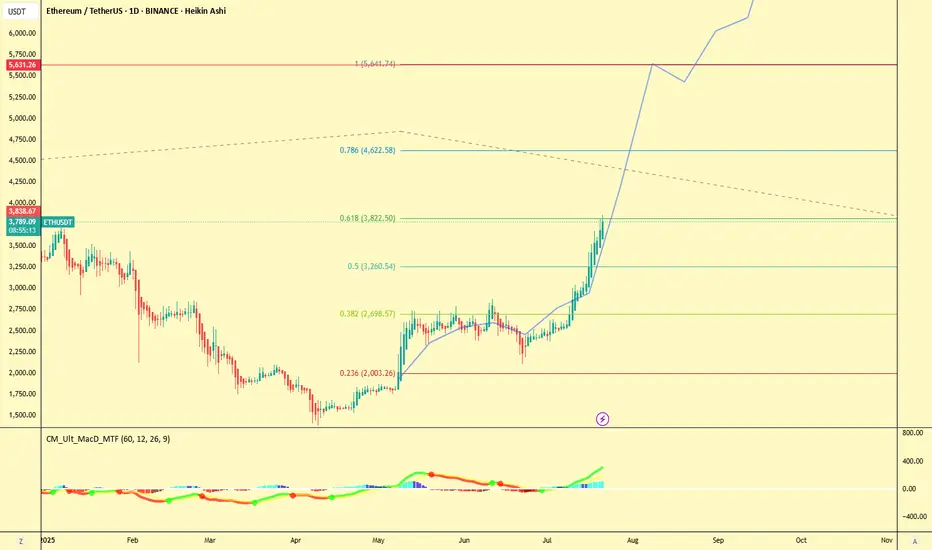
ETH not stopping at 4k > TARGET 5.6KChart displays the next cycle by combining the last cycle's path inside the fib extension tool.
Going to keep it cool and ride the whole wave up.
Good luck everyone
If this plays out, I'll share the 2 other targets.
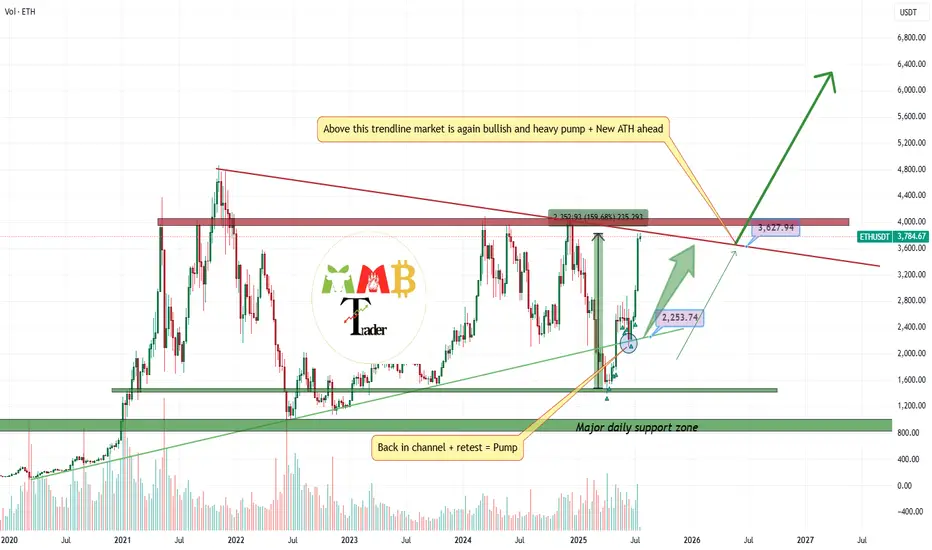
The best Buy call doesn't exists?(+160% profit on ETH)After i open long at weekly low and it almost play well until now:
\https://www.tradingview.com/chart/ETHUSDT/BrdJLvgY-ETHUSDT-near-two-major-weekly-support-and-soon-2200/
Now i am looking for range here or without that range ASAP red trendline will break to the upside and more pump and gain also is expected and this is just the beginning.
DISCLAIMER: ((trade based on your own decision))
<<press like👍 if you enjoy💚
Ethereum 6.5K Realistic taget for this cycle... HoldingFresh Ethereum Target — ETH going to break ATH and it can pump hard. However I dont think we go to 15K. It would be 1.8 Trillion Market cap. I stick to my plan which is 3.5 St. deviations. Measured by manipulaiton
🎯My system is 100% mechanical. No emotions. No trend lines. No subjective guessing. Working all timeframes. Just precision, structure, and sniper entries.
🧠 What’s CLS?
It’s the real smart money. The invisible hand behind $7T/day — banks, algos, central players.
📍Model 1:
HTF bias based on the daily and weekly candles closes,
Wait for CLS candle to be created and manipulated. Switch to correct LTF and spot CIOD. Enter and target 50% of the CLS candle.
For high probability include Dealing Ranges, Weekly Profiles and CLS Timing.
Analysis done on the Tradenation Charts
Disclosure: I am part of Trade Nation's Influencer program and receive a monthly fee for using their TradingView charts in my analysis.
Trading is like a sport. If you consistently practice you can learn it.
“Adapt what is useful. Reject whats useless and add whats is specifically yours.”
David Perk aka Dave FX Hunter
💬 Comment any Coin I ll give you my quick view

Bullish ETH Setup: $7,000, $10,000, and $13,000 TargetsHello✌
Let’s analyze Ethereum’s upcoming price potential 📈.
BINANCE:ETHUSDT , I expect a long-term upward bullish trend.
There are three main targets in this analysis: $7000, $10,000, and a final target of $13,000, which could be reached within 2 to 6 years.
The price may form parallel channels at times, which are clearly shown on the chart.
✨We put love into every post!
Your support inspires us 💛 Drop a comment we’d love to hear from you! Thanks , Mad Whale🐋
🐋Many of the points and levels shown on the chart are based on personal experience, feeling, and over 7 years of research and daily study of crypto charts.
Some of the lines, channels, and price zones are drawn to make the chart easier to understand and to help imagine possible future price movements.
I’ve also included one very big drop in price even bigger than the others because in the crypto market, it’s common for prices to suddenly fall hard and push out small investors and traders with positions.
The targets on the chart are not guaranteed; they might be reached, or they might not.📚
📜Please make sure to do your own research before investing, and review the disclaimer provided at the end of each post.

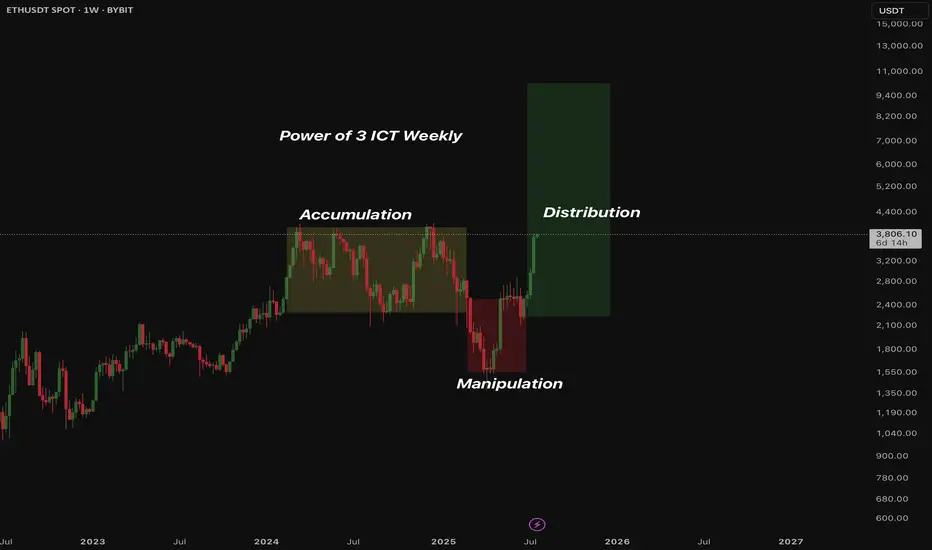
Ethereum LONG The Power of 3!
Letsgooo 10K!
On the daily we've seen a power of 3 ict played out.
Now on the Weekly chart.
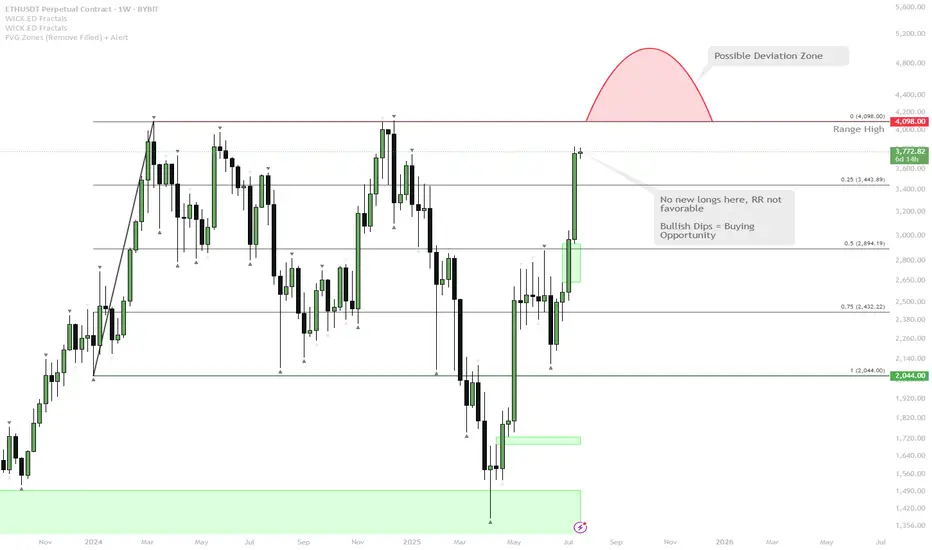
ETH Approaching Major Resistance — Watch for Range High Deviatio
ETH has rallied strongly and is now testing the range highs around $4,100.
The most likely scenario is a direct tap or wick above the range highs — this is a classic spot where the majority expects continuation, but also where deviations (fakeouts) frequently occur.
If price closes above and holds, it could trigger further upside. However, the risk/reward (RR) for fresh longs here is not attractive after such an extended move.
A deviation above range high (quick push above, then close back inside) is possible and would be a bearish signal in the short term.
After this wave, any deep dips in ETH will likely be a high-conviction buy, given the strong bullish momentum.
ETH is showing extremely bullish momentum as it approaches a major weekly resistance at the range high. The obvious play here is a sweep or break of this level, but with the move being so extended, a deviation or fakeout becomes increasingly likely. While momentum is still up, waiting for a dip or failed breakout (deviation) is a better risk/reward play than chasing longs here. Any meaningful pullback will likely present an excellent buying opportunity given the macro strength.
Ethereum (ETH): Too Good To Be True | We Are Close To $4000Ethereum is very close to the $4000 zone, which is both a psychological zone (thanks to it being a round number) and a major resistance zone for us currently.
What we see is simple: movement to that upper resistance zone where we expect to see some smaller rejection, eventually a breakout, and further movement to upper zones towards the new ATH.
Swallow Academy

ETHUSDTOn the daily time frame, Ethereum is in the last dance and is in the distribution to form its last ceiling.
BINANCE:ETHUSD BINANCE:ETHUSDT
aram pishbin

Ethereum (ETH): 2/4 Targets Reached | $4000 Incoming Ethereum has been outperforming BTC in every way; since our entry on this trade, we have had 112% movement, and soon our third target is going to be hit.
As mentioned, $4000 is our next target, where we are expecting to see some kind of strong rejection due to the round number, where usually a lot of liquidity is sitting.
So currently we are aiming for $4K and once we are there, we will be monitoring the markets to see if we will expand further or go into a smaller correction!
Swallow Academy

Ethereum to 4k$CRYPTOCAP:ETH Bulls Target for 4,000$.
#Ethereum price surge 26.40% last week and closed above the daily resistance at $3,730 on Sunday. At the time of writing on Monday, it hovers at around $3,780$.
If ETH continues its upward trend and the daily level at $3,730 holds as support, it could extend the rally toward its next key psychological level at $4,000.

ETH-----Buy around 3600, target 3660 areaTechnical analysis of ETH contract on July 18:
Today, the large-cycle daily level closed with a small positive line yesterday, the K-line pattern continued to rise, the price was above the moving average, and the attached indicator was running in a golden cross. The general trend of rising is still relatively obvious. Recently, you can see that Ethereum is stronger than the big cake, and the continuous high-breaking prices are getting closer and closer to the previous historical highs. So this month there is a chance to touch or test; the short-cycle hourly chart rose strongly in the morning and broke the previous day's high position. The current price is above the moving average, and the attached indicator is running in a golden cross. The intraday and European sessions still depend on the trend of continuing to break high.
Today's ETH short-term contract trading strategy:
Buy in the 3600 area, stop loss in the 3570 area, and target the 3660 area;

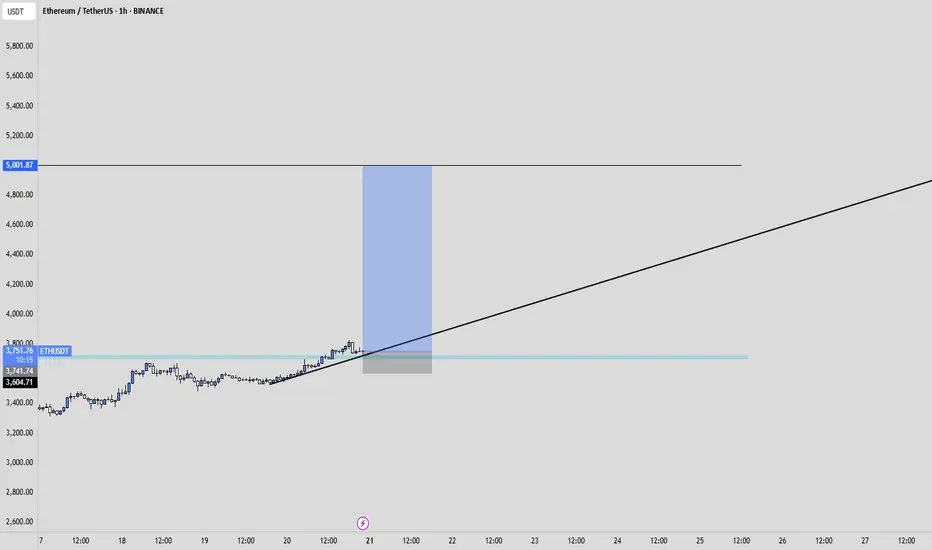
ETH Weekly Recap & Game Plan 20/07/2025📈 ETH Weekly Recap & Game Plan
🧠 Fundamentals & Sentiment
Market Context:
ETH continues its bullish momentum, driven by institutional demand and a supportive U.S. policy environment.
We captured strong profits by sticking to the plan (see chart below).
🔍 Technical Analysis
✅ Price has run into HTF liquidity at $3,750
📊 Daily RSI has entered the overbought zone, signaling potential short-term exhaustion.
We may see a brief retracement or LTF liquidity grabs, which could be enough to fuel a further push higher — potentially to $4,087.
🧭 Game Plan
I’m watching two key downside liquidity levels:
$3,534 (black line)
$3,464
A sweep of either could provide the liquidity needed for continuation toward $4,087.
⚠️ I’ll wait for LTF confirmation before entering a position.
📌 Follow for Weekly Recaps & Game Plans
If you find this analysis helpful, follow me for weekly ETH updates, smart money insights, and trade setups based on structure + liquidity.

ETH to 5000USDBINANCE:ETHUSDT
Key take away points :
-Ethereum has been uptrending for a long time already.
-We did not break previous ATH yet.
-I believe we are in the alt season, and ethereum is just getting started.
-I expect price to break previous ATH within months, and to potentially reach 5-6K USD.
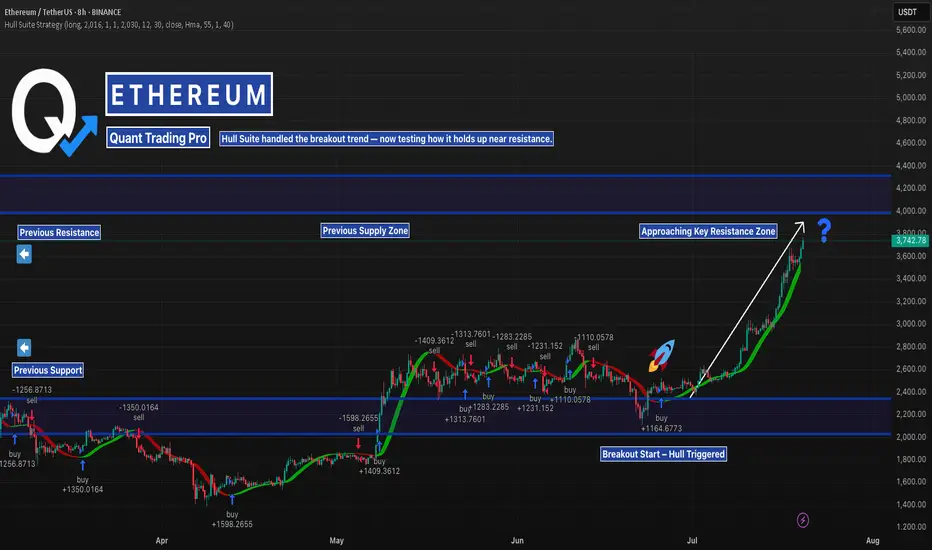
ETH in Liftoff Mode — But Resistance AheadEthereum has been trending hard — with the Hull Suite catching the breakout perfectly from the $2,200 base.
But now it’s flying straight into a key resistance zone that capped price earlier this year.
This is where many trend strategies get tested. Will Hull keep riding the wave — or will we start seeing signs of exhaustion?
📊 Watching closely how it reacts near the previous supply zone. These are the conditions where robust backtests matter most.
—
#ETHUSD #Ethereum #TrendAnalysis #HullSuite #BreakoutTrading #ResistanceZone #QuantTradingPro #TradingView #CryptoAnalysis