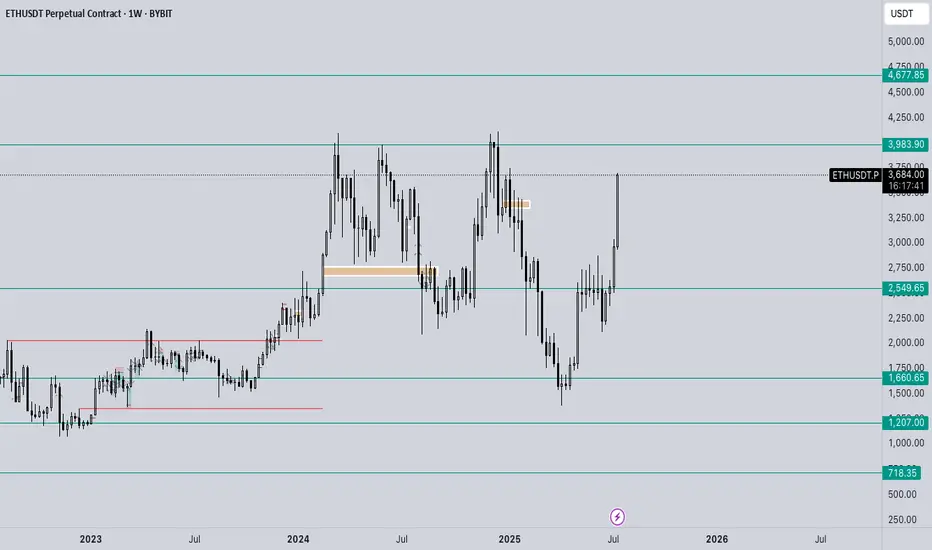
Weekly ETH candle sitting on 3 lines of resistance.This weekly ETH God candle is fighting with 3 lines of resistance. The white is the 25% discount zone calculated from Ethereums lowest to the highest point. Ethereum is right now roughly 25% below it's ATH. Plus two FIB retracement lines. There are 12 more hours till the end of this week, and unless we see a candle close above the 25% resistance line and a new one open, we may see some retracement. It would also be warranted to see some profit taking on the recent hype over the weekend, particularly with talks of Wall Street making announcements of plans to palce massive ETHEREUM buy orders. I expect some downtime towards the start of the week followed by the continuation of the pump possibly Tuesday or Wednesday.
ETHUSDT trade ideas

ETHUSDT - Limited Return PriceEthereum is a reliable network for financial transfers and transactions and can be considered the second most popular digital currency after Bitcoin. Currently, this currency has reached the price range of $2,500 with temporary decreases, but this price is at its lowest level and the probability of liquidity entering this price area is very high. This price level can be used for long-term investment. I specify two targets for this price area: $4,000-5,000.
Sasha Charkhchian

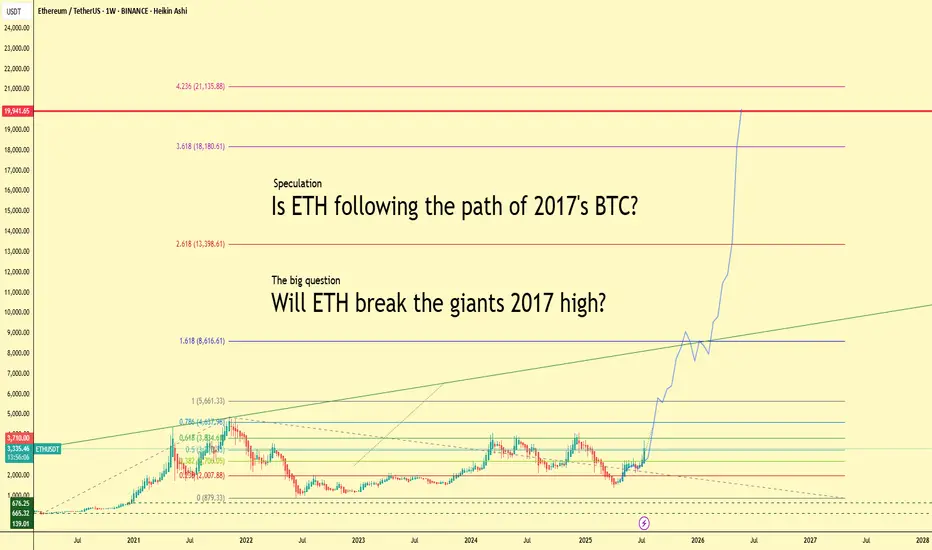
Will ETH Follow BTC’s 2017 Path? $20K in Sight?Ethereum is heating up — up more than 20% this week and currently trading above $3,300. But what if we told you this might just be the beginning?
This chart explores a bold yet exciting speculation:
👉 Is ETH repeating Bitcoin’s legendary 2017 run?
Back then, BTC went from obscurity to global headlines, smashing through $1k, then $5k, then $10k… and eventually peaking just below $20,000. Ethereum might just be lining up for a similar parabolic path.
🚀 Fibonacci Levels Say: Sky’s the Limit
The chart projects Fibonacci extensions up to:
1.618 = $8,600
2.618 = $13,400
3.618 = $18,180
4.236 = $21,135
Notice the key level: $19,941. That’s the legendary BTC high of 2017. Will ETH match or even surpass that milestone?
🧠 The Big Question:
Can ETH become the new “giant”?
While Bitcoin still leads the narrative, Ethereum’s ecosystem, real-world adoption, and institutional attention have never been stronger.
💬 Let’s Talk
Do you believe Ethereum is set to break $20K this cycle? Or is this just hopium and lines? Share your thoughts and let's compare notes.
#Ethereum #ETHUSDT #Crypto #Altseason #BTC2017 #Fibonacci #Bullrun #ETHBreakout #Parabola #CryptoSpeculation
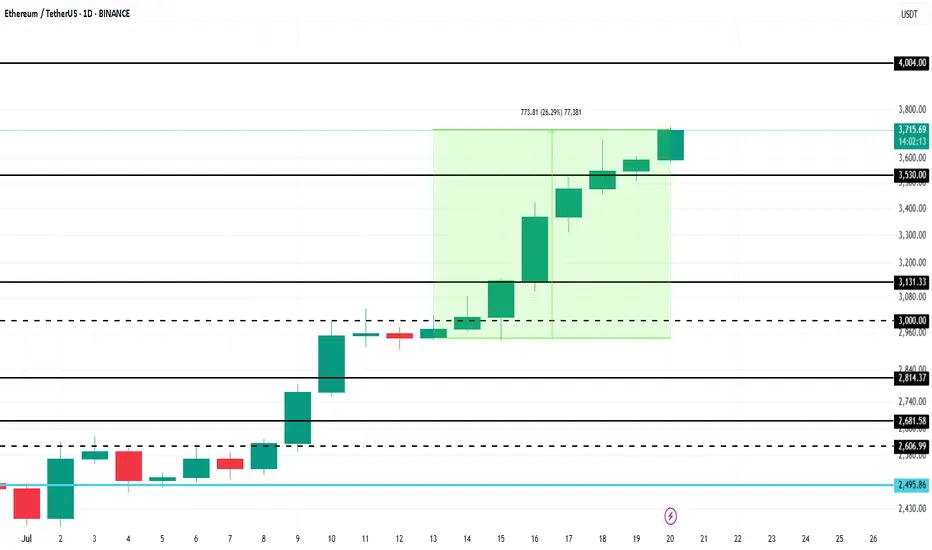
Ethereum Price Hits 6-Month High, Up Next $4,000BINANCE:ETHUSDT has managed to navigate recent market volatility with significant support from investors. As companies increasingly mirror Bitcoin’s corporate treasury use case, Ethereum is gaining traction.
BINANCE:ETHUSDT price surged 26% over the past week , reaching $3,715 and marking a 6-month high. The rally strengthened after ETH formed a Golden Cross last week. With this bullish momentum, Ethereum is now targeting $4,000 in the coming days, benefiting from investor confidence and growing institutional interest.
However, if BINANCE:ETHUSDT bullish momentum weakens and investors opt to sell, the price could decline to $3,131 . This would erase recent gains and invalidate the current bullish outlook.
ETHUSDT | Two Opportunities. One Smart Approach.I’ve been closely watching how buyers behave under the green line — and they’re clearly not backing down. But what really catches my eye is the blue box , a clean demand zone I’ve seen act as a launchpad in the past.
You don’t need to jump in blindly.
Depending on your risk appetite, both levels are valid. But if you wait for a 15-minute breakout confirmation on the low timeframe before acting on either, your odds of success increase significantly.
This is how I keep my win rate high, waiting for the market to prove itself first.
“I will not insist on my short idea. If the levels suddenly break upwards and do not give a downward break in the low time frame, I will not evaluate it. If they break upwards with volume and give a retest, I will look long.”
Most traders rush in. You wait smart. That’s the edge.
Choose wisely. Follow closely.
📌I keep my charts clean and simple because I believe clarity leads to better decisions.
📌My approach is built on years of experience and a solid track record. I don’t claim to know it all but I’m confident in my ability to spot high-probability setups.
📌If you would like to learn how to use the heatmap, cumulative volume delta and volume footprint techniques that I use below to determine very accurate demand regions, you can send me a private message. I help anyone who wants it completely free of charge.
🔑I have a long list of my proven technique below:
🎯 ZENUSDT.P: Patience & Profitability | %230 Reaction from the Sniper Entry
🐶 DOGEUSDT.P: Next Move
🎨 RENDERUSDT.P: Opportunity of the Month
💎 ETHUSDT.P: Where to Retrace
🟢 BNBUSDT.P: Potential Surge
📊 BTC Dominance: Reaction Zone
🌊 WAVESUSDT.P: Demand Zone Potential
🟣 UNIUSDT.P: Long-Term Trade
🔵 XRPUSDT.P: Entry Zones
🔗 LINKUSDT.P: Follow The River
📈 BTCUSDT.P: Two Key Demand Zones
🟩 POLUSDT: Bullish Momentum
🌟 PENDLEUSDT.P: Where Opportunity Meets Precision
🔥 BTCUSDT.P: Liquidation of Highly Leveraged Longs
🌊 SOLUSDT.P: SOL's Dip - Your Opportunity
🐸 1000PEPEUSDT.P: Prime Bounce Zone Unlocked
🚀 ETHUSDT.P: Set to Explode - Don't Miss This Game Changer
🤖 IQUSDT: Smart Plan
⚡️ PONDUSDT: A Trade Not Taken Is Better Than a Losing One
💼 STMXUSDT: 2 Buying Areas
🐢 TURBOUSDT: Buy Zones and Buyer Presence
🌍 ICPUSDT.P: Massive Upside Potential | Check the Trade Update For Seeing Results
🟠 IDEXUSDT: Spot Buy Area | %26 Profit if You Trade with MSB
📌 USUALUSDT: Buyers Are Active + %70 Profit in Total
🌟 FORTHUSDT: Sniper Entry +%26 Reaction
🐳 QKCUSDT: Sniper Entry +%57 Reaction
📊 BTC.D: Retest of Key Area Highly Likely
📊 XNOUSDT %80 Reaction with a Simple Blue Box!
📊 BELUSDT Amazing %120 Reaction!
📊 Simple Red Box, Extraordinary Results
I stopped adding to the list because it's kinda tiring to add 5-10 charts in every move but you can check my profile and see that it goes on..

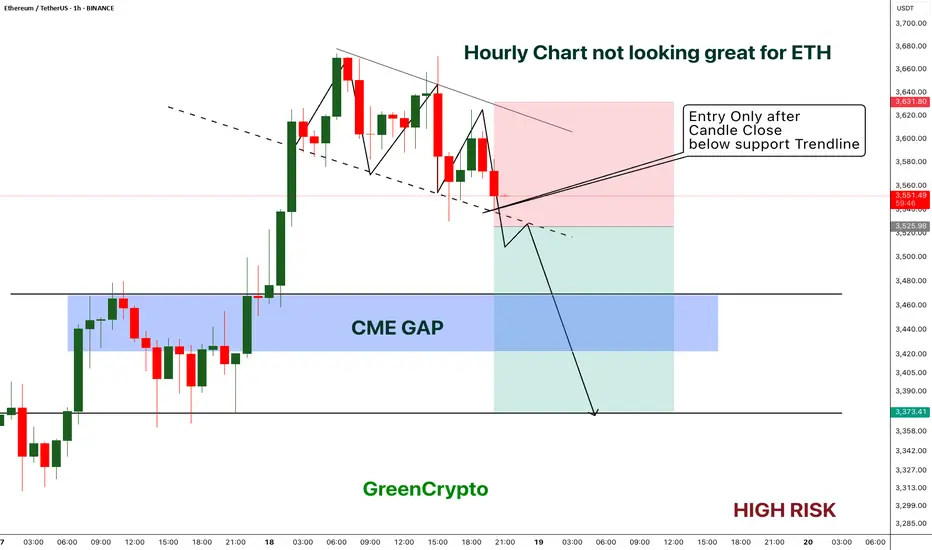
ETH - Short Trade with HIGH RISK- ETH got reject from resistance multiple times on 1H timeframe and now the price is playing near the support.
- I'm expecting overall market to cooldown this weekend, this could push the ETH to break the support
- ETH has CME gap around 3422 - 3467 range, im expecting this CME gap to be filled soon.
Entry Price: Below 3525
Stop Loss: 3631
TP1: 3471.15
TP2: 3381.76
Move SL to breakeven on TP1 hit.
Don't forget to keep stoploss.
Cheers
GreenCrypto
ETH - Ranges overview (update) We've had some nice movements on ETH lately so let's have a look at where we are.
As previously discussed IF we reclaimed 2.5K we should expect the market to aggressively trade towards the HTF buyside (3.4K and 4K).
The buyside at 3.4K has been traded through already so no let's be PATIENT and see IF we get through 4K and higher.
As always WAIT FOR THE MARKET TO SHOW YOU ITS HAND.
Stay safe and never risk more than 1-5% of your capital per trade. The following analysis is merely a price action based analysis and does not constitute financial advice in any form.
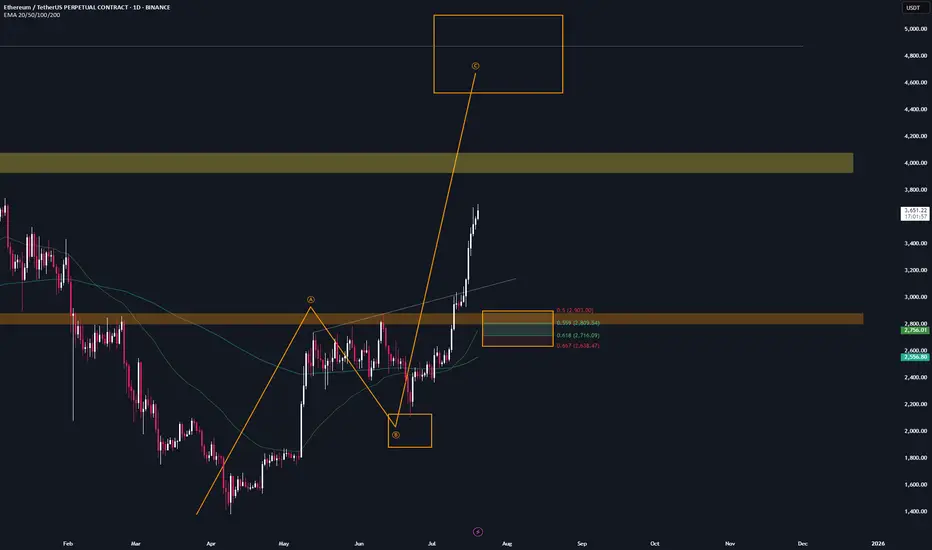
ETH | Trade setup📌 After the breakout from the last high at $2.9k, a bullish sequence (orange) has now been activated.
📊 These setups typically occur no more than twice per year on any given altcoin, so I’ll be aggressively buying each level at the B-C retracement area.
Trademanagement:
- I'm placing long orders at each level and SL right before the next level. (If the price continues climbing, I’ll adjust the trend reversal level (orange) accordingly and update my limit orders.)
- Once the trade reaches a 2 R/R, I’ll move the stop-loss to break-even.
- From a 3 R/R onward, I’ll start locking in profits.
✅ I welcome every correction from here on —
but I won’t enter any new positions at these top levels.
ETH/USDT 30m Signal📉 ETH/USDT 30m Signal
Pair: ETH/USDT
Timeframe: 30-minute
Trade: SELL
📍
📊 Level
Pips
R:R
💵 Entry
3,610 USDT
🚫 Stop-Loss
3,650 USDT
🎯 Target 1
3,570 USDT
1:1
🎯 Target 2
3,530 USDT
2:1
🎯 Target 3
3,490 USDT
3:1

Ethereum to $12,000The chart, spanning from mid-2021 to projected levels into 2027, showcases Ethereum's price in a classic ascending channel, characterized by higher highs and higher lows. This is indicative of sustained buyer control and a maturing bull cycle.
Price Action and Key Levels: Ethereum bottomed out near $880 in June 2022 (close to the S2 support level around $900), forming a strong base. Since then, it has rallied through multiple resistance zones, with the most recent breakout above the R1 level at approximately $3,471. This breakout, confirmed by a close above the line on higher volume, flips R1 into new support and opens the door for further gains. The pivot point (P) sits around $2,800, providing a safety net, while lower supports at S1 (~$2,400) and S2 (~$1,200) have held firm during previous pullbacks. On the upside, the next targets include R2 (~$4,700), R3 (~$6,000), R4 (~$8,500), and R5 (~$11,000). Extending this using Fibonacci projections from the 2022 low to the 2024 high (a common tool for measuring bull runs in crypto), we arrive at a target of $12,000, which aligns with the upper channel boundary and historical cycle multiples.
Volume Confirmation: The bottom panel shows volume bars spiking during uptrends, particularly in the recent push above R1. This indicates accumulation by institutional investors and retail buyers alike, with declining volume on pullbacks suggesting limited selling pressure. Increasing volume on breakouts is a hallmark of sustainable rallies, reducing the risk of a false move.
Momentum Indicators: The blue line in the sub-chart appears to be the Relative Strength Index (RSI), currently hovering above 50 and trending upward without entering overbought territory (above 70). This signals building bullish momentum with room to run. Additionally, the lack of divergence between price and RSI further supports the strength of the current uptrend. If we see the RSI push toward 60-70, it could coincide with acceleration toward higher resistance levels.
Overall, the chart reflects a multi-year consolidation phase transitioning into expansion, similar to the 2020-2021 bull run. A measured move from the recent range (from ~$2,200 low to ~$4,000 high) projects an upside of roughly 3x, landing near our $12,000 target.
Fundamental Catalysts
Ethereum's technical strength is bolstered by robust fundamentals, making the bullish case even more compelling:
Network Upgrades and Adoption: Recent upgrades like Dencun (2024) have drastically reduced layer-2 fees and improved scalability, driving real-world usage in DeFi, NFTs, and gaming. Ethereum's dominance in smart contracts remains unchallenged, with total value locked (TVL) surpassing $60 billion and continuing to grow.
Institutional Inflows: The approval of spot Ethereum ETFs in 2024 has opened the floodgates for traditional finance, with billions in inflows expected to continue. Major players like BlackRock and Fidelity are ramping up exposure, providing a steady bid under the price.
Macro Environment and Crypto Cycle: With Bitcoin's post-halving rally typically leading altcoins like Ethereum, we're in the midst of a favorable cycle. Easing global interest rates and a weakening USD (as seen in recent Fed signals) further support risk assets like crypto. Ethereum's deflationary mechanics via EIP-1559 (burning fees) create scarcity, enhancing its store-of-value narrative.
Risk Considerations and Entry Strategy
While the outlook is bullish, no analysis is complete without risks. A broader market downturn (e.g., due to regulatory hurdles or economic recession) could push ETH back toward S1 at $2,400, invalidating the short-term breakout. However, the chart's structure suggests strong support there, making dips buyable opportunities.
For entry, consider positions on a pullback to the new support at $3,471 (former R1), with a stop-loss below $3,000 to manage risk. Position sizing should account for volatility—aim for 1-2% risk per trade.
In summary, Ethereum's chart screams bullish continuation, with technical breakouts, rising volume, and positive momentum aligning for a push to new all-time highs. Targeting $12,000 represents a realistic extension of the current trend, potentially delivering 3x returns from current levels around $3,500. This isn't just speculation; it's a confluence of data-driven signals in one of the most innovative assets in the market. Stay long, stay vigilant.


ETH - Realistic target $13799.6Taking this trade as its normally the first one to run in Alt Season, and although there is higher beta trades, this being a large cap should have smaller pullbacks.
Entry - 2879
Stop - 2111.6
Interval 1 - 3190
Interval 2 - 7405
Target - 13799.6

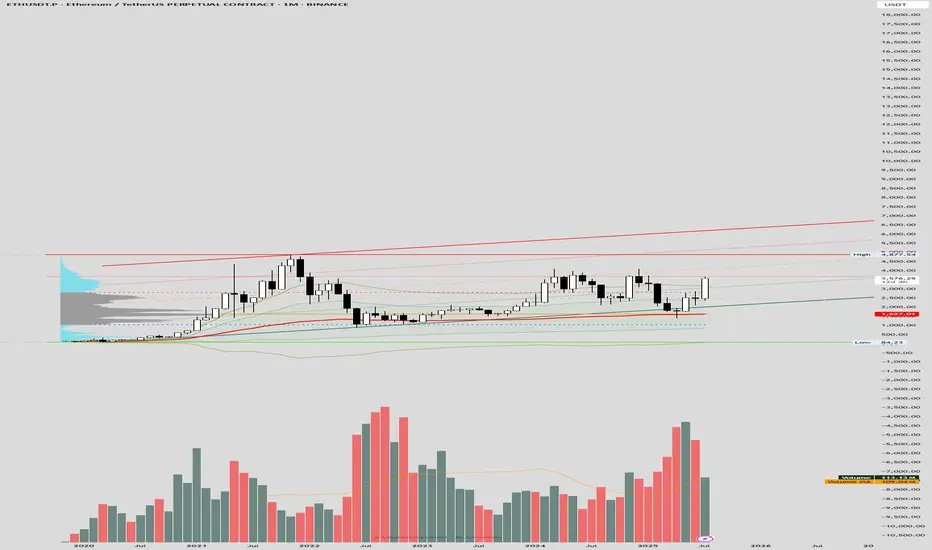
ETH Monthly Chart (AVWAP)The chart highlights a bullish structure with the AVWAP providing key dynamic support and resistance levels. The price has recently approached the upper AVWAP deviation around $4,977.54, aligning with the prior bull flag scenario's resistance zone. The red trendline indicates a potential upper boundary, while the green and orange lines suggest intermediate supports and resistances, with the current price near $3,579.48 testing the middle range. The lower AVWAP deviation near $842.23 serves as a critical invalidation level. Volume remains supportive, with spikes corresponding to price movements, and the volume moving average (109.4k) indicates steady activity.
Real-time data shows ETH trading at $3,565-$3,600, consistent with the chart's mid-range levels, driven by ETF inflows and on-chain activity. A breakout above $3,700-$4,000 with increased volume could target $3,834-$4,000 or higher, while support at $2,533-$2,700 remains vital. Sentiment on X and web sources is optimistic, though volatility persists due to external factors.
ETH Monthly ViewThe monthly chart suggests a potential bull flag pattern, with a strong upward trend followed by consolidation. The "Vector Candle Gap" indicates a breakout zone around $4,977.64, with recent price action testing resistance near $3,700-$4,000. Volume trends support the bullish case, showing increased activity during the initial rise and consolidation. The moving average reinforces an upward trajectory, but a downward-sloping trendline and support at $933.19-$2,800 suggest invalidation risks if the price drops below these levels.
Real-time data shows ETH trading at $3,565-$3,600, bolstered by institutional inflows into spot ETH ETFs and on-chain activity. The bull flag aligns with a potential target of $3,834-$4,000 if the breakout sustains with strong volume. Key support lies at $2,533-$2,700, with sentiment on X and web sources remaining optimistic, though volatility persists due to macroeconomic and regulatory factors.

ETH Healthy Retest Before Next Rally!Ethereum continues to trade within a strong uptrend on the 1-hour chart, respecting the 100 EMA consistently throughout the rally. After a strong impulse move, the price is now consolidating near the recent highs.
ETH price could retest the 0.382 Fibonacci level and the 100 EMA before continuing upward. A successful retest would signal strength and could lead to a bullish continuation toward the $3900 - $4000 range.
Similar historical retests of the 100 EMA led to strong rallies, and we could see a repeat of that pattern if support holds.
Cheers
Hexa
BITSTAMP:ETHUSD CRYPTOCAP:ETH

Is Ethereum Ready to Break Out? Watch This Key Trendline!Is Ethereum Ready to Break Out? Watch This Key Trendline!
In the 15-minute timeframe, Ethereum (ETHUSDT) is testing a major descending trendline. If a strong bullish candle closes above this level and price action holds, we could see a move toward the $3,637 resistance zone.
This area has acted as a significant technical level in the past, and a confirmed breakout may trigger further upside momentum.
🚀 A successful breakout could provide a solid long entry setup, with $3,637 as the first target. Keep a close eye on this move—momentum is building.
💡 Don’t miss more high-probability setups like this! Follow for real-time crypto analysis and trade ideas.

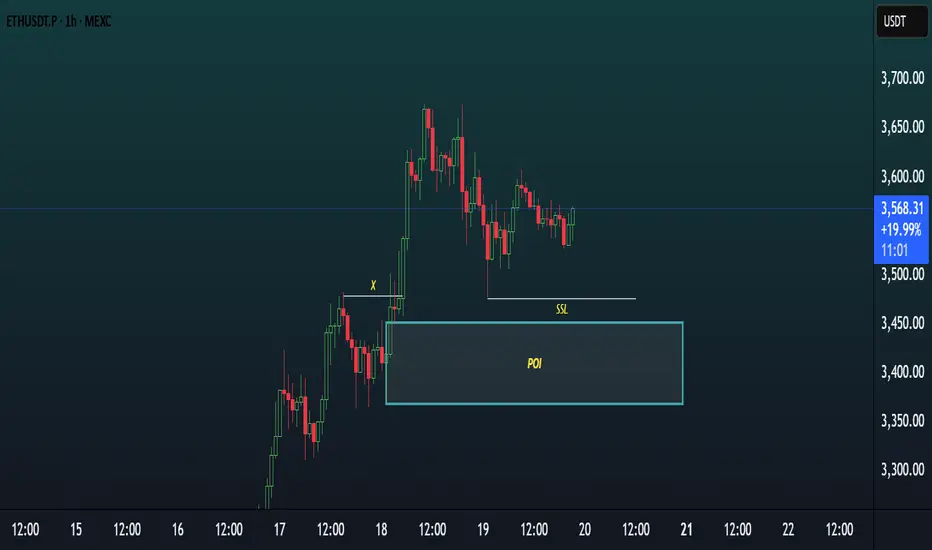
Chart Analysis (ETHUSDT, 1H)This chart showcases a Smart Money Concepts (SMC) style analysis on the 1-hour timeframe of ETHUSDT.P, focusing on a potential bullish setup.
Key Elements:
POI (Point of Interest)
A demand zone is clearly marked around the $3,400–$3,460 area, highlighted as a potential reversal zone where price may react bullishly.
SSL (Sell-Side Liquidity)
Sell-side liquidity has been swept below a recent low, indicating a possible liquidity grab before a reversal.
X (Previous Break of Structure)
Point “X” marks a significant BOS (Break of Structure) indicating bullish intent in prior price action.
Current Price Action
Price recently tapped into the POI, swept SSL, and is now consolidating slightly above the zone — suggesting accumulation or preparation for a bullish move.
Bias:
Bullish — Expecting a possible reversal or continuation to the upside after liquidity sweep and POI mitigation.
ATH FOR Ethereum!!!Hello friends🙌
As you know, Ethereum has been on an upward trend these days and we can say that buyers have entered, but not completely...👀
🔊Now, considering the resistance that Ethereum is facing, namely the number 3900 to 4100, we need to see what reaction the price will see this time when the price reaches this resistance for the 4th time?
✔We will most likely make a small correction and this time this major resistance will be broken again and we will witness a higher ceiling.
✔Otherwise, I have an important and key support that we have identified for you and if the price drops, this support is a good area to buy again.
And finally, observe risk and capital management⚠
🔥Follow us for more signals🔥
*Trade safely with us*

#ETH look for the false breakoutany false break out to the area of
2400-2500
will be a good buy sign with stop below 3200 and target 4300
trade safe and follow me 😉

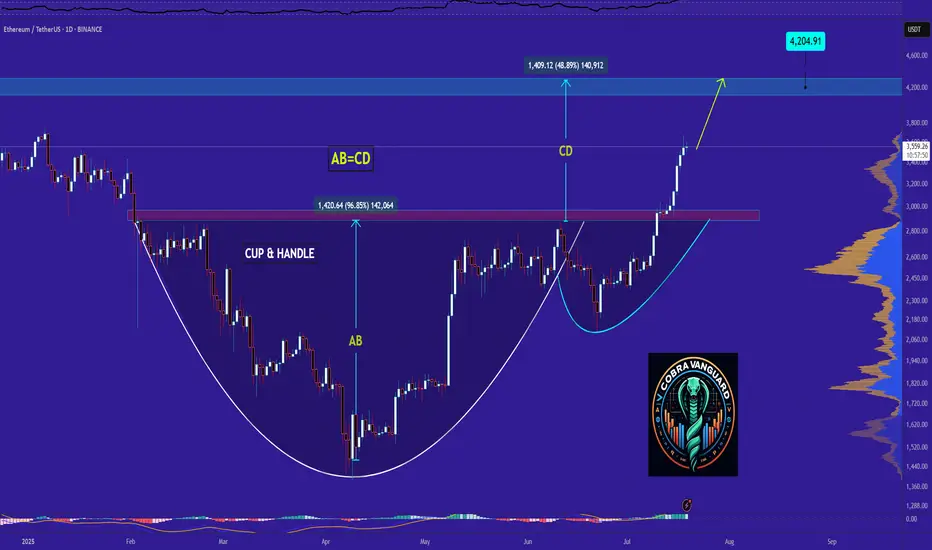
Ethereum - Time to buy again!Exactly, based on previous analyses, the price is rapidly approaching $4,000. But we need to be cautious because whenever it hits round numbers, something big usually happens!!!
previous analysis
Best regards CobraVanguard.💚
ETHUSDTThis movement downtrend. If breake 2.790 movr to 3.500$ but breke 2.200 move trend to 1.500$.

ETH | USDWe should monitor the megaphone formation. There's a strong possibility of a move to the targets identified by the breakout. Below, the green line and the megaphone's lower band I identified are excellent entry levels.

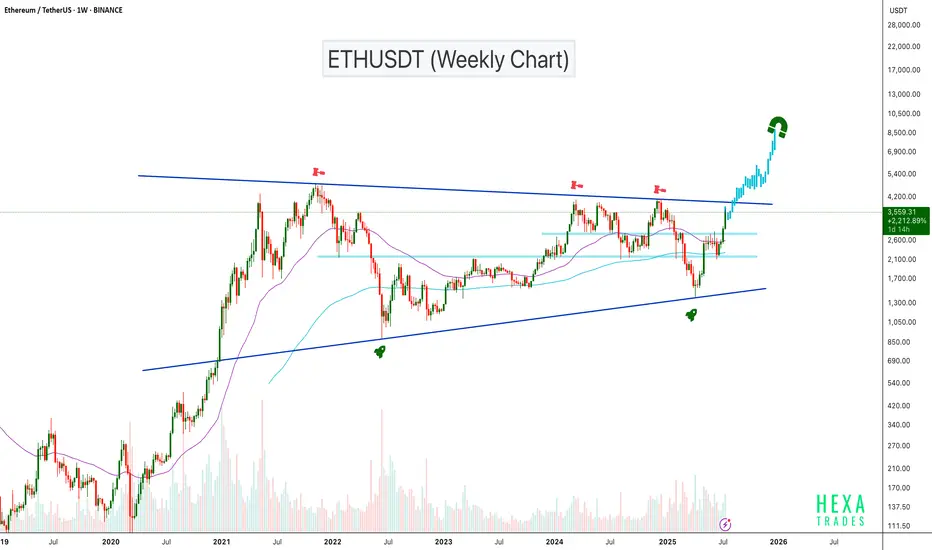
ETHUSDT Gearing Up for Explosive MoveBINANCE:ETHUSDT has been trading inside an ascending triangle pattern for the past 1,600 days. The price is now moving toward the triangle's resistance zone with strong volume support. A confirmed breakout above this resistance could trigger a powerful bullish move, with potential targets in the $6,000–$8,000 range.
Cheers
Hexa🧘♀️
BITSTAMP:ETHUSD