NEoWave Analysis of Ethereum 2025 Cash data chart shows that Ethereum is in a corrective phase and the wave structure from (A) to (C) has been completed. Initially, we expected a flat pattern to form; however, the wave structure-(C) was not an impulse and the flat was not confirmed.
As a result, given that the wave structure (A)-(B)-(C) is corrective and the waves differ in time, it seems that a contracting triangle pattern is forming and we are currently in wave-(D) of this triangle. Furthermore, wave-(D) could rise to $3630-3880 and end. Then a price correction in the form of wave-(E) may occur. This correction could end between $2900-3086 and if this range is broken downwards, wave-(E) could decline to $2000-2230, after which the main bullish move for Ethereum is expected to begin.
Good luck
NEoWaveChart
ETHUSDT trade ideas

Ethereum Weekly UpdateAs anticipated, Ethereum has achieved all weekly targets, perfectly following our bullish (green) scenario. Price currently tests a key resistance zone after:
Holding critical monthly support at $2,966
Rallying to our projected upside targets
Technical Observations:
Bearish Divergence (4H RSI)
Trend Weakness (H1 & H4 ADX decline)
Seller Reaction at resistance, yet holding above $3,300
Key Levels:
Break above resistance → Continuation likely
Break below $3,300 → Pullback toward $3,000-3,100 expected
Conclusion:
While the trend remains intact, weakening momentum signals potential short-term correction. Trade plan aligns with Monday’s video analysis.
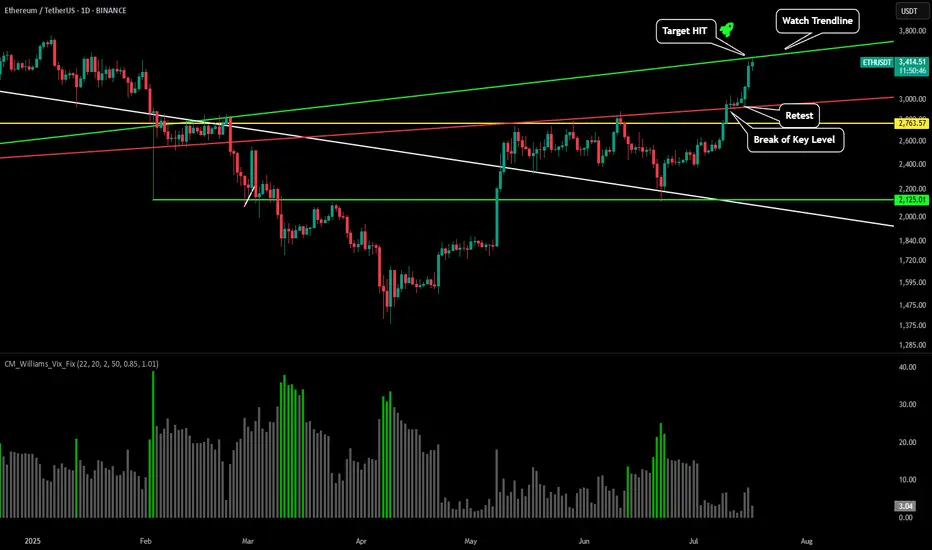
ETH - Charts Don't LiePlease refer to our previous post:
As stated here after breaking our red key trendline our prediction was price would move up swiftly to test the green trendline between between $3,400-$3,500.
After a successful retest of the red trendline it only took price 48 hours to increase 19% and reach our green trendline. This is a major area where we could see some profit taking starting to occur.
Once price is able to break through this level we should see a move to the most important price zone throughout the past couple years around $4k-$4,100.
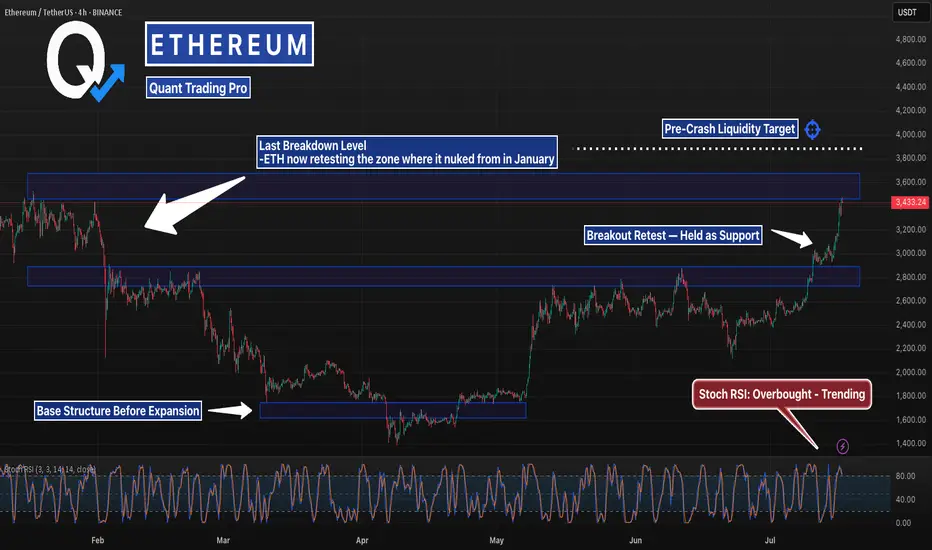
This Level Crashed ETH Last Time… It’s BackETH just blasted back into the same zone it collapsed from in January — but this time the structure underneath is stronger, tighter, and holding.
Stoch RSI is stretched, but bullish momentum remains intact. If it clears $3,870, lights out.
#Ethereum #ETHUSD #CryptoCharts #BreakoutLevels #ChartAnalysis #TradingView #QuantTradingPro #CryptoTraders #BacktestEverything
ETHUSDT UPDATELooking at the ETH daily chart, we see a flag formation. If it breaks, it could take us to 3500.

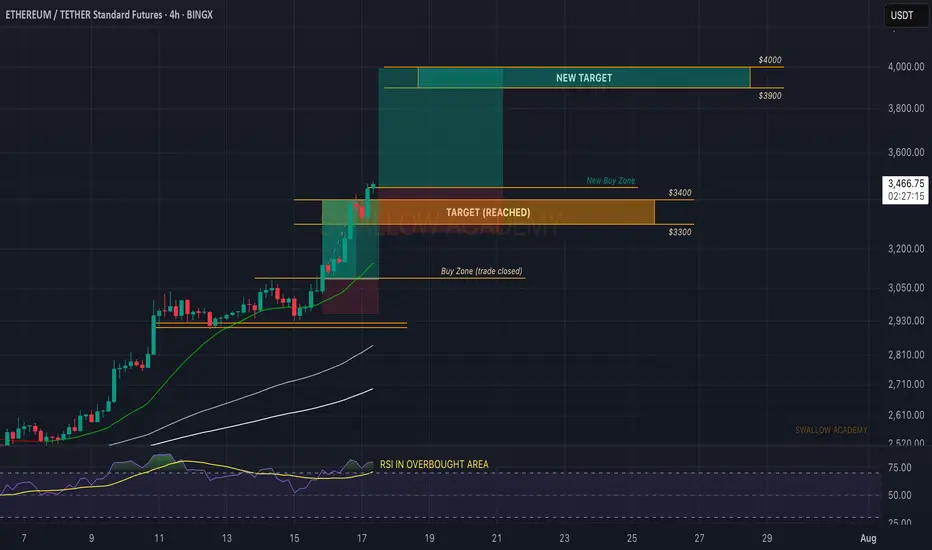
Ethereum (ETH): Yesterdays Target Reached | Now Looking at $4000Ethereum is on fire, where our yesterday's target was reached without any hesitation.
Now we shared a TA this week on a weekly timeframe where we showed that one of our major targets is $4000. So we are aiming to see that one to be reached now; momentum is good so we might as well fill it quite quickly.
Swallow Academy
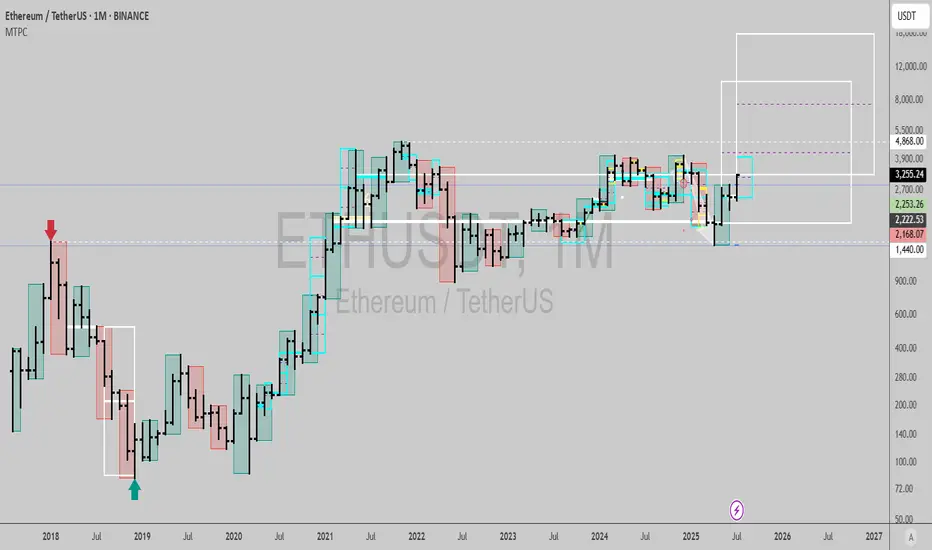
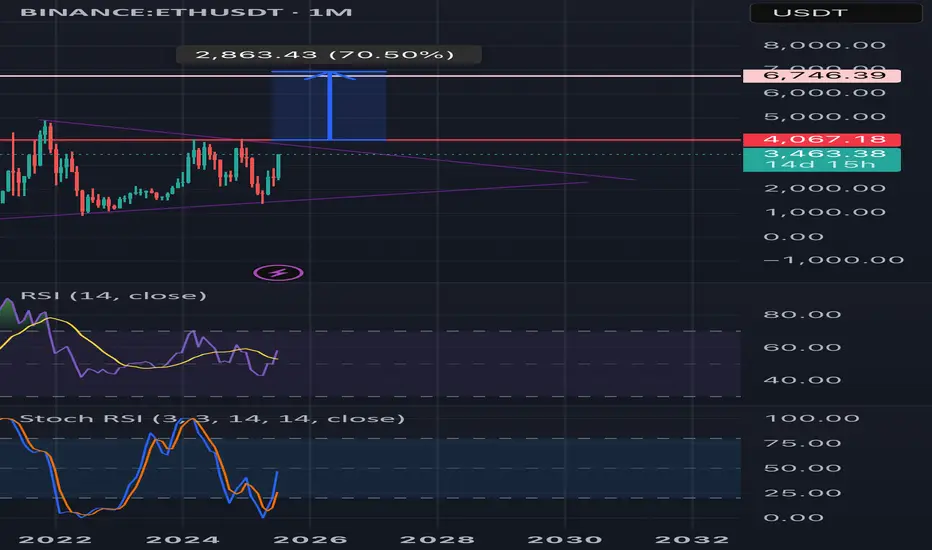
Upward breakout for ETH monthly?🟣 Ethereum Monthly Timeframe Analysis – Large Symmetrical Triangle
📌 Current Situation:
• On the monthly chart (1M), Ethereum (ETH) has formed a large symmetrical triangle pattern.
• This pattern typically signals a major price consolidation before a significant move.
• The descending resistance line connects the 2021 all-time high to recent lower highs.
• The ascending support line is drawn from the 2018 low through the 2022 bottom.
• Price is nearing the apex of the triangle, indicating a breakout is likely soon.
⸻
🔼 Bullish Scenario (Breakout to the Upside):
If ETH breaks above the triangle resistance and confirms the move:
✅ Signs of a Bullish Continuation:
• Strong breakout above the $4,000–$4,500 zone
• Increased volume confirming breakout
• Price holds above resistance-turned-support
🎯 Potential Price Targets by 2027 (based on triangle height & Fibonacci projections):
1. Target 1: $6,800 – $7,500
2. Target 2: $9,000 – $10,000
3. Long-term Target: $12,000 – $15,000 (if macro bull market continues)
⸻
🔽 Bearish Scenario (Fakeout or Breakdown):
If the breakout fails or price breaks down:
• ETH could revisit lower supports around $2,000 or even $1,400
• Bullish momentum delayed until another strong base forms
⸻
🔍 Conclusion:
• This triangle could mark the beginning of a major rally into 2027, especially if supported by fundamentals (e.g., ETF approval, DeFi growth).
• Wait for a confirmed breakout with volume and retest before entering a long-term position.
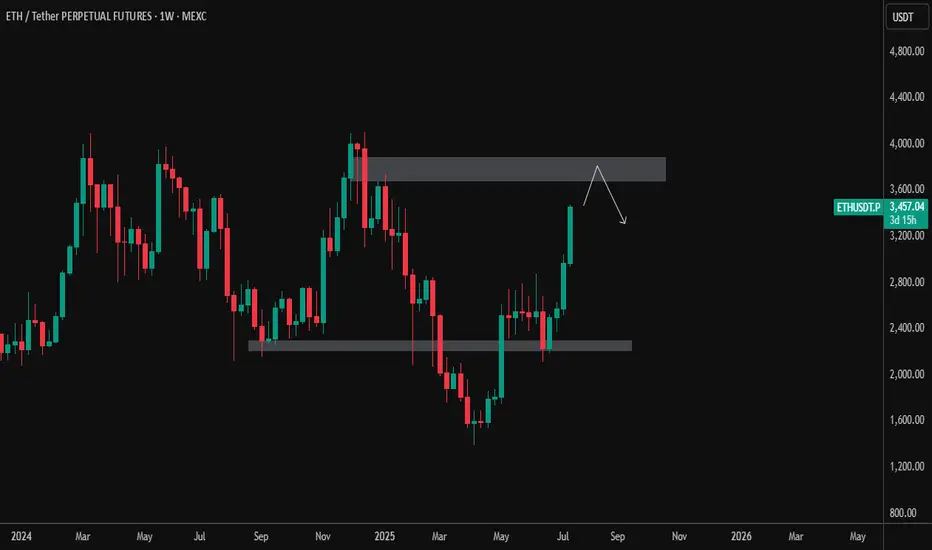
ETH/USDT – Weekly Chart Analysis (July 17, 2025)Ethereum has shown a strong bullish push, breaking above the prior consolidation zone between $2,400–$2,600. Price is now approaching a significant weekly supply zone between $3,800–$4,100 — a region that previously acted as a major reversal point.
🔹 Current Price: ~$3,460
🔹 Resistance Zone: $3,800–$4,100
🔹 Support Zone: $2,400–$2,600
📌 Possible Scenarios:
Rejection from resistance: ETH may test the upper supply zone and face selling pressure, triggering a pullback toward the mid-range or support.
Breakout & Close Above $4,100: Would signal strong bullish continuation with potential targets toward new highs.
📉 Watch for: Bearish price action near resistance or a potential lower high forming.
📈 Bullish Bias Confirmed if: Weekly close above $4,100 with volume support.
🧠 Patience is key at major levels. Let price action guide the next move.
Ethereum reached to our target
Ethereum reached to $3400 that we talked about since weeks ago, but now the daily RSI is at overbought area and we might see a correction.

ETHUSDT minor trendsEthereum BINANCE:ETHUSDT is downtrend with lower highs from the bottom is nearly finished 📉 . For a stronger rise, it needs to stabilize above $2500 ⚡. Mid-term targets are $3300 (end of second leg) and $3700 (major resistance) 🎯. Key supports are $2500, $2070, $1800, and $1550, the base where the uptrend began 🛡️.
Supports & Resistances:
Supports: \$2500, \$2070, \$1800, \$1550
Resistances: \$2500 (critical level), \$3300, \$3700

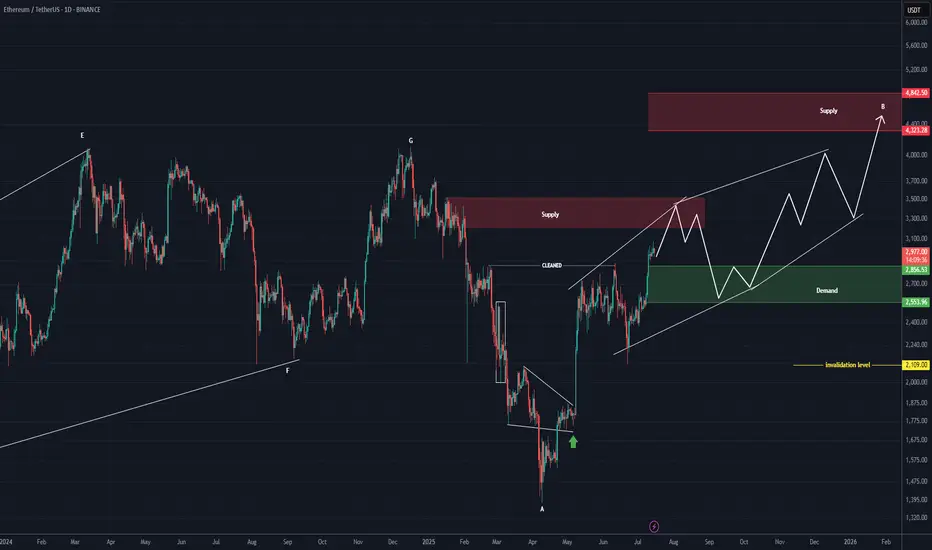
ETHEREUM Roara Map (1D)The previous phase of Ethereum appears to have been a completed diametric, and now it seems we are in a flat pattern.
It can be said that we are currently in wave B of the flat, which itself appears to be a diametric.
This diametric could even extend to the 4300–4800 range.
The green zone is the rebuy area.
A daily candle close below the invalidation level would invalidate this analysis.
For risk management, please don't forget stop loss and capital management
Comment if you have any questions
Thank You

ETHUSDT BUY / Long SetupThis 4hrs candle closes above the mentioned level, then took long from 50% fib level of the fvg, and put sl below the recent swing low, I will update the trade whether it's active or not? tp towards 3.3-3.4k , while btc.d getting recked so becareful shorting any altcoin.

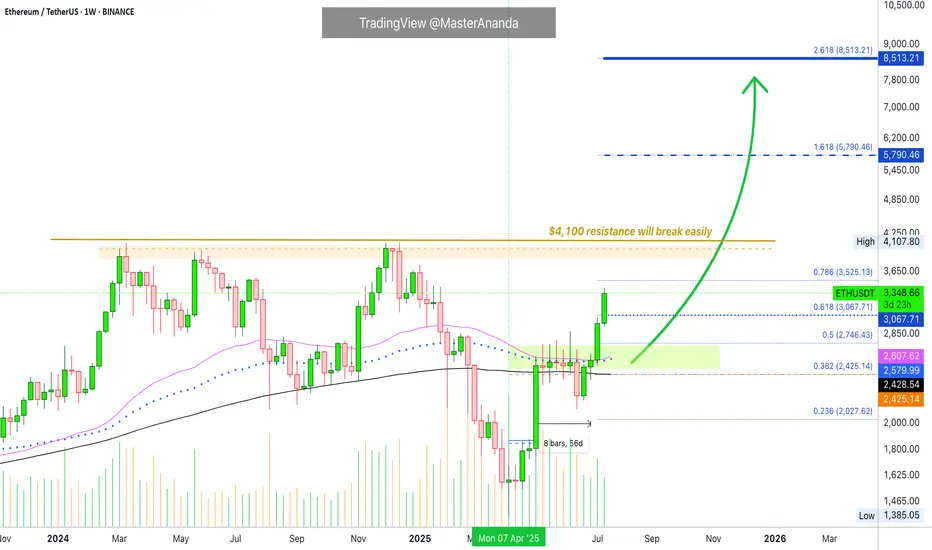
Ethereum · Going beyond $5,790 · $8,513 Next TargetThe eight weeks of consolidation, 56 days, happened as compressed (sandwich style) action right in-between MA200 and EMA55/89.
The EMA55/89 duo worked as resistance while MA200 worked as support.
Before a major move the market always tends to produce a form of shakeout. Sometimes it is call a bear-trap, a shakeout, a liquidity-hunt or stop-loss hunt event, a failed signal, etc.
Here Ether (ETHUSDT) closed below MA200 one week just to recover the next. In this case, we will call it a failed breakdown but we know this is a way to liquidate over leveraged long-traders, also a way to catch unsuspecting bears ready to short. The conclusion is simple, Ether recovered the next week above MA200 and the following week above EMA55/89 which worked as resistance for six weeks. With these levels behind us, the market is full green.
Notice the last two candles, big huge green candle. That is because resistance is no more.
With no resistance to stop prices from rising, Ethereum started to grow and we are now in full blown bullish mode.
The last major high sits at $4,107. This is an easy target, the minimum. Once support is tested the action moves toward resistance and this is where we are headed.
Some people will wonder if resistance will break or hold. Some unsuspecting bears, again, will even short at resistance thinking this is the logical move, they will lose all.
The truth is that this resistance and major high will break easily, we know this based on marketwide action and Bitcoin, Bitcoin is hitting new all-time highs every other day. In this way, we know that Ethereum will soon catch up and do the same.
Many altcoins are moving forward and growing, and some already conquered their December 2024 high price. This is another indication that shows Ether will not stay behind.
Whatever you do when Ethereum goes up, do not short. You can short if you are going to close the short after just a few hours or a few days, but instead of shorting a bullish trend, go LONG and enjoy maximum profits on the way up.
» Ethereum will break $6,000 and move toward $8,500 and beyond in the long-run.
You read it here first.
Thanks a lot for your continued support.
Resistance will break and the altcoins market will continue to grow. Not only for a few months but for a very long time.
When correction time comes, it will last a few months, we will get higher lows and then additional growth. Think of the pattern that came up on Bitcoin but with the altcoins; long-term growth.
Namaste.
Divergence Gap on CMP PAR indicatorPlaying the Divergence Gap on CMP PAR indicator to compound longs/shorts in a strong trebnd.

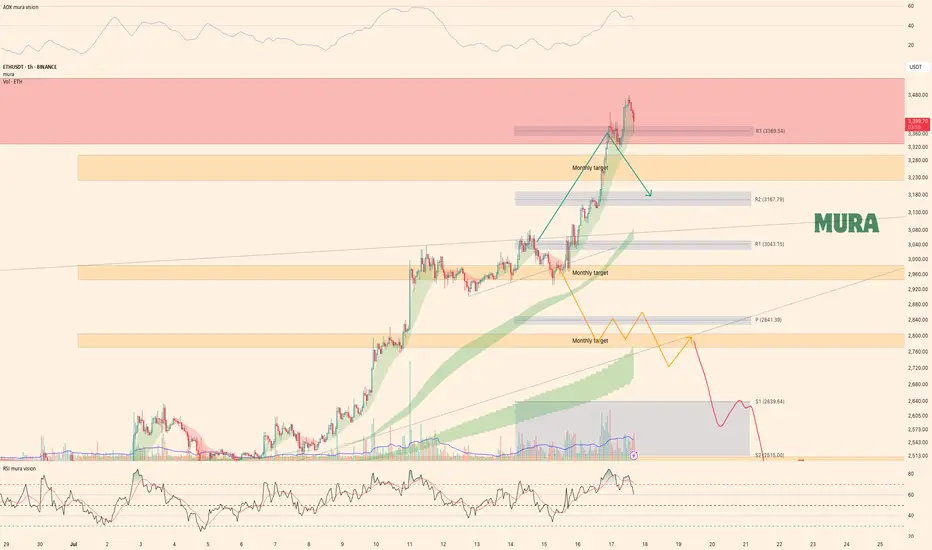
#ETH Update #4 – July 17, 2025#ETH Update #4 – July 17, 2025
Ethereum is currently facing a significant resistance zone. The recent bullish move has been very steep, which often leads to a correction. If that happens, the first potential retracement level is around $3,010.
If Ethereum continues to rally without correcting, the next upside target is $3,700. However, USDT Dominance has reached a support level. If that support holds, we could see capital rotation into USDT, accelerating a pullback in ETH.
At this point, a slowdown in Ethereum’s momentum is likely. If you're holding altcoins, it might be a good moment to take some profits.

tahlile eth baye in mahHere is the English translation of your analysis:
---
**Comprehensive Analysis of Ethereum**
Ethereum is currently at a critical point and is experiencing significant volatility. It is attempting to break through key resistance levels to continue its upward trend. However, failure to break these levels could lead to a price decline. Various factors, such as whale activity and the break of key resistance levels, can influence Ethereum's future trend.
### **Technical Analysis**
**Current Trend:**
Ethereum is currently trading in a range, fluctuating between support and resistance levels.
**Support Levels:**
Key support levels are at **\$1,750** and **\$1,650**.
**Resistance Levels:**
Key resistance levels are at **\$1,930** and **\$2,100**.
### **Possible Scenarios**
* **Bullish:** If Ethereum can break above the \$1,930 resistance level and hold above it, it could move toward higher targets.
* **Bearish:** If Ethereum fails to break through the resistance levels, it may decline toward lower support levels.
### **Whale Activity**
Whale activity currently has the potential to significantly impact Ethereum's price trend. If whales continue to accumulate Ethereum, it could support a reversal of the bearish trend.
---
### **Fundamental Analysis**
**Correlation with Bitcoin:**
Ethereum remains heavily influenced by Bitcoin, and its price movement is largely dependent on Bitcoin’s trend.
**New Projects:**
The development of new projects within the Ethereum ecosystem can drive demand and increase its price.
**Regulations:**
New regulations in the cryptocurrency space can affect Ethereum’s future.
---
### **Recommendations**
* **Monitor Whale Activity:**
Investors should pay close attention to whale behavior in the Ethereum market.
* **Watch for Resistance Breakouts:**
Breaking through key resistance levels could signal the beginning of a bullish trend.
* **Risk Management:**
Given the high volatility in the crypto market, effective risk management is crucial in investment strategies.
* **Further Research:**
Conducting additional research on Ethereum and the factors influencing it is highly recommended for better decision-making.
> **Note:** This analysis is a general overview of Ethereum’s current status and should not be considered as investment advice.
---
Let me know if you'd like this formatted as a PDF, presentation, or infographic.

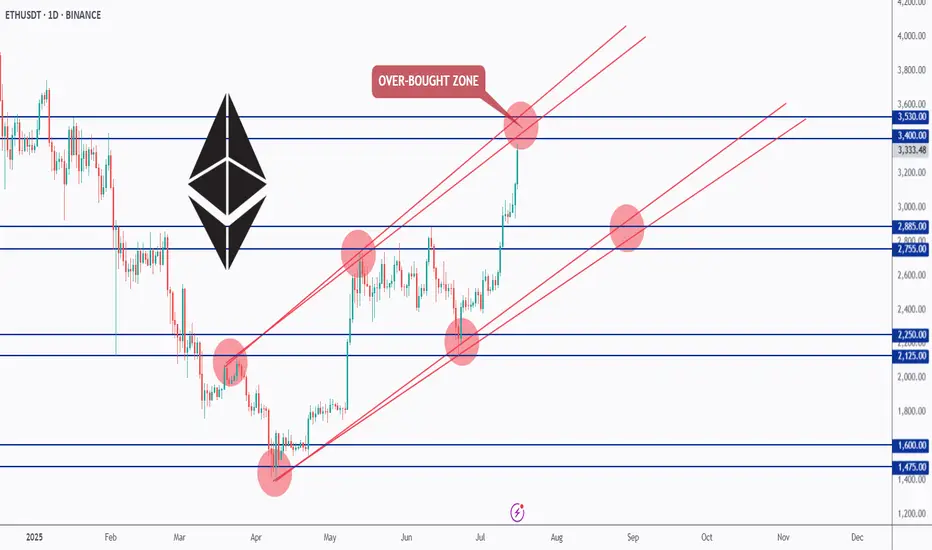
ETH Testing Overbought Zone — What’s Next?📊ETH has been overall bullish, trading inside this rising red channel for months.
After breaking above the $2,885 resistance, bulls took full control, and price is now approaching the upper red trendline — an overbought zone where we’ve seen rejections before.
As long as ETH holds above the $2,885 zone, the bulls remain in control. But since we’re near a strong resistance and the top of the channel, we’ll be waiting for a potential correction or at least a slowdown in momentum before looking for fresh entries.
📌 Key levels to watch:
Resistance: $3,400 – $3,530
Support: $2,885 – $2,755
Let’s stay patient and follow the market’s lead. 🧠
Let me know your thoughts in the comments 👇
📚 Always follow your trading plan regarding entry, risk management, and trade management.
Good luck!
All Strategies Are Good; If Managed Properly!
~Richard Nasr
From now on, be careful!!Hello friends..
We are back with a new analysis of the Ethereum cryptocurrency, from the area I had previously specified, we are currently in profit by about 120%. (We gave a buy signal to the good cryptocurrencies in the market at the peak of market disappointment, you can enter the page to view.)
Now we have reached the resistance area where correction is possible, there is a strong resistance from the $3400 to $3600 area, you can sell 50% of your assets in this area if confirmed and add to your assets if corrected (I will indicate the buy areas in the next analysis).
If you have a cryptocurrency that you want us to analyze for you, you can write the name of the cryptocurrency in the comments, and wait for the analysis post (priority is given to the cryptocurrency that gets the most likes)
Don't miss our page in these bullish days of the market. (You won't lose

$eth/usdt short swing zoneth: htf/ltf liq + stop hunt (1.204 fibonacci) + ote zone (88.6/91.5 fibonacci) + bat harmonic

Ethereum Wave Analysis – 16 July 2025
Ethereum: ⬆️ Buy
- Ethereum broke resistance area
- Likely to rise to resistance level 3400.00
Ethereum cryptocurrency recently broke the resistance area located at the intersection of the resistance level 3200.00 and the resistance trendline of the daily up channel from May.
The breakout of this resistance area should accelerate both of the active impulse waves 3 and (3).
Given the clear daily uptrend, Ethereum cryptocurrency can be expected to rise to the next resistance level 3400.00 (which reversed Ethereum multiple times in January).

Ethereum's Road to $7500 – Strategic Entries & Profit Optimizati🔵 Entry Zone: My first position is placed at $2225.5, aligning with a strong support level, while a secondary entry at $1857.5 serves as an additional safeguard against unexpected market swings—lowering my average purchase price and protecting capital.
💰 Profit-Taking Strategy: For low-risk traders, securing a 40% profit from the first entry is a prudent move to lock in gains early. However, my long-term target remains ambitious.
🚀 Main Target: Based on valuation models and fundamental news, Ethereum’s upside potential points toward $7500. However, I personally plan to secure 90% of my holdings at $6000, ensuring strong profit realization while leaving room for further upside.
This setup balances risk management, smart positioning, and strategic profit optimization. Let’s see how ETH’s trajectory unfolds!
Entry1: 2225.5
Entry 2: 1857.5
If your second entry is successful, you are required to withdraw 50 to 70 percent of your capital to maintain your capital. I will definitely update this setup.

$ETHUSDT: Time at mode trend signalMonthly chart signal gives me a 17,975 United States of America Dollars per Vitalik Coin target🎯, within 19 months from now...
I don't think many people can fathom this but it is entirely possible, and probable now. (few bulls and those bullish mention 10k as a target, but nothing as high as this)
Best of luck!
Cheers,
Ivan Labrie.