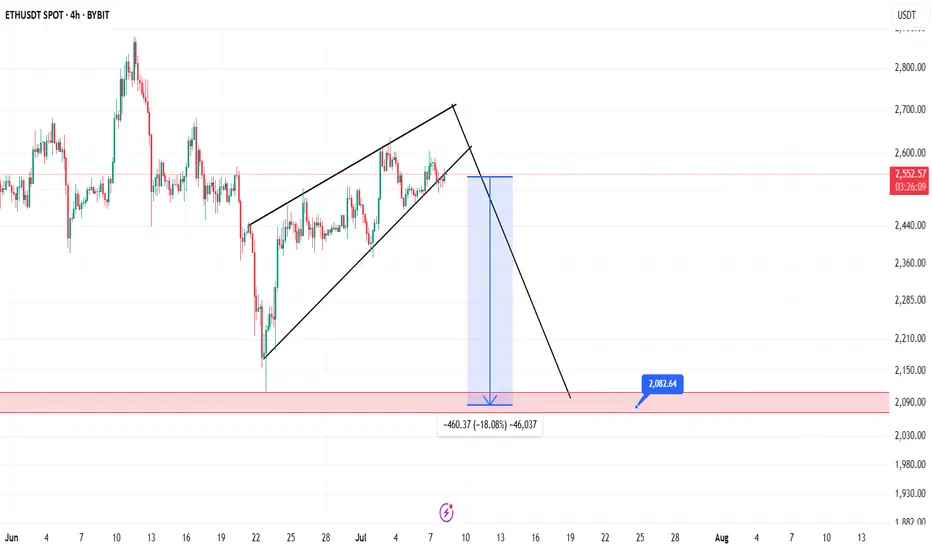
ETH Short IdeaRising trend broken. You can see MSB easily
Volume going down during price rising.
I am waiting correction to 1860
ETHUSDT trade ideas

Ethereum (ETH): Will Say It Again $2800 Is Scripted!Ethereum buyers are dominating currently, with the price climbing closer and closer to our major target of $2800.
What to pay attention to are the 100 and 200 EMAs, where usually once we have shifted apart from them, we have seen some kind of correctional movement if buy-side momentum is lost so that's what we are keeping an eye on.
If we see currently further buy-side pressure, then we might reach our target within this week, but if sellers take even slight control, we most probably will retest the EMAs before another attempt to upper zones.
Swallow Academy

ETH/USDT Long term ContinueAbsolutely! Here's your Ethereum long position analysis in English based on the chart you shared:
🧠 My Position – Long at $2,590
📍 Current Price: ~$2,605
👉 That means you're currently ~$15 in profit (small gain for now).
📊 Chart-Based Technical Analysis (1D timeframe)
✅ Key Support Levels
$2,423 – Fibonacci 0.382 level
$2,450–$2,475 – Close to the 50 EMA (blue line)
These zones serve as strong support, holding the price up.
🚀 My Entry Strength
You entered at $2,590, which is:
Above EMA 20 (red) — bullish short-term signal
Right in the tight moving average cluster (20/50/200) — often a sign of an upcoming breakout
📈 Risk/Reward Ratio
Entry: $2,590
Stop-Loss: $2,575 → Risk: $115
TP1: $2,743 → Reward: $1530
R/R ratio for TP1: ~1
✔️ Overall: Very good entry with balanced risk.
🔔 Recommendations:
If ETH moves above $2,650, consider moving SL to break-even ($2,590) — protect your capital
Near $2,743, you could:
Close 50% of my position
Or use a trailing stop to lock in more profit

ETH FAST TRADE [15M]📝 My ETH Short Idea (Test Trade)
This is a test idea where I’m simply practicing my analysis and trade execution. It’s built entirely on my own personal strategy, so it’s primarily for self-development and tracking.
💡 The main setup:
I’m looking for a short position on ETH, but this idea will only be valid if all my levels and conditions align exactly.
Otherwise, I’ll skip the trade.
📌 How to enter:
I’ve detailed exactly how to enter the trade:
Wait for my specific trigger conditions to be met (price levels + confirmation by my indicators).
Enter only after the setup is fully formed — no early entries.
Manage risk properly with stop-losses beyond key invalidation levels.
Scale in only if price structure continues to validate my scenario.
⚠️ Important:
This is not financial advice. I’m using this idea mainly to test and refine my strategy. Sharing it here for transparency and to improve my analytical discipline.
✅ Plan:
If the setup completes exactly as planned, I’ll look for targets according to my strategy’s rules, trailing stops along the way.

#ETH Ascending Triangle📊#ETH Ascending Triangle 📉
🧠From a structural perspective, the bullish target near the neckline support area has been achieved, so there is an expectation of a pullback.
➡️From a graphical perspective, there is an ascending triangle superimposed inside the ascending wedge. Generally, we regard such models as bearish models. Therefore, with the support of multiple decline expectations, we should not chase the rise here! ! !
🤜If you like my analysis, please like 💖 and share 💬 BITGET:ETHUSDT.P

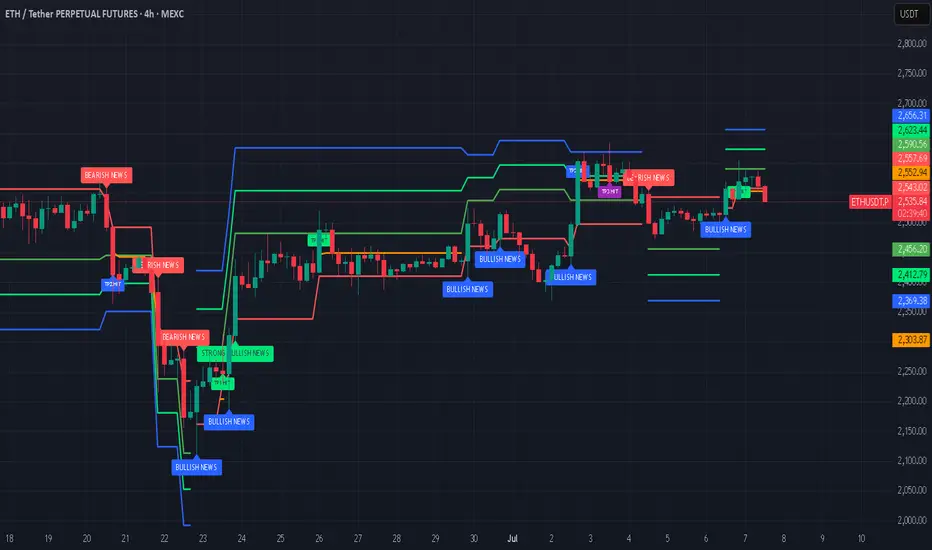
ETH/USDT Chart Analysis (4H)
ETH has been trading inside a symmetrical triangle (shown by converging black trendlines).
A breakout has occurred above the descending trendline, signaling bullish momentum.
The rising diagonal trendline from late June is acting as strong support.
Ichimoku Cloud:
ETH is above the cloud, indicating a bullish bias.
The cloud below the price is green and fairly thin, suggesting modest support if the price dips back.
Key Levels:
Resistance Zone: $2,650–$2,700 (upper breakout zone).
Immediate Support: $2,550 trendline area.
Major Support Zone: $2,250–$2,450 (large yellow box). This has previously served as a significant accumulation zone.
Potential Scenario:
The price may retest the broken triangle trendline around $2,550–$2,570 (as indicated by the wavy projection on your chart).
Holding above this level could fuel a rally toward $2,750–$2,850 next.
Losing $2,550 would expose ETH back toward the bigger yellow support zone.
Short-Term Outlook:
Momentum favors bulls as long as ETH stays above ~$2,550.
Watch for volume on any move above $2,650 to confirm continuation toward higher targets.
Conclusion:
ETH has broken its triangle resistance and looks poised for further upside. A successful retest near $2,550–$2,570 could launch the next leg higher toward $2,750–$2,850.
Stay tuned for updates and key levels to watch!
Thanks for your support!
DYOR. NFA

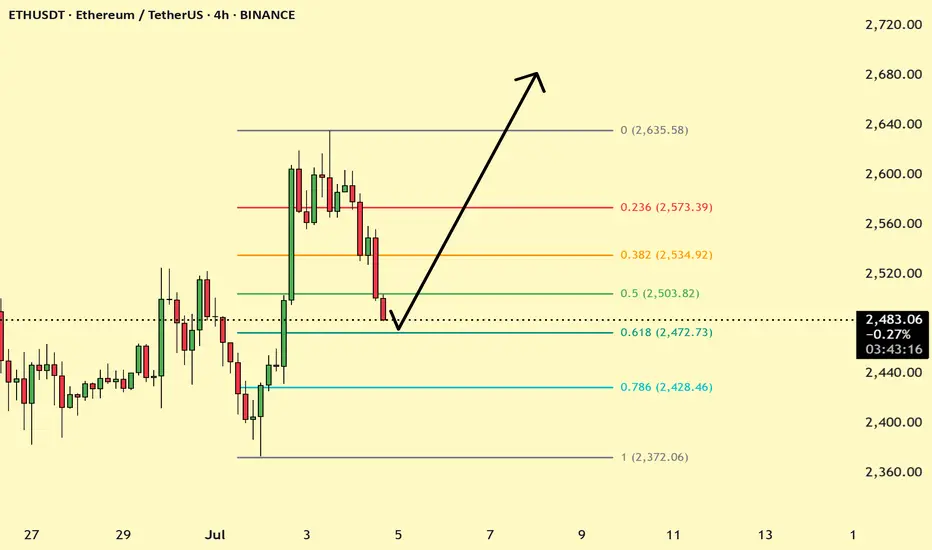
ETHUSD At 0.618 fib If holds can go 2680 ETHUSD recently in uptrend as par to correction the price has reached 0.618 Fib and price maty reverse if the bulls are Strong let us see....
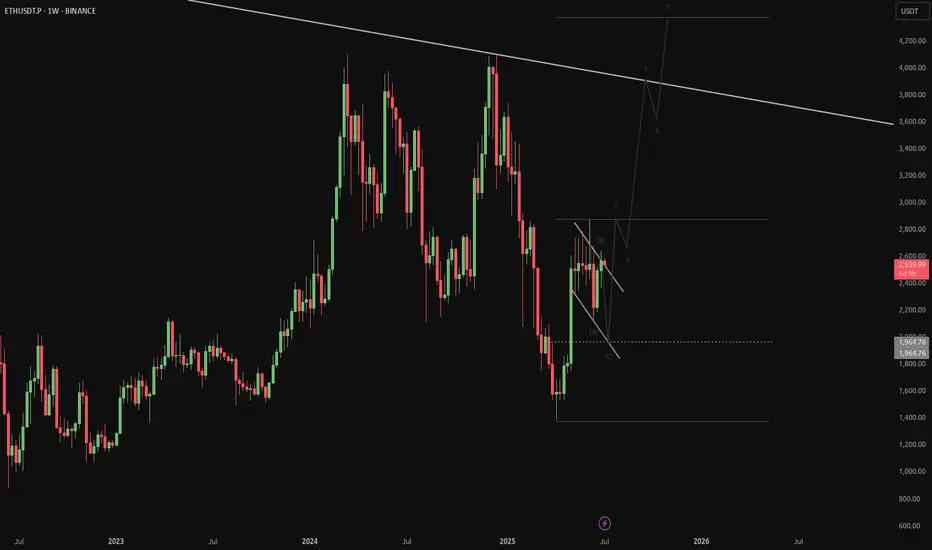
ETHEREUM ROADMAPI tried to predict based on previous time periods and elliot waves.
Please note that my analysis is not short-term. Of course, there may be short-term correction waves in Ethereum.
* The purpose of my graphic drawings is purely educational.
* What i write here is not an investment advice. Please do your own research before investing in any asset.
* Never take my personal opinions as investment advice, you may lose your money.

ETH/USDT 1W Chart📊 Trend structure (Price Action)
Downtrend (historical):
A series of Lower Highs (LH) and Lower Lows (LL) — a classic downtrend.
Confirmed by the orange downtrend line.
A change in structure — a possible beginning of an uptrend:
A Higher Low (HL) has recently been formed after a Lower Low (LL).
Suggests a possible end to the downtrend and an attempt to break out upwards.
Currently:
The price is testing the upper downtrend line.
A breakout above the orange line may confirm a trend change.
🟢 Key Resistance Levels (Green Lines):
Level Meaning
3.058 USDT Potential target after a breakout from consolidation
2.767 USDT Nearest strong resistance - currently being tested
3.427 USDT Deep resistance level from the previous high (HH)
🔴 Key Support Levels (Red Lines):
Level Meaning
2.234 USDT Nearest support - previous breakout
1.883 USDT Early 2023 support
1.507 USDT Local bottom
1.204 USDT Historical support - LL extreme
📉 Stochastic RSI (Momentum Indicator):
Currently in the overbought zone.
This may suggest a short-term correction before an actual breakout.
However, in a strong uptrend, the indicator may "hang out" in the overbought zone for a long time.
📈 Potential scenario:
If the breakout above 2.767 and the orange trendline holds:
A possible move to 3.058 USDT as the first target.
Extended target: 3.427 USDT (HH).
If the breakout fails:
Correction to 2.234 USDT or lower.
There is a risk of returning to a downtrend.
✅ Bullish signals:
Higher Low (HL) formation after Lower Low (LL).
Testing the upper downtrend line with an attempt to breakout.
Volume is increasing (based on candles).
⚠️ Bearish threats:
Stochastic RSI in the overbought zone.
Breakout not confirmed by 100% (needs a weekly closing candle above 2.767).
Resistance at 3,058 could halt the move.
📌 Conclusion:
Ethereum (ETH) could be on the cusp of a new uptrend, but a breakout above 2,767 USDT is needed for confirmation. If it does, a move to 3,058 and then 3,427 is possible. However, the current overbought level on the Stochastic RSI could signal a short-term correction before the trend gains strength.

ETH Long Swing Setup – Sideways Hold with Dip-Buy OpportunityETH continues to hold above the key $2,300 support, showing resilience and consolidating within range. We’re watching for one more dip into the $2,300–$2,375 zone to trigger a long entry, with momentum building for a potential breakout.
📌 Trade Setup:
• Entry Zone: $2,300 – $2,375
• Take Profit Targets:
o 🥇 $2,900 – $3,000
o 🥈 $3,300 – $3,400
o 🥉 $4,000 – $4,200
• Stop Loss: Daily close below $2,000

Short-Term ETH Setup – Bearish Bias with Target at $2536Short-Term ETH Setup – Bearish Bias with Target at $2536 🐻
Ethereum is showing signs of weakness below resistance, and a short-term pullback could be on the table. If bearish momentum holds, I’m watching $2536 as the next key target.
Tight risk management is crucial — this setup offers solid R/R if played with precision.
📉 Follow for real-time analysis, sharp entries, and no hype.

ETHUSDT Long / Buy SetupMust take from the entry and USE tight SL. Can be a fakeout, if real breakout then tps are mentioned. In case sl hit, use the previous setup, it's still valid. While for short I'm still waiting for 3k or above.

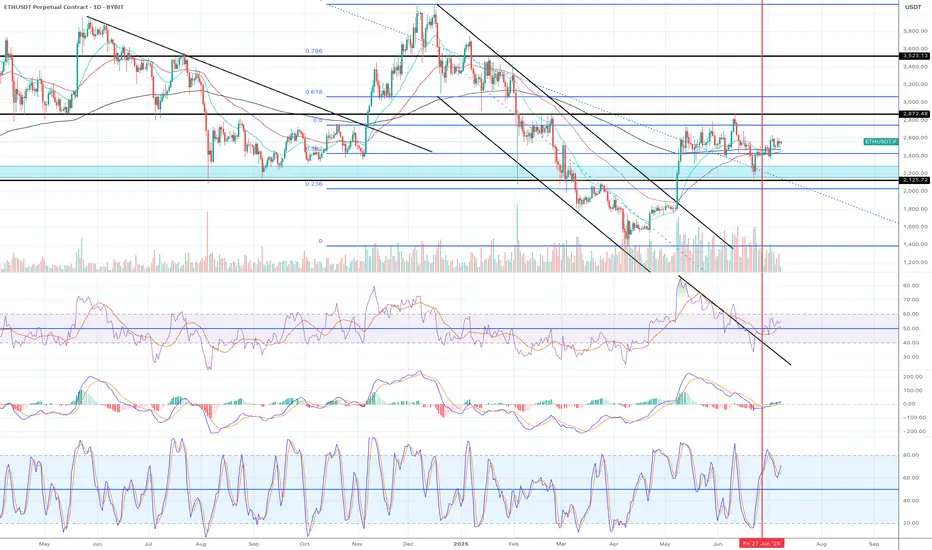
ethI have a strategy with 80% win rate.
The essence of it is that by the end of October, we will not see ETH above 4100.
On the other hand, we are still within the body of the 12-month candle from 2021. In 2024, we failed to hold above 3700, which indicates weakness and increases the likelihood of a move toward the 2021 low, around 700.
Right now, this sounds pessimistic and I don't like this scenario, but that’s how I see the chart.

Ethereum Facing Key Resistance, Breakout or Fakeout?ETH is pressing into major horizontal resistance near $2,600 after breaking out from a double-bottom structure. Price is moving within a wide range capped near $2,900 and supported by the 0.5 and 0.618 fib zones.
🟢 Scenario 1 – Bullish:
Clean break and hold above $2,600 opens room to test the top of the range around $2,900. Watch for a higher low retest to confirm strength.
🔴 Scenario 2 – Bearish:
Rejection here could send ETH back toward $2,340 (0.5 fib) or even $2,220 (0.618). The stochastic RSI is approaching overbought, signaling caution.
This chart is for educational purposes only — not financial advice.

Time to go long!!
1) A candle broke out and closed above the descending parallel channel.
2) The price has been consolidating above Fib0.0382 level for weeks.
3) The recent candles are sitting above EMA21.
4) EMA 21 is above EMA55.
5) EMA200 is running horizontally still but it is getting close to cross EMA55.
6) All momentum indicators are in the bull zone and still plenty to go before it hits overbought territory.
There might be a strong breakout to the upside.
It is time to go long.
Ethereum (ETH): Buyers Showing Dominance | $2800 IncomingBuyers are doing a great job currently, keeping the price above the EMAs (which also have been marked by us as a retest area after we did that break of structure on the 2nd of July).
Now as long as we are above our buy zone, we are bullish on ETH. As many know, we are far away from the potential of ETH and the first target is at $2800-$3000.
Swallow Academy

$ETH - SELL to BUY BiasOn the Daily Timeframe, Ethereum cleared the liquidity sitting on the $1755 zone and bounced off the support around $1500 region. It then rallied hard and swept the liquidity at $2800 , doubling and confirming it as a solid Resistance zone.
Using strong buy rejection and good volume as confirmation, a sell from the $2700 - $2750 zone is feasible, with target at the liquidity sitting at $2100 - $2110 zone.
We then, can consider buying from any POI below that zone.
Remember to REACT and not PREDICT. DYOR‼️

Ethereum Faces Key Resistance: Potential Pullback AheadHello Guys!
What I see:
Head and Shoulders Pattern:
Left Shoulder: Formed
Head: Peak, followed by a drop.
Right Shoulder: Formed.
The neckline break around $2,450 initiated a downside move, confirming the bearish setup.
Current Price Action:
ETH is currently trading near $2,519, attempting to reclaim the broken neckline zone, which now acts as resistance.
The price action is showing lower highs, hinting at weakening bullish momentum.
Bearish Retest in Progress:
The chart shows an anticipated bearish retest of the support-resistance flip zone ($2,530–$2,550), with a probable rejection leading ETH back down toward the $2,440–$2,450 support zone.
Demand Zone:
A strong demand area is visible between $2,420–$2,450. Price may revisit this zone before making the next major move.
Trend Channel:
ETH is moving within an ascending channel, and the lower bound coincides with the highlighted demand zone.
________________________
Let's check this deja vu:
You can see that previously the price formed an H&S and after that did a hunting of the head! And after that price experienced a drop there! Same scenario here!

ETH - Should I go long?Ethereum (ETH) is currently positioned at a critical juncture, with multiple technical and fundamental indicators suggesting the potential for a significant move ahead.
Current Price and Momentum: As of the latest real-time data, ETH is trading at $2,549.97, having recently started a fresh increase above the $2,520 zone. The price is above both the $2,550 level and the 100-hourly Simple Moving Average, indicating short-term bullish momentum.
Key Resistance Levels: The immediate resistance is near $2,600, followed by $2,620 and a major barrier at $2,650. A decisive break above $2,650 could open the path toward $2,720 and potentially $2,800 in the near term.
Support Levels: On the downside, $2,520 is a key support zone. A sustained drop below this could trigger declines toward $2,500 or even $2,420, but as long as ETH holds above $2,520, the bullish structure remains intact.
On-Chain and Institutional Signals: Long-term holders have been accumulating ETH, and institutional inflows have surged, with over $750 million invested recently. This accumulation, alongside strong ETF inflows and rising staking activity, points to growing confidence and could act as a catalyst for a major price move.
Technical Patterns: ETH is consolidating above critical moving averages and within bullish chart formations (such as ascending triangles and coiling structures). These patterns often precede significant breakouts, especially when accompanied by increasing trading volumes and improving momentum indicators.
Market Sentiment: While short-term indicators show some cooling, the broader trend remains bullish. Analysts note that if ETH can break above the current resistance cluster, it could ignite a new wave of bullish momentum and set the stage for a broader breakout.
In summary: Ethereum is at a pivotal resistance zone. If it can break and hold above $2,600–$2,650, analysts expect a strong move higher, with targets at $2,800. Institutional inflows, strong on-chain accumulation, and bullish technical setups all support the case for a significant upside move in the coming weeks or months, provided key support levels are maintained.
Note that a possible correction of Bitcoin (which essentially will result in a drop of the entire crypto market) is possible in the next weeks.
#crypto #eth #btc #bitcoin #ethereum #analysis #trading #portfolio #long #algorithm #buysellsignals #tradingsignals #bullrun
Ethereum (ETH): Buyers Back in Control | From $2570 to $2800?Ethereum is still strong on the 1D timeframe, we are seeing the EMAs being controlled by buyers and secured, which is opening for us the gap to move towards the $2800 area.
What we want to see now is a proper BOS on the current timeframe at $2600, which would then be an ideal entry for a smaller long position!
Swallow Academy

Ethereum (ETH): Still Cheap Don't You Think? | $2800 NextEthereum is still cheap compared to what is about to happen. Now saying "about to happen" is a little broad, saying as it might be weeks or months until we see the full potential of ETH but we are bullish for sure.
Bitcoin had its moment of money inflow and now money has to flow somewhere else, which should be ETH. This is the next stage for the bull market and that's what we are looking for.
Targeting currently $2800, but overall we want to see at least $4000.
Swallow Academy
