15-minute analysisThe price went up to 3717 and got rejected. It’s currently sitting around the 3666 level with low volume, and for now, the market seems calm.
It’s clear that a significant level has formed here, which looks reliable.
We also have another key level around 3580.
Based on my analysis, I expect the price to react to one of these two levels and then potentially start a move toward the 38,000 mark.
ETHUSDT trade ideas

Ethereum (ETH/USDT) – Midline Break Retest and Channel Top in Si🔍 Technical Overview
Ethereum has recently broken above the midline of its descending channel, indicating a potential bullish shift within the short-term corrective structure. The price action suggests that we are currently witnessing a retest of the broken midline, which is now acting as dynamic support.
This behavior is consistent with smart money principles — where a previously broken internal structure gets tested before continuation.
⸻
🧠 NEoWave Context
Structurally, ETH appears to be developing a Contracting Corrective pattern, with the current leg likely evolving as Wave D. This wave typically exhibits strength and complexity, often stretching toward the channel top while still respecting broader consolidation boundaries.
⸻
💡 Smart Money Insights
• ✅ BOS already confirmed on LTF (1H, 4H) with higher lows
• 🔄 Price has reclaimed the internal broken structure (midline) and is retesting it
• 🔋 Bullish OB around $3,480–$3,510 acted as a launch zone for current leg
• 📍 Next resistance is the channel top near $3,740
⸻
📊 Trade Scenarios
🟩 Bullish Scenario (Preferred):
If the retest of the midline holds, ETH is likely to continue its move toward the upper boundary of the descending channel (~$3,730–$3,750). This aligns with Wave D expectations in complex corrections.
🟥 Bearish Invalidations:
A breakdown back below $3,520 and loss of the internal bullish structure would negate this short-term bullish scenario and reopen downside potential toward $3,350.
⸻
⚠️ Trader Tip:
Retests of internal structures like midlines or internal trendlines often provide low-risk continuation setups — if confirmed by bullish internal BOS.
⸻
✅ Conclusion
Ethereum remains technically corrective but with bullish momentum building within the channel. As long as the midline holds, we expect continuation toward the channel top, completing Wave D structure before potential reversal.
💬 Drop your alt counts or thoughts in the comments.
Aug 4, 2025 -- ETHUSDT.PMarket can expand after this retracement. If it doesn't give any indication to move higher we can expect deeper retracement or reversal. If it expands now, it has a strong resistance around 4000 level. If that breaks, way up. If not, we at least get long till the major resistance. Currently, price is in a sensitive zone, if we get Daily/4H indication of running lower, we short. If it displaces upwards on Daily/4H we long. On any side here, we wait for the first expansion move.

ETH USDTETH - needs a breakout from this Trendline and we are targeting 4k$.
Good support 3600-3650.
Always DYOR!

ETHUSD : Key levelsHere is a list of key levels. All of them will be interesting to the market, but when exactly from them will be a bounce I will inform in the next posts. It is foolish to just wait for a bounce from them. Stay tuned for the next posts.

Ethereum Wave Analysis – 4 August 2025- Ethereum reversed from the key support level 3400.00
- Likely to rise to resistance level 3800.00
The Ethereum cryptocurrency recently reversed from the support zone between the key support level of 3400.00 (formerly a resistance level from January) and the upper trendline of the recently broken up channel from May.
This support zone was further strengthened by the 38.2% Fibonacci correction of the previous sharp upward impulse from July.
Given the clear daily uptrend, Ethereum cryptocurrency can be expected to rise to the next resistance level 3800.00.
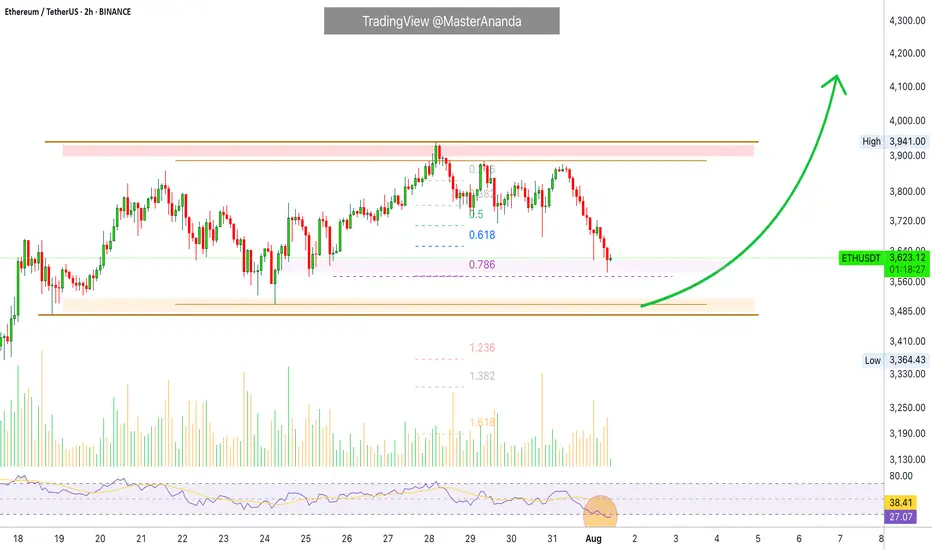
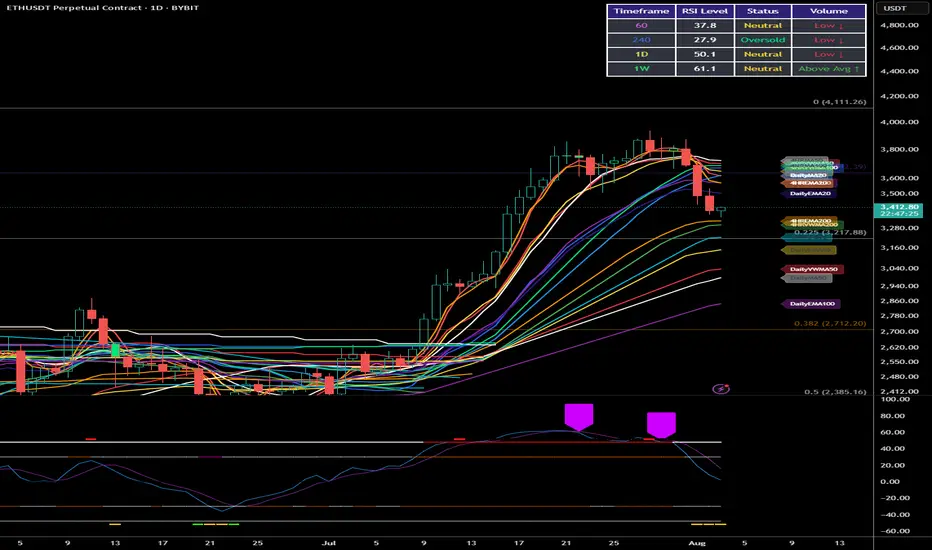
Ethereum Short-Term · Trading within Bullish RangeI am looking at Ethereum short-term using the same timeframe I used for Bitcoin, 2h. We have some interesting signals.
Here ETHUSDT is trading within higher lows. This is interesting because Bitcoin produced a lower low recently. The same volume signal is present here, ETHUSDT has been producing lower bearish volume since last month.
The RSI produced a lower low while ETHUSDT produced a higher low. This is called a hidden bullish divergence. Ethereum's bears did not only fail to take out the last low 24-July but also the previous one, and this clearly reveals bullish support.
The RSI being oversold is also a positive condition and can signal a reversal happening soon. Not truly a reversal because we are not in a downtrend, we are still witnessing a small pause after a strong rise; consolidation near resistance. A continuation reads better.
Ethereum's price continues really strong and the short-term signals are pointing to bullish action being favored in the coming days. We can wait easily and patiently because the best is yet to come. Never SHORT in a bull market, the market will surprise you with how fast things can turn. Better wait for support and go LONG.
Namaste.
ETHEREUM ETHUSDTThe main factors driving Ethereum (ETH) price changes over the last month include:
Institutional Demand and ETF Inflows: The launch and growing adoption of Ethereum spot ETFs by firms like BlackRock, Fidelity, and Grayscale have driven significant new capital into ETH. These ETFs have attracted institutional investors, creating strong buy pressure and wider market participation, contributing to a roughly 54% rally in Ethereum over the past month.
Corporate Treasury Accumulation: Several corporate crypto treasury funds have been aggressively increasing their Ethereum holdings, with some managing billions in ETH. This corporate buying adds substantial demand and upward price pressure.
Stablecoin Growth on Ethereum: Investor optimism about stablecoins, many of which are issued on the Ethereum blockchain (e.g., Tether, USDC), has contributed to speculation and bullish sentiment. Regulatory progress like the GENIUS Act also boosts confidence in stablecoin use and proliferation, indirectly supporting ETH.
Supply Dynamics: Exchange balances of ETH have hit near decade lows, creating a supply squeeze. Combined with the Ethereum network's issuance limits and deflationary pressure from network upgrades, this scarcity supports price gains.
General Market Sentiment and Macro Environment: While overall cautious bullishness drives price up, macroeconomic factors like Federal Reserve policy, interest rate adjustments, and global liquidity also impact ETH volatility. For example, tightening financial conditions and the strength of the U.S. dollar can create temporary downward pressure.
In summary, the price changes in Ethereum over the last month are predominantly driven by increasing institutional and corporate demand fueled by ETF offerings and treasury accumulation, positive momentum from stablecoin growth on Ethereum, tight supply dynamics, and supportive technical market signals. Macro headwinds and regulatory environment continue to modulate this trajectory.
#ethusdt #ethereum

ETH Still Holding Key LevelDespite the recent pullback following the FOMC meeting, Ethereum is still trading above a key daily level that previously acted as resistance ($3,865). As long as we don't see a daily close below this zone, the market structure remains intact, and my bias stays bullish.
Support holding here could set the stage for another leg up and potentially reignite altseason, going below will cause me to shy away from the idea of an altseason in the short future.
For now, I’m watching daily close closely and staying patient
ETH 4H – Trendline Test or Trap? Golden Pocket BelowEthereum’s 4H chart shows price compressing against rising trendline support after a strong impulse move in July. While bulls have defended the key reclaim zone (white box) multiple times, momentum is fading and structure is at risk.
Price is now coiling just above the diagonal trendline — a decisive bounce here could spark continuation. However, a breakdown opens the door to deeper retracements.
Key Fib retracement levels below:
0.5 at $3,032 – Initial reaction zone
0.618 (Golden Pocket) at $2,817 – High confluence support
0.786 at $2,511 – Extreme retracement target
The Stoch RSI is deeply oversold, suggesting a bounce may be near — but confirmation is needed.
📊 Things to watch:
Reaction at trendline support
Sweep of reclaim zone followed by reclaim
Golden Pocket retest with bullish divergence
If support holds, this could be a textbook higher low. If not, expect liquidity hunts toward the fib zones. Stay nimble.
Perfect candidate for a strategy backtest or reactive plan using alerts and confirmation tools.

ETH: Will Price Continue Upwards Movement! ETH has been steadily bullish in recent times, as the crypto market experienced a significant increased a safer option to invest around the global investment community. DXY and other major currencies currently experiencing a major drawdown in prices which indirectly helping the crypto market to remain bullish. While looking at how eth has performed in recent past, we can see it creating a record high in coming weeks.
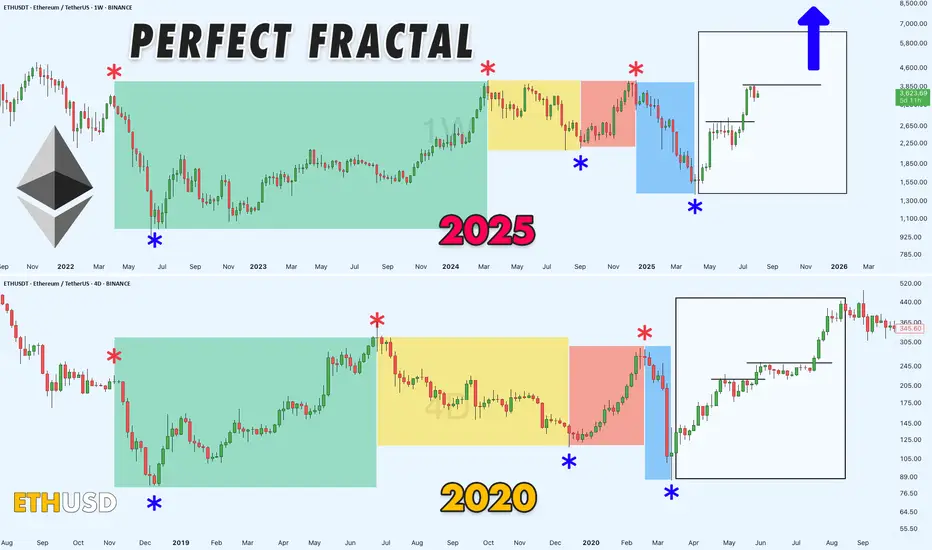
Haven't Posted in a Bit, Here's a Solid Chart for You All!Alright, been a while, but here's the deal: still no altseason in sight.
Meanwhile, ETHUSDT dropping some serious hints of a wild bull run on this fractal chart. It s got that 2020 vibe, though the timing s a tad off especially when you factor in Bitcoin s cycles.
Gonna be a blast watching this play out!
Ethereum (ETH): Keep Milking The ETH | Bounced From 200EMAEthereum has been one of the easiest coins to predict for upcoming moves, and we did it again. The 200 EMA rejected the price, which led to another smaller buy-side movement on the coin, giving us an opportunity for a long position here.
Well, nothing has changed; the game plan remains the same—we are aiming for $4000 again and then $4800.
Swallow Academy

Smart Money Knows: ETH Is Gearing for a Supercycle...Hello Traders 🐺
In this idea, I wanna break down why $15K ETH isn't just a fantasy — it's a real, reachable target. So stay with me 'til the end, because this is just the beginning for Ethereum and the altcoin market.
If you’ve been following my ideas over the past year, you know I’ve been loudly calling for an incoming altseason — especially since ETH hit $1700. I kept saying: “Load up on ETH while you can,” because smart money was clearly rotating into it.
And now? We’re seeing the result.
Since then, Ethereum has nearly 2x’d, and ETH ETFs are pulling in massive inflows — but the price hasn’t exploded yet. Why? Let’s look closer.
Over the past 90 days, ETH has rallied around +180%, but in a quiet, steady climb — which is actually bullish. A strong move with low hype = accumulation. That’s how smart money moves.
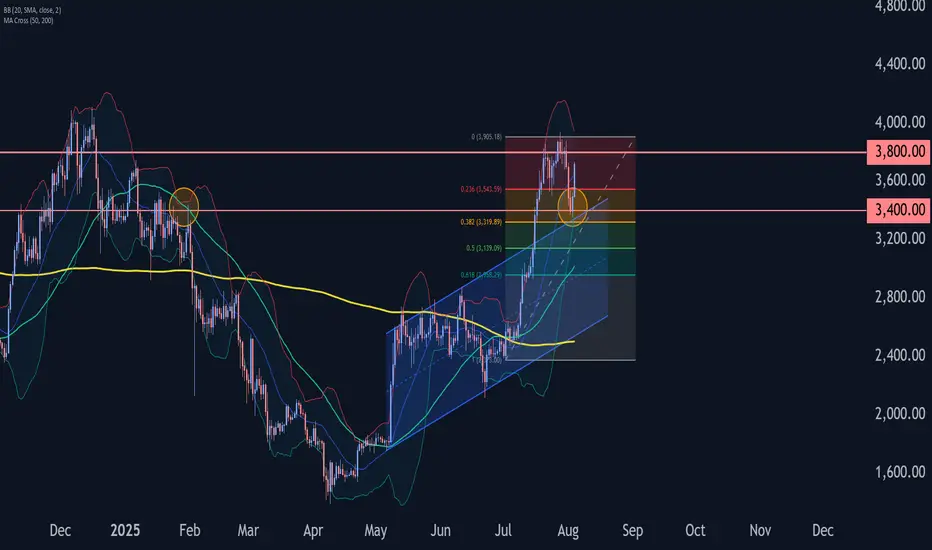
📊 Monthly Chart Breakdown:
ETH is moving inside a perfect ascending channel, with clean touches on both support and resistance. Right now, price is forming a bullish flag pattern at the upper range — a classic continuation structure.
Volume has dropped during this flag, which is a textbook sign of accumulation. Add to that: RSI is sloping downward, signaling that large players are shaking out weak hands while loading up quietly.
So yes — ETH has already done +180% during this consolidation phase, which tells us something big is brewing.
🔁 The current pullback on the daily? In my opinion, it’s just a technical reaction to the flag resistance. RSI is also trying to break above its own trendline. If both confirm, the next wave begins.
🎯 Targets?
First target: All-Time High around $4870.
After that? There's nothing but air until we hit the top of the monthly channel near $15,000.
That breakout above ATH is where the real FOMO begins — not just for ETH, but for the entire altcoin market.
Let’s not miss what’s coming.
And as always, remember our golden rule:
🐺 Discipline is rarely enjoyable, but almost always profitable. 🐺
🐺 KIU_COIN 🐺

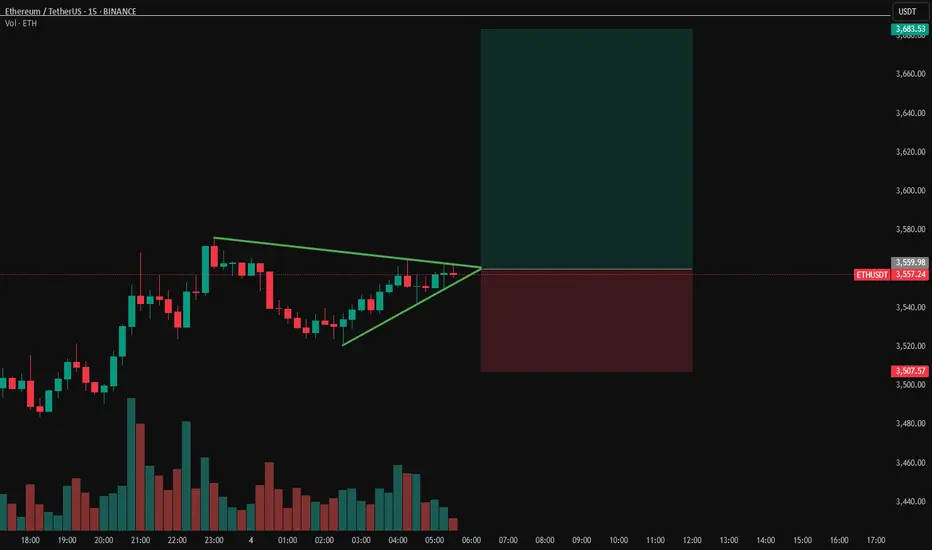
ETHUSDT Breakout ImminentETH sitting on $3500 support after reclaim
Price action is tight and indecisive.. lots of dojis and back-and-forth engulfing candles. Buyers and sellers clearly fighting it out.
We’re coiled in a symmetrical triangle, right on a key level that used to be strong support. It got broken but now reclaimed, im leaning bullish.
S&P and Nasdaq opened strong. If we break out of this triangle to the upside with volume, we could see a quick move toward $3650-3700.
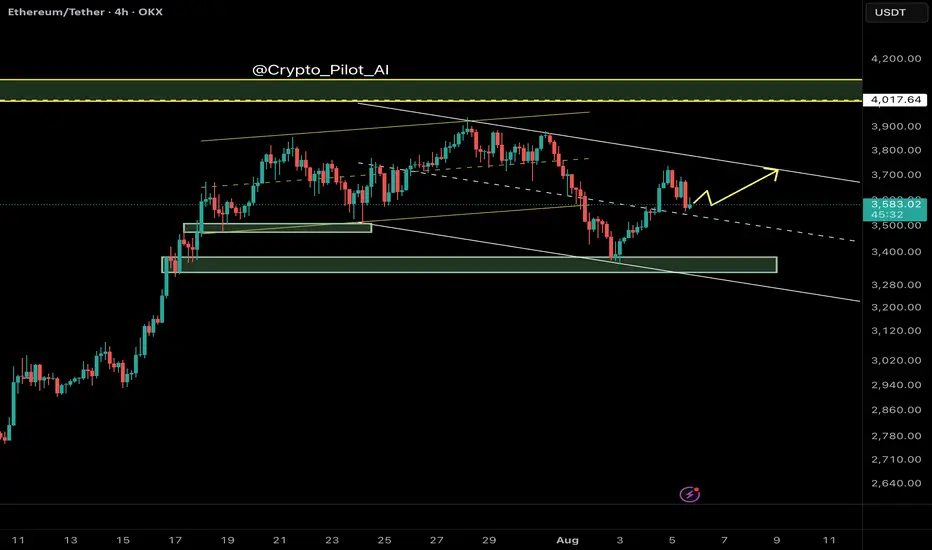
ETH Market Analysis: Where Are We Heading?Current Situation
Ethereum has been on quite a journey in 2025. After climbing steadily since January and reaching nearly $4,000 in July, we're now seeing a pullback with prices around $3,400. This isn't unusual - even in strong uptrends, prices don't move in straight lines.
What The Data Tells Us
Looking at the price patterns and technical indicators:
The big picture remains positive: Despite recent dips, Ethereum is still in an uptrend when looking at the longer timeframe. We're significantly higher than where we started the year.
We're at a decision point: The price is currently sitting at an important level where buyers and sellers have previously shown strong interest.
Support and resistance zones are clear: There have been consistent price levels where Ethereum tends to bounce (support) or struggle to break through (resistance).
Three Possible Paths Forward
Path 1: Resuming the Climb (45% likelihood)
If buyers regain control, we could see Ethereum push back above $3,500, then challenge the recent highs near $3,900. Breaking that level could open the door to the psychologically important $4,000 mark and potentially beyond.
Path 2: Further Pullback (40% likelihood)
If selling pressure continues, Ethereum might drop toward $3,200 first, with stronger support around $3,000. In a deeper correction scenario, we could test the $2,800 area where many buyers stepped in during previous dips.
Path 3: Sideways Movement (15% likelihood)
Sometimes markets need time to digest gains. Ethereum could spend several weeks trading sideways between roughly $3,300 and $3,600 before making its next significant move.
What To Watch For
Breakout signals: A strong move above $3,550 with increasing trading volume would suggest the uptrend is resuming.
Breakdown signals: Falling below $3,350 with conviction could indicate more downside ahead.
Volume patterns: Higher volume on up-days versus down-days would suggest stronger buyer interest.
This analysis is based purely on price patterns and technical indicators, looking at what the market has actually done rather than predictions based on news or sentiment.
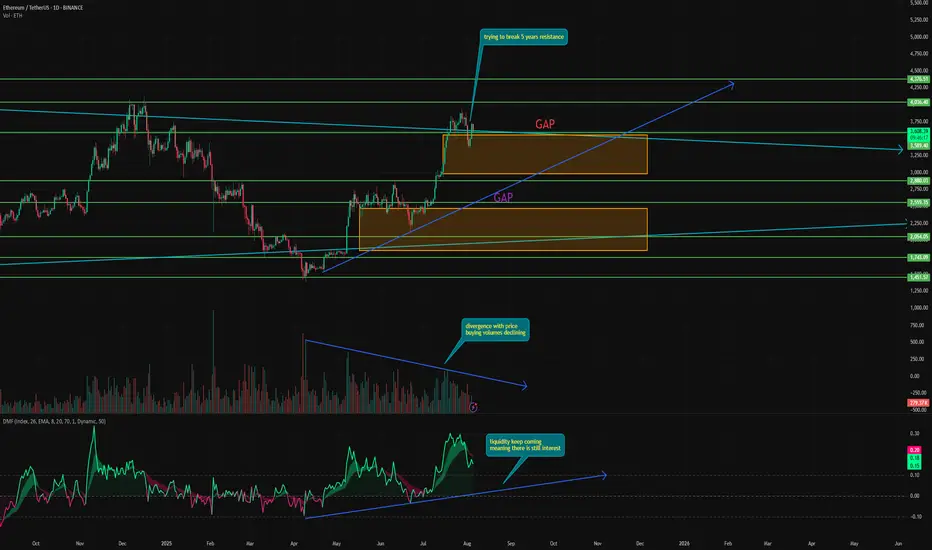
Time to take some profits in ETH⚡️ Hello everyone! Over the past week, the market has been actively correcting, which, ironically for ETH, coincided with reaching the $3,650 level, where its 5-year resistance line is located.
This is obviously a powerful level, which the price already broke through in December last year, but after spending less than a week above it, it went into correction.
If the price can really consolidate above this level, it will open the way for tremendous growth. Even $5,000 will seem like a joke.
⚙️ But is there a real chance of this happening? Let's take a look:
During its growth, ETH moved extremely sharply and powerfully, forming two gaps from below at $3,560–2,987 and $2,483–1,848. As we know, in 99% of cases, gaps close sooner or later. So there is a high probability of a downward movement. In addition, one of the gaps has already partially closed.
Volume - purchase volumes continue to diverge from the price, indicating waning interest in ETH. This often leads to a trend reversal.
Money Flow - Interestingly, liquidity continues to flow into the asset, unlike Bitcoin. And now it is at a fairly high level. In addition, there is harmony with the price.
📌 Conclusion:
Right now, ETH looks strong enough to finally break through resistance and open the way to new heights. However, this will also depend on the overall state of the market.
No matter how strong ETH is, if Bitcoin goes into correction, ETH will go with it.
But if we remove all emotions and thoughts and look at it technically, ETH has reached five-year resistance. And good traders buy on support and sell on resistance.
Have a nice day, everyone!
ETH-----Sell around 3670, target 3600 areaAugust 5th ETH Contract Technical Analysis:
Today, the daily chart closed with a small bullish candlestick pattern, with consecutive bullish candlesticks and prices consolidating at high levels. The accompanying indicator formed a death cross. The price did not break through the previous high on the pullback, so the overall downtrend is still favorable. However, it should be noted that yesterday's pullback interrupted the ongoing downward trend, so this is important to note. The hourly chart showed continued gains during the European and American sessions, while prices came under downward pressure during the Asian morning session. The current candlestick pattern is a series of bearish candlesticks, with the accompanying indicator forming a downward death cross. This suggests a continued upward trend within the next few days, but the strength and impact of the European session remain important to monitor.
Today's ETH Short-Term Contract Trading Strategy:
Sell on pullbacks to the 3670 area, with a stop loss at 3700 and a target at 3600.

Ethereum (ETH): $4000 Incoming | Breakout or Rejection?Ethereum is not showing any remorse to sellers of the coin, and we are almost near the major resistance zone of $4000.
What we are looking for or expecting from here is either to get the proper breakout from this region or a rejection. As of now it is hard to say which one we will get so once we reach that resistance, we are going to look at further market structure development for any more signs.
Swallow Academy

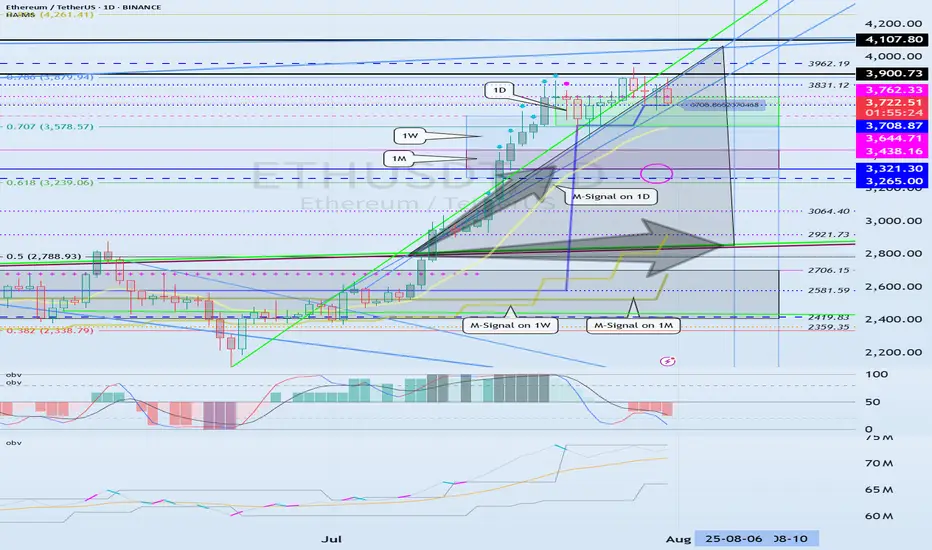
The key point to watch is whether it can rise to 3900.73-4107.80
Hello, traders. Nice to meet you.
If you "Follow," you'll always get the latest information quickly.
Have a great day.
-------------------------------------
(ETHUSDT 1D Chart)
The upward trend continues, with the M-Signal on the 1D chart > M-Signal on the 1W chart > M-Signal on the 1M chart.
Therefore, if the price holds above 3265.0-3321.30, a medium- to long-term uptrend is likely.
Currently, the HA-High ~ DOM(60) range is formed across the 3265.0-3762.33 range on the 1M, 1W, and 1D charts.
Therefore, the key question is whether support is found within the 3265.0-3762.33 range.
-
While the price is trending upward along the short-term trendline, if it falls below the short-term trendline and encounters resistance by falling below the M-Signal indicator on the 1D chart, a decline to the 3265.0-3321.30 range is likely.
ETH's volatility period is expected to last from August 6th to 10th.
The key point to watch is whether it can rise above the 3900.73-4107.80 range after this volatility period.
-
Since the StochRSI indicator has entered an oversold zone, the downside is likely to be limited.
Since the OBV indicator of the Low Line ~ High Line channel remains OBV > OBVEMA, a significant decline is unlikely.
However, since the TC (Trend Check) indicator is below zero, selling pressure is dominant.
Therefore, a decline below 3708.87 could lead to further declines. However, as previously mentioned, the decline is likely to be limited, so a significant decline is not expected.
Once the M-Signal indicator on the 1D chart is encountered, the trend is expected to re-establish itself.
-
Thank you for reading to the end.
I wish you successful trading.
--------------------------------------------------
- This is an explanation of the big picture.
(3-year bull market, 1-year bear market pattern)
I will explain in more detail when the bear market begins.
------------------------------------------------------
Ethereum: Smart Money Reversal After Stop Hunt?In the previous update, we warned that Ethereum might drop lower before any meaningful bounce — especially if it failed to hold the midline of the ascending channel. That scenario played out exactly as anticipated.
🟡 Price action summary:
ETH broke below the midline of the weak ascending channel, hunted the liquidity below recent lows, and tapped into the key bullish order block near $3,490 – $3,520. Price is now reacting to this zone with early signs of a reversal.
📌 Key observation:
Midlines of weak or low-momentum channels often act as liquidity traps in smart money models. Buying at these levels can be extremely risky — especially during corrective or distribution phases.
⸻
📚 Educational Note:
Never enter long positions solely at the midline of a weak ascending channel, especially when there’s a high probability of liquidity sweep below. Smart entries usually occur at order blocks formed after stop hunts.
⸻
🎯 Next steps:
Wait for confirmation (such as internal BOS or FVG closure) before entering longs. The structure suggests a potential move back toward the upper boundary of the channel if this OB holds.
⸻
🔗 Save this analysis and share it with fellow traders.
💬 Thoughts? Drop your view in the comments.

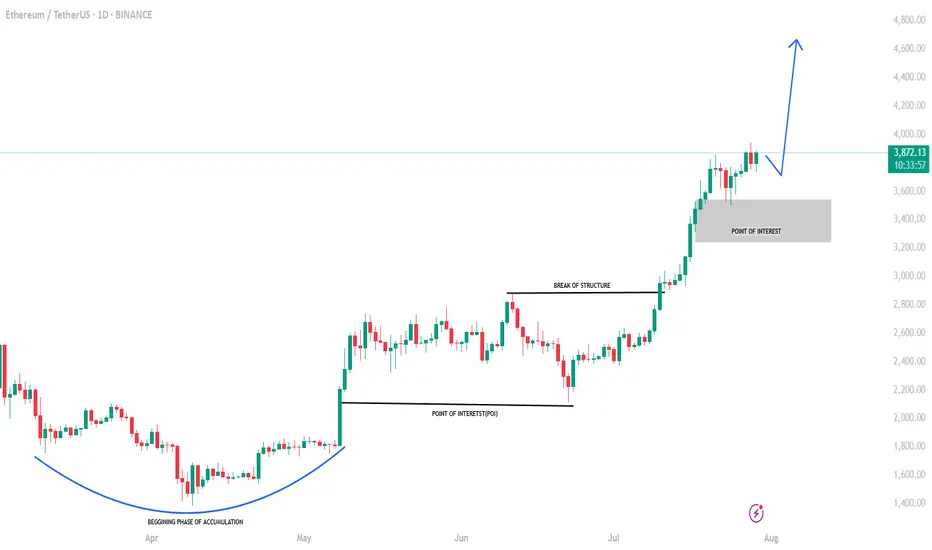
ETHUSDTDISTRIBUTION +ACCUMULITON= RE ACCUMULITON
Accumulation begins and reaccumulation is being completed and the Wyckoff structure is completed
Composite Academy and Analysis
Professor Ramtia Siddiqui
Aram Pizbin Professor
BINANCE:ETHUSDT

ETH Price Weakens: Watching This Strong Demand Zone Closely$ETH/USDT Analysis (12H)
Ethereum has broken below a key support zone, confirming short-term weakness in price structure.
At the same time, the RSI is showing bearish divergence, signaling slowing momentum while the price was making higher highs — a classic early warning of a potential drop.
Now all eyes are on the strong demand zone below. If ETH finds support there, we could see a solid bounce or even a full trend reversal. But if this zone fails, deeper correction may follow.
DYOR, NFA
Thanks for the reading
