ETh more dump to $2100-$2030Just recently hopped into ETH short. Aiming for $2100 to $2030
Market is correcting on the weekly tf and this is a probably area that it might use to create the new HL for continuation back up.
Time sensitive.
Stop: $2235-$2245 area. $2245 is safer a bit lower RR though.
ETHUSDT trade ideas

Pullback and DownHi there!
We have a nice pattern and very clear also. We should take care about BTC movement if we trade ETH or any other ALT coin!
Our main target is very clear ABC Fibonacci extension 161,8 and Fibonacci retracement 61,8 and HH of previous cycle! Sure, under this cluster level is a liquidity zone where you can make new cheap buys :-).
Good luck traders!

ETH Bearish Retest – Heading to $900?Description:
On the weekly chart, ETH has once again failed to break back above the long-term ascending trendline that started in 2020. After losing this trendline support earlier, price is now treating it as resistance — a textbook bearish retest.
The market reaction suggests weakness, and the lack of strong volume on the upside raises concerns about buying momentum. If this structure holds, we might be looking at a broader correction in play.
📉 Key Observations:
• Bearish rejection from the multi-year trendline.
• Structure resembles a lower high formation.
• Weak volume on bounces, showing hesitation from bulls.
🔍 I’m personally watching the $1,000 zone as a potential magnet if downside pressure builds. Some may even expect a retest of the $900 range — not a prediction, just a scenario.
💬 What do you think? Are we headed for a deeper flush or is this just a trap before a breakout? Drop your thoughts ⬇️
#Ethereum #ETH #CryptoWeekly #TechnicalAnalysis #Trendline #BearishSetup

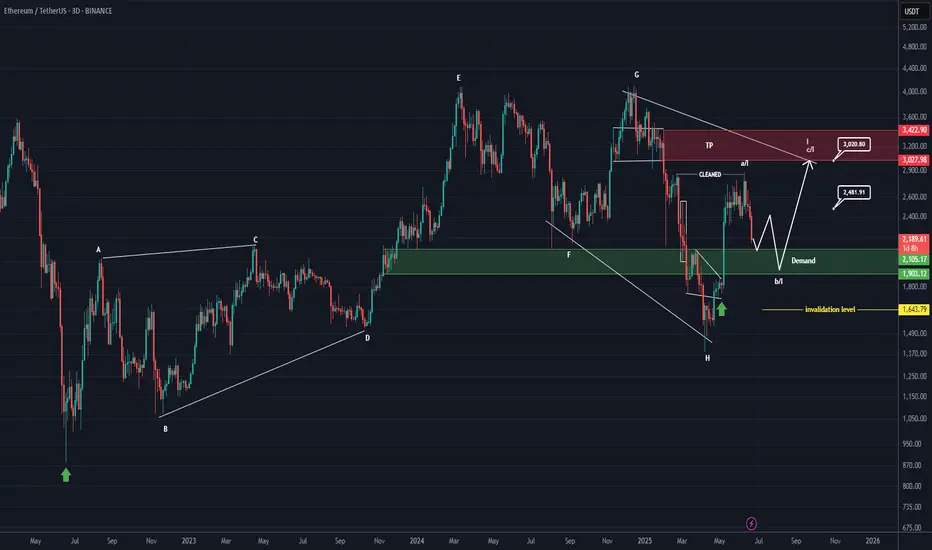
ETHEREUM Analysis (3D)First of all, pay close attention to the timeframe | it's a higher timeframe.
From the point where we placed the green arrow on the chart, Ethereum appears to have entered a bullish phase | specifically, a symmetrical pattern.
It currently seems to be in wave I of this symmetrical structure, which is the final wave. Wave I itself appears to be composed of three parts (ABC). At the moment, Ethereum seems to be in wave b of wave I.
We expect wave b of I to complete within the green zone, after which the price would move into wave c of I.
The price seems inclined to complete wave b of I near the bottom of the green zone.
Targets are marked on the chart.
In the green zone, it’s no longer reasonable to look for Sell/Short positions, especially when the price is approaching the bottom of the green area.
A weekly candle close below the green zone would invalidate this analysis.
For risk management, please don't forget stop loss and capital management
When we reach the first target, save some profit and then change the stop to entry
Comment if you have any questions
Thank You
ETHUSDT LONG POSITION ENTRY: 2582.66
TAKE PROFİT : 2770.95
STOP LOSS : 1/3
Do not use high leverage!
Remember cash management (planning)!
Please follow the stop-loss rule!

ETH/USD Weekly | The Full Breakdown – Structure, Spring, and Set
This is my full Ethereum weekly chart analysis — not just what I think might happen, but a walk-through of everything I’ve mapped and labelled, based on how price has behaved since the 2021 top.
Every structure you see here is there for a reason — from the symmetrical triangle and wedge, to the Wyckoff schematics, Elliott wave flow, Spring, and more. What we’re seeing now, in my opinion, is the end of a three-year macro compression. The move that follows could define the rest of this cycle.
Let me take you through it.
After the all-time high in late 2021, Ethereum entered a structured, controlled decline. Not a crash — but a step-by-step transition through market phases. Price dropped and bottomed into a clear accumulation phase — that’s the first box on this chart, labelled as “Accumulation (cause)”. This is where smart money started taking positions, confirmed by the Spring down to 0 and the base of the move at point 2. From there, price consolidated, gained strength, and then jumped the creek — a clear breakout above the accumulation range, which gave us the confirmation for markup.
The markup phase took us from that Spring up into a five-wave impulsive move, peaking around the distribution zone. You can see it clearly — labelled Distribution, and boxed off between points A, B, C and the final wave 5. This rally failed to make new all-time highs, stalled, and was rejected cleanly. From there, we rolled over and started losing structure — and this is where it gets important.
Right after distribution, we got a breakdown I’ve labelled “Break The Ice”. This wasn’t just another dip. It was the moment we lost all structure from the markup — the line that had held the previous lows snapped, and volume stepped in. This is often the first real signal that we’ve entered the markdown phase. From a Wyckoff perspective, this breakdown is what separates Phase D from the start of a new accumulation cycle. It’s aggressive, deliberate, and clears out late longs — and that’s exactly what it did here.
Following that breakdown, we formed a new falling wedge — drawn from the top of the markdown all the way to the most recent lows. Price was making lower highs and lower lows, but with less aggression and momentum weakening. This wedge sits inside the larger symmetrical triangle, which has been developing ever since the 2021 top. The apex of this triangle, marked around $2,496, is where I believe everything will come to a head. Break that with conviction — and we could start a whole new macro leg.
But before we get there, something happened worth pointing out. That final breakdown inside the wedge? The one that dipped below and quickly reclaimed? That, for me, was the Spring. It’s labelled in yellow as “Spring” under point D. And it matches the Wyckoff schematic almost perfectly. Volume dried up on the move down. RSI and CCI both showed divergence. Then price bounced hard, reclaimed structure, and we’ve held ever since. This doesn’t look like continuation — it looks like a trap.
If that Spring holds, then we’re now in the Sign of Strength (SOS) phase. This is the moment where price reclaims its mid-structure levels, consolidates, and prepares for the breakout. We haven’t broken out yet — but the groundwork is in place.
My Elliott count also lines up. We had a 5-wave impulse from the Spring to the failed rally, followed by an ABC correction. What we may now be seeing is the completion of another Wave 2, setting up for a possible Wave 3 — the strongest wave of the cycle, if confirmed.
Now let’s talk entries. I’ve got my eye on the $2,130–$2,030 region. That’s where I’m placing my DCA bids. It’s the area just above the Spring reclaim zone, where price should react again if we retest. If we lose $1,690, I consider the Spring invalidated and will reassess. That’s my clean risk level.
Break and hold above $2,496, and the breakout is confirmed. That level is not just the wedge and triangle resistance — it’s also the psychological midpoint of this whole macro structure.
Everything’s mapped. Structure is clean. Volume is drying up. Momentum is shifting. And price is compressing right into the apex.
This isn’t a moment to chase. It’s a moment to plan.
If we break out, I’m ready to scale in. If we reject, I’ll be watching the DCA zone and the Spring level closely. Either way, I know what I’m looking for — and I know what invalidates the setup.
Let’s see what price does next.


Ethereum at a Critical Support Zone Ethereum Weekly Analysis – Long-Term Perspective
Ethereum is currently experiencing significant bearish pressure and has dropped into a major support zone on the weekly chart. If this critical support breaks, the next key target would be around $2,055, where the price aligns with a long-term ascending trendline, acting as a possible reversal zone.
However, if ETH manages to defend this area and confirms bullish weekly candle closures, we may see a potential recovery toward:
$2,278 as the first resistance
Followed by $2,435 as the next upside target
📌 All support and resistance levels shown in the chart are key decision zones that traders can use for entries, exits, or managing positions.
🧠 Don’t forget to follow for consistent long-term insights and clean technical setups like this.

Wait for ETHETH faced rejection at the weekly resistance near $2,700.
Price is likely to retest the current weekly support around the $2,100 zone.
Patience is key—wait for ETH to reach this support area before considering entry.
Disclaimer:
This analysis is based on my personnal views and is not a financial advice. Risk is under your control.

ETH NEW UPDATE (8H)This analysis is an update of the analysis you see in the "Related publications" section
After the pump and hitting the red zone, it got rejected.
It's better not to open a short position on Ethereum, as its dominance appears bullish | which means it might be resilient against a potential drop.
The closing of a daily candle above the invalidation level will invalidate this analysis.
For risk management, please don't forget stop loss and capital management
Comment if you have any questions
Thank You


Your Trading System Isn't the Problem. Your Discipline Is.📘 Your Trading System Isn't the Problem. Your Discipline Is.
Hard truth:
Your endless search for a new system is a smokescreen.
The best system in the world can't save you from poor discipline.
Here's why discipline matters more than your strategy:
You quit your system after a few losses, never allowing it to prove its value.
You deviate from your rules when emotions run high—wrecking consistency.
You're focused on shiny objects instead of sharpening the knife you already have.
🎯 The solution?
Commit to discipline. Track your adherence rigorously. Measure your success by consistency, not immediate outcomes.
TrendGo’s power isn’t just in clear signals—it's in enabling disciplined action.
🔍 Stop blaming your tools. Own your discipline.

ETHUSDT UPDATE 1DETH slipped below channel support (~ 2.45k). Weekend volume is thin—need 2 daily closes (Mon/Tue) to confirm. Hold-below sets sights on 2.2–2.0k (Fib 61-78 %). Reclaim 2.5-2.6k invalidates.

Ethereum – 1D timeframe overview with Initiative AnalysisHey traders and investors!
The price has reached the lower boundary of the range. There is no volume spike.
I expect a further decline toward 2184 and 2100. The 2100 level is a contextual area to look for buying patterns.
As part of a correction, the price could potentially drop to 1800. Monitoring.
This analysis is based on the Initiative Analysis concept (IA).
Wishing you profitable trades!

#Ethereum Update!!CRYPTOCAP:ETH has broken below the $2,308 resistance zone and is now trading lower.
Price is approaching a key demand area around $2,132–$2,000, where we’ve seen strong buyer reactions in the past.
IMO, if bulls step up and defend this zone, we could see a recovery bounce aiming for $2,526, the next major resistance ahead.
I’ll keep you updated as things develop.
If you find my updates helpful, don’t forget to like and follow for more! DYOR, NFA

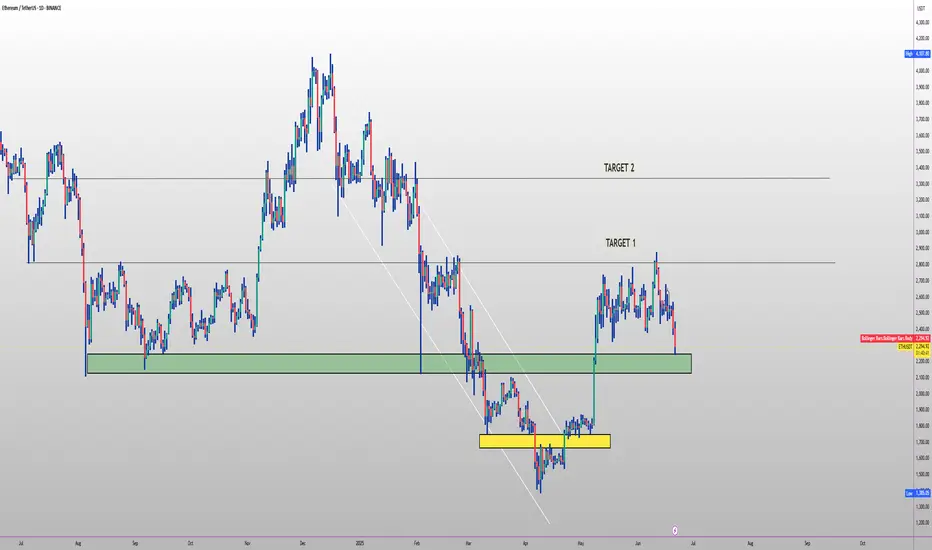
ETH PLAN FOR 2025🔥 CRYPTOCAP:ETH long setup (1D) 🚀
✅ Entry Zone: $2 280 – $2200 (multi-month demand)
🎯 Targets
• TP-1: $3 000 (macro range mid)
• TP-2: $3 400 (2024 breakdown line)
⛔ Stop-Loss
Daily close < $2050
📊 Thesis
• SEC-approved spot-ETH ETFs now trade on NYSE/Nasdaq 🏛️
• >35 M ETH staked (≈29 % supply) tightening float
• Dencun’s EIP-4844 slashed L2 fees ~90 % ⚡
• EigenLayer restaking TVL > $20 B 📈
• Pectra upgrade brings account abstraction & wallet UX overhaul
• ETH supply net-deflationary since EIP-1559 🔥
• Danksharding next → massive roll-up throughput
ETHUSDT – Trade Recap & Daily Bias for June 21Trade Recap (June 20):
I. First thing I did was mark out a DOL on the daily — price was hovering near a swing low, and I started noticing trend-side liquidity building up on the lower timeframes.
So my directional bias for today was short.
II. I marked the daily open.
III. With a short bias in mind, I waited for a Turtle Soup setup right above the daily open.
IV. The equal highs above were clean and obvious — textbook liquidity.
V. Once that liquidity was swept, I dropped to the M15 to watch how price reacted — waited for a clean displacement away from that zone before getting involved.
Daily Bias (June 21):
Still leaning short. We’re pretty close to a weekly FVG, which might act as a magnet.
If price forms liquidity during the day and takes it out in-session, I’ll look to short again.
Bread and Butter & Turtle Soup

Should i start panicking ?
Man, I really wish I didn’t look at this chart right before bed—this thing looks like it’s straight out of a horror movie.
From what I can tell, we’ve got a monthly bearish inverted FVG lining up perfectly with daily resistance. There’s also a broken trendline on the daily, and right after it snapped, we got that sharp V-shape move, which looks like a classic retest—either of the broken support or the trendline that flipped to resistance.
To add to the bearish vibes, there’s a pretty obvious divergence on the daily chart. That’s not exactly comforting.
Honestly, I’m struggling to find anything bullish here. The only tiny hope is that the price doesn’t break below that daily trendline (the one marked in blue). If it holds, maybe—just maybe—we can reclaim the broken main trendline and turn that resistance back into support.
If anyone out there is deep into crypto and has thoughts on how to approach this kind of setup, I’d really appreciate your take. Could use another perspective right about now.

Long trade
15
min overview
🟢 Trade Journal Entry – Buyside Trade
📍 Pair: ETHUSDT
📅 Date: Saturday, June 21, 2025
🕒 Time: 2:00 AM (Asian Session AM)
⏱ Time Frame: 15 Minutes
📈 Direction: Buyside
📊 Trade Breakdown:
Entry Price 2422.81
Profit Level 2474.60 (+2.14%)
Stop Loss 2415.04 (−0.32%)
Risk-Reward
Ratio 6.67 1
🧠 Context / Trade Notes:
BOS 5th June – 4HR Low Wick:
Break of structure observed on June 5th from a 4-hour low wick.
Observing the current NY session sweep of the liquidity from the London low wick signalled Sellside exhaustion.
Order Block & Retest:
A bullish OB formed on a prior swing, with a clean mitigation of price (Fri, 20th price range) and BOS, confirming buy-side interest.
5min TF Observation - entry:
Narrative:
Utilising DRT levels (coined by Ali Khan) to navigate the range and unfolding price action.
Target imbalance zone 1Hr.


ETH/USDT 4H Technical Analysis UpdateChart Insights:
ETH is holding the lower trendline support (~$2,430), which indicates a potential reversal zone.
The RSI is hovering around 39, which indicates oversold territory, suggesting that buyers may step in soon.
Expected Move:
The chart predicts a strong move upwards towards the $2,800–2,900 zone (blue arrow), which aligns with the top range boundary.
Trade Plan:
Buy Zone: Near the lower trendline ($2,430–2,450)
Stop Loss: Just below the trendline ($2,400)
Target: Near the upper range boundary (~$2,800–2,900)
Stay alert!

ETH Distribution pt.2It seems like the distribution model i was watching is about to get finished. I will wait for more confirmations in case it wants to go higher or deviate one more time.
