ETHUSDT: Elliot Analysis You can see the Ethereum chart in the long term, which indicates the end of the fourth wave and the beginning of the fifth wave, so with capital management, you can have a good investment.
ETHUSDT trade ideas

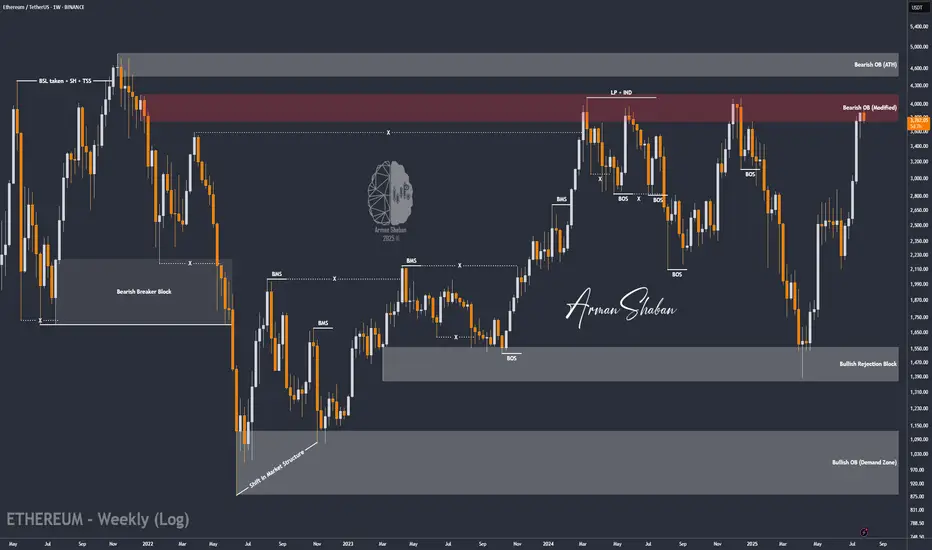
ETH/USDT | at a Crossroads – Hold Above $3440 or Sharp Fall!By analyzing the Ethereum chart on the weekly timeframe, we can see that after reaching $3940 and touching the key supply zone, ETH entered a slight correction and is currently trading around $3756. The key question now is whether it can hold above $3440 by the end of the week and push past $4000. If it does, we can expect another bullish leg toward $4100 and $4470. However, if the $3440 support fails, a sharp decline may follow — so this level is critical.
Please support me with your likes and comments to motivate me to share more analysis with you and share your opinion about the possible trend of this chart with me !
Best Regards , Arman Shaban
ETH Targets $12,500 With Potential Ascending Triangle BreakoutThis post updates my earlier post and revises the previous prediction upwards.
Pattern
As we can see on the 3-Month ETH/USD log chart, ETH price compresses within an Ascending Triangle formed by trendlines set at the candle bodies (not wicks). The upper trendline is almost perfectly horizontal and sits at $3600. ETH is currently attempting breakout, but would need a 3-Month close (end of Q3) above the upper trendline at $3600 to confirm the new uptrend.
Target Price
As someone new to Technical Analysis, my original chart used the linear layout, which I have come to learn is less well suited for charting patterns on long timeframes. The updated chart here shows a much more reliable pattern, but also suggests a much higher, yet still conservative, price target of $12,500. I am unsure of the timeline for which ETH could achieve this price, but I assume it would occur this cycle, which is consistent with other bullish ETH predictions, such as Tom Lee's recent call for $10k - 15k.
Method
Ascending Triangles are bullish continuation patterns. The breakout price target is obtained by measuring the percentage distance from the widest part of the triangle and projecting that same percentage above the upper trendline.
Please feel free to offer your criticisms and observations. This is not financial advice.

ETHUSDT - SCalp your day!Small scalps, extreme targets on yellow mid targets on the green, Keep in mind that a temp spike can happen for a fall, to a great extent, maybe?

ETHUSDT.PIf you look at the chart, you will notice an uptrend that has somewhat lost its strength and we may not be able to hit higher highs like the next strength in the next move.
Support: 3.660 - 3.590 - 3.160
Resistance: 3.900 - 4.260
Entry: 3.700
SL: 3.500
TP: 4.240
Please control risk management.⚠️

ETH LongFollowing a significant decline, the asset will take support and bounce back from this point.
Disclaimer: This is not financial advice.
This algorithm provides highly precise buy and sell signals with alerts:

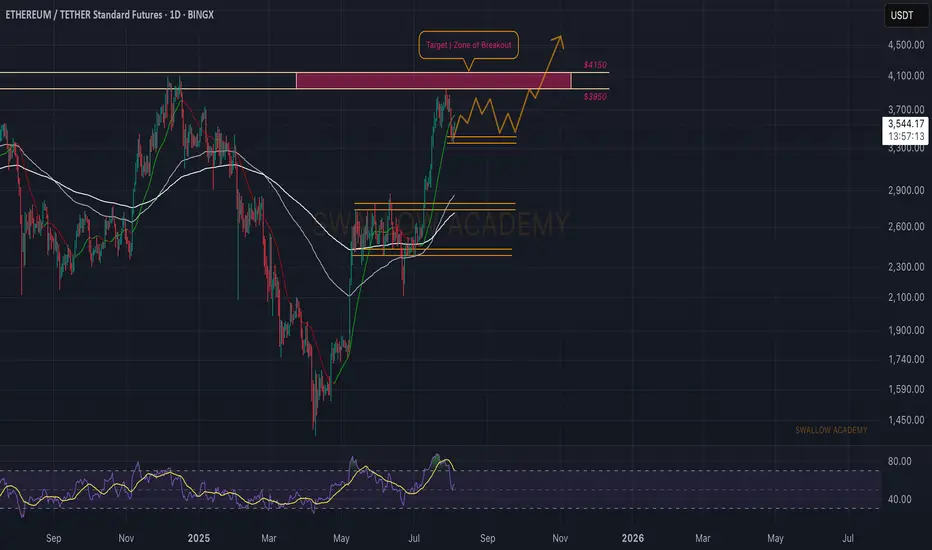
Ethereum (ETH): Zone of Rejection Turning Into Zone of BreakoutSince last time, we were looking for a zone of rejection, which happened as well, where price had a smaller pullback, and now upon the start of a new week, we might be seeing the start of recovery as well.
Which means, as long as we are above the $3,350 zone (which is the local low area), we are bullish; if we break that zone, this would be the ideal area for a short!
Swallow Academy
Crypto Exploded, I Missed it, What should I Buy Now?!The market suddenly exploded… green candles after green candles. Yesterday, you were hesitating to look at the chart, today everyone on social media is posting their profits. So what now? Did you miss out? It’s not too late. The main question now is: What should I buy to catch up?
If you read this analysis till the end, not only will you learn some practical TradingView tools, but you’ll also gain insight into how to act like a professional trader after big pumps not like a reactive follower.
Hello✌
Spend 3 minutes ⏰ reading this educational material.
🎯 Analytical Insight on Ethereum:
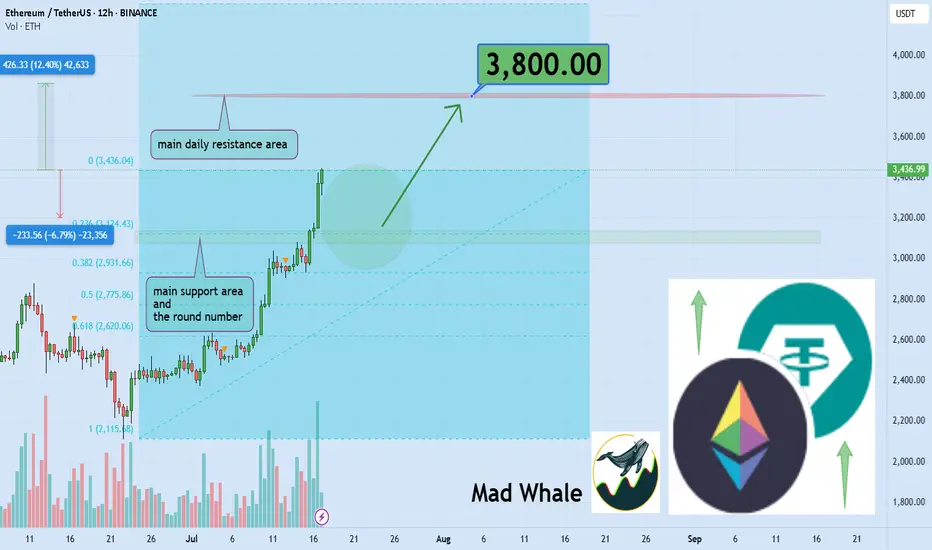
BINANCE:ETHUSDT is currently holding near the daily support and the key psychological level at $3,000, which also matches the 0.23 Fibonacci retracement. A potential upside of at least 12% is expected, targeting $3,800 close to a major daily resistance zone. Keep an eye on these levels for possible trade setups 📊⚡.
Now , let's dive into the educational section,
🧠 FOMO: The Enemy That Devours Your Profits
If you feel like you missed the boat now, don’t panic. Everyone has felt that, even top traders. It’s called "FOMO." Jumping into the market without analysis and just on emotions can burn you badly. Instead of regretting, sit calmly, analyze, and wait for the right setup. The market always offers new chances you just need to know how to hunt them.
🔍 What to Buy Now? Logic Over Emotion
There are three types of coins still offering opportunity:
Coins that haven’t broken their previous highs yet
Like a compressed spring, they can jump higher with a small push.
Altcoins lagging behind Bitcoin
When BTC pumps, alts usually follow afterward.
Coins with strong upcoming fundamental news
Networks with upcoming updates or special events that generate excitement.
Don’t forget on-chain analysis. See where money is flowing.
🌟 Look for New Stars and Strong, Established Coins
After a pump, there are two ways to hunt:
🔹 New Stars
Altcoins that are just coming out of their correction phase and haven’t had their main pump yet.
🔸 Strong and Established Coins
Assets that have shown resilience, have strong fundamentals, and tend to pump again after corrections.
Balance your portfolio with both to lower risk and maximize profit potential.
🧰 TradingView Tools to Hunt Opportunities After a Pump
To avoid missing out in the second phase of the market explosion, you must use TradingView’s analytical tools correctly. Here are three key tools you should know right now:
Volume Profile
Helps you understand where most trading volume occurred. Smart money usually buys and sells heavily at these points.
RSI (Relative Strength Index)
Tells you when the market is overbought. When it drops back to the 40 to 50 range after a peak, that could be a good re-entry point.
Fibonacci Retracement
A tool to find attractive correction zones after a pump. Especially useful if you combine multiple timeframes.
⚖️ Stop Loss Is Necessary, But Take Profit Is More Important
Always place a stop loss in the market. But many forget to set a take profit in bullish markets.
Having a take profit level ensures you lock in gains when the market hits your target and avoid greed.
Key point: Even if you expect huge pumps, take some profit on time to avoid losing it all during corrections.
🪙 The Next Pump Is Just Around the Corner
Instead of jumping into a pump mid-way, focus on spotting setups just forming. Watch for consolidation candles, rising volume, and reactions to classic zones. That’s where you can enter professionally, even before everyone knows what’s coming.
🛠 Game Plan for the Trader Who Fell Behind
Pick three coins that haven’t pumped yet
Test the tools mentioned on them
Set alerts for logical entry signals
Enter with risk management, not emotion
Most importantly analyze, don’t just follow
📌 Summary and Final Advice
If you missed the market pump, don’t worry; crypto markets always offer opportunities you just need to be prepared. A combination of analysis, professional tools, and smart choices between new and established assets can help you not only catch the next pump but ride it ahead of everyone else.
✨ Need a little love!
We pour love into every post your support keeps us inspired! 💛 Don’t be shy, we’d love to hear from you on comments. Big thanks , Mad Whale 🐋
📜Please make sure to do your own research before investing, and review the disclaimer provided at the end of each post.
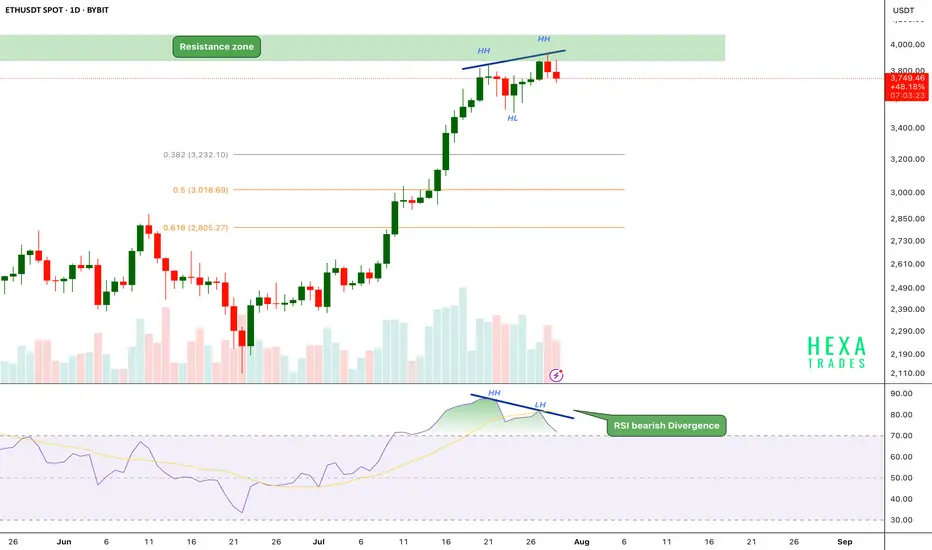
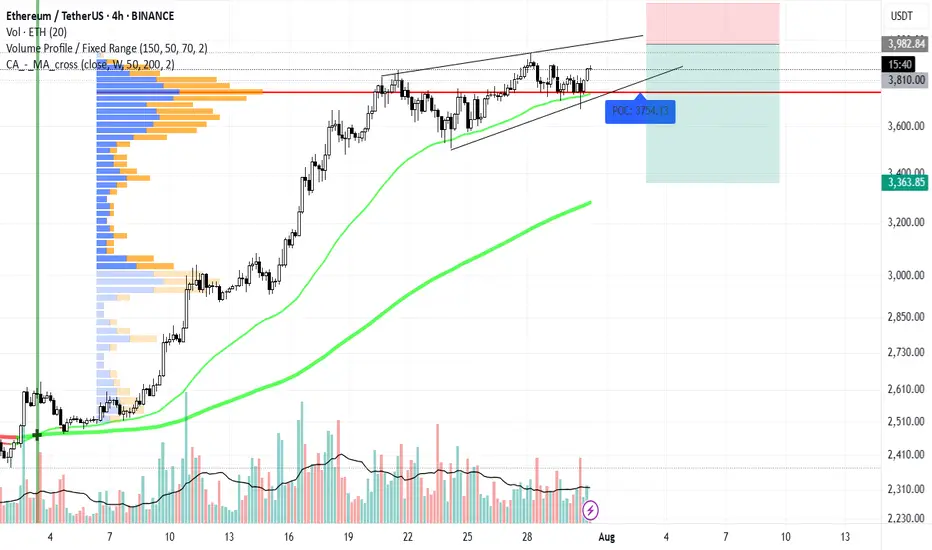
ETH Bearish Divergence!CRYPTOCAP:ETH has been in a strong uptrend, printing consistent higher highs (HH) and higher lows (HL). However, on the daily chart, the price has now reached a critical resistance zone near the $3,800–$4,000 range.
Key Points:
🔸 Bearish RSI Divergence
While price action has formed a new higher high, the RSI has printed a lower high, signaling bearish divergence.
This indicates that upward momentum is weakening even as price attempts to push higher — a common early warning of a possible short-term reversal.
🔸 Fibonacci Retracement Levels
The fib 0.382 at $3240 and 0.5 and 0.618 retracement levels are sitting around $3,000 and $2,800, respectively, potential targets if a correction follows.
🔸 Volume Profile
Volume is gradually declining as price approaches resistance, suggesting buyer exhaustion.
If the price breaks above the $4,000 psychological resistance, we could see a strong bullish move.
ETH is facing strong resistance after a powerful rally, with RSI bearish divergence and weakening momentum hinting at a possible short-term pullback. We should be cautious entering fresh longs here without confirmation.
Support: $3,200, $3,000, and $2,800
Cheers
Hexa
BINANCE:ETHUSDT BITSTAMP:ETHUSD
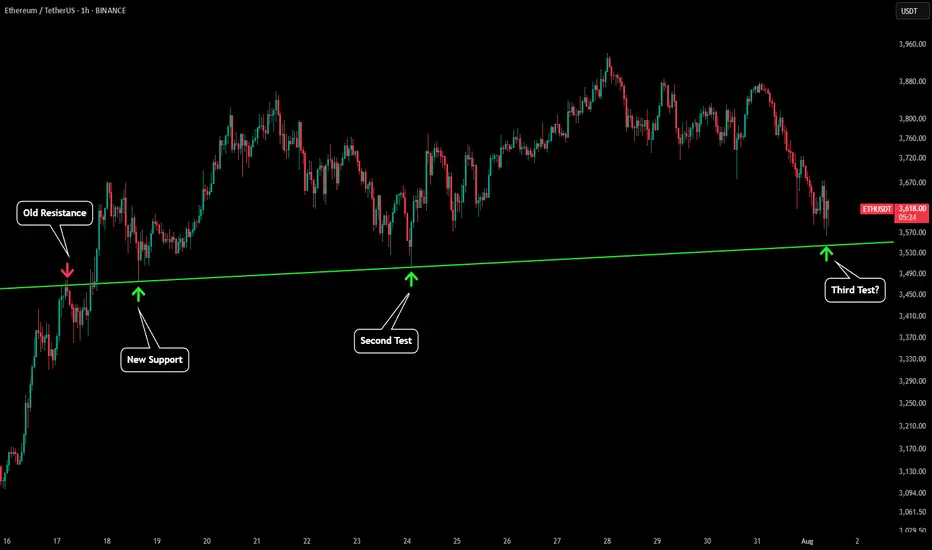
ETH - Still Respecting Important LinesPlease refer to our previous post:
Eth looks to be going for a third test of our green trendline. This would price around $3,550 which is also the 1D 21 MA. Therefore continuing to close daily candles above that price level will keep the uptrend in tact.
Can Ethereum Hold This Crucial Level and Continue its Ascent?Can Ethereum Hold This Crucial Level and Continue its Ascent?
ETHUSDT presents a clear bullish structure on the daily timeframe, having recently broken out of a multi-month consolidation pattern. The market has encountered a significant resistance zone but has since pulled back to test a key support level. The price action is currently defined by a series of well-established support and resistance zones, along with a crucial rising trendline, which together will determine the asset's next major move.
1. The Bullish Impetus & Key Resistance:
All-Time High Resistance ($3900 to $4000): This upper red zone represents a significant supply area where sellers have historically entered the market, preventing a new all-time high. The recent rally encountered resistance in this zone, leading to the current pullback.
The Rally from the Consolidation: Following a period of consolidation, Ethereum staged a powerful rally, breaking through several resistance levels on its way to re-testing the all-time high zone.
2. The Immediate Support Zone:
First Support ($3300 to $3500): The current price is engaging with this green zone. This level has been a key area of previous support and resistance, and its ability to hold as support will be a critical test for the bulls. A successful defense of this zone would be a strong signal for a continuation of the upward momentum.
3. The Crucial Level & Trendline Confluence:
Crucial Level ($2700 to $2900): Below the immediate support lies a more significant support confluence zone, marked by the blue box and a rising trendline. This "Crucial Level" is a major demand zone that has previously served as a pivot point in the market. The confluence with the rising trendline, which has been providing support since late March, makes this a highly significant area.
0.5 Fibonacci Retracement: This area also aligns with the 0.5 Fibonacci retracement level of the recent major move, reinforcing its technical importance. A break below this zone would suggest a significant shift in market sentiment.
4. The Ultimate Support:
Long-term Support ($2000 to $2200): This lower green zone represents a robust long-term support level. If the "Crucial Level" were to fail, this area would be the next major target for a deeper correction. The 0.618 Fibonacci level is also situated within this zone, further highlighting its significance as a potential bounce area.
Conclusion:
ETHUSDT is currently re-testing its first major support zone after a rally toward all-time highs. The ability of the bulls to defend the "$3300 to $3500" level will be crucial for a potential re-test of the "$3900 to $4000" resistance. A failure to hold this support would likely lead to a retracement toward the even more critical "$2700 to $2900" level. The integrity of the rising trendline and the "Crucial Level" will be the ultimate determinant of whether the long-term bullish trend remains intact.
Disclaimer:
The information provided in this chart is for educational and informational purposes only and should not be considered as investment advice. Trading and investing involve substantial risk and are not suitable for every investor. You should carefully consider your financial situation and consult with a financial advisor before making any investment decisions. The creator of this chart does not guarantee any specific outcome or profit and is not responsible for any losses incurred as a result of using this information. Past performance is not indicative of future results. Use this information at your own risk. This chart has been created for my own improvement in Trading and Investment Analysis. Please do your own analysis before any investments.

ETH/USDT 15m SETUP.ETH/USDT 15m Setup 🚀
Price is approaching a clean POI (Order Block + Imbalance zone).
Expect a short-term dip into the zone followed by a bullish reaction.
📌 Trade Idea:
Wait for price to tap the POI
Look for bullish confirmation
Target upside continuation after liquidity grab & structure shift
High probability long setup incoming!

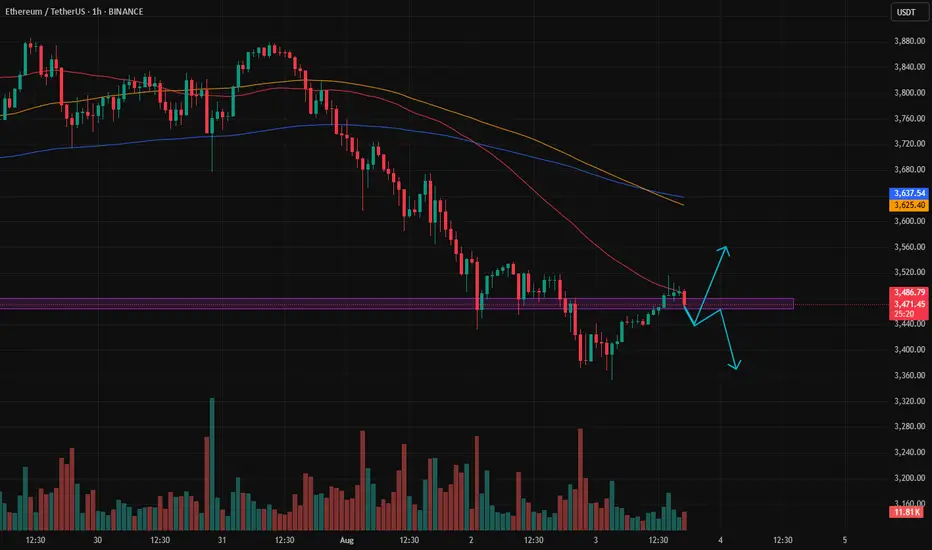
Patience to identify the market trendBased on the previous analysis, after hitting the sell target, the price made an upward correction.
Right now, it’s unclear whether we’re seeing the beginning of a trend reversal to the upside, or if the price is going to drop back below the zone, giving us another short opportunity.
If it does drop again, there’s a possibility it could fall as far as 3000.
We need to be patient and let the market show its hand — then we can respond accordingly.
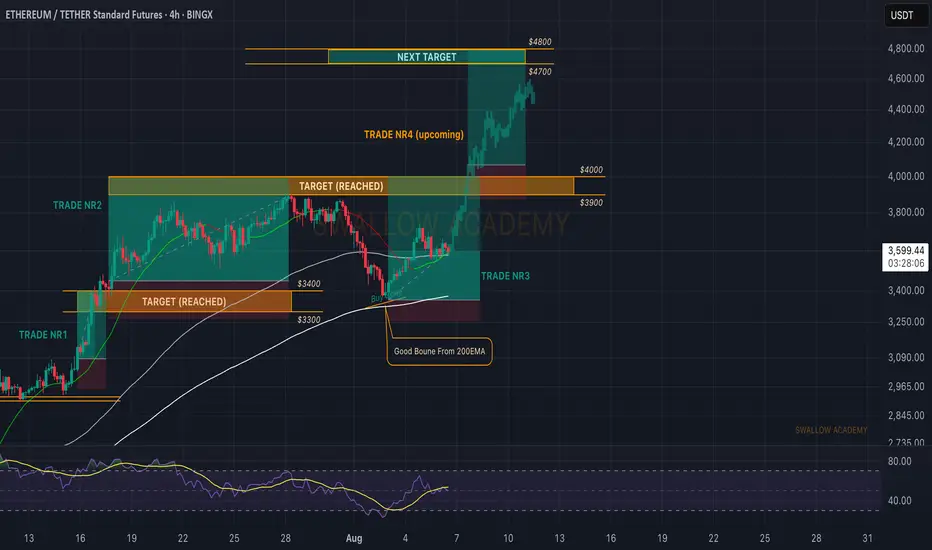
Ethereum (ETH): Seeing Struggle But Nothing Serious | Bullish AFETH still looks bullish to us, with the price staying above the local 200EMA, where last time we had a decent bounce from it.
Now, as many remember and know, we are bullish on ETH only due to 1 big reason: the liquidity of BTC has to go somewhere, and as investors have already had their fun (most of it, at least) with BTC, now they need to relocate their money and ETH is the next step.
$4000 is still our target (once again, as we already reached it once basically), and the current zone seems like a good bounce area with the 100 EMA and the middle line of the BB sitting there, in addition to lots of liquidity being distributed here (based on the order book we use)!
Swallow Academy
ETH ready for a Pullback.... As we can see, BINANCE:ETHUSD is forming a wedge pattern and may drop to $3,300. We're in a bullish trend, so shorting ETH could be risky—please be cautious !
Ethereum at \$3,500 — or not?As we can see, Ethereum was moving within a channel, but toward the end, it could only reach the midline of the channel before getting rejected.
This could be a signal for a drop toward the \$3,500 area.
Otherwise, it might be a fake move, followed by a return into the channel and a move back toward the channel’s midline.
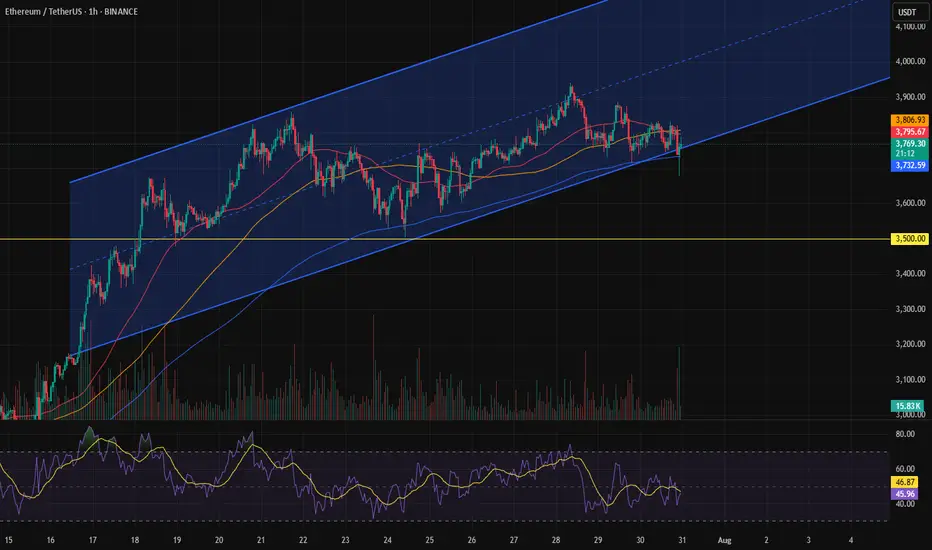
ETH | Ethereum Game Plan - Swing Long IdeaETH | Ethereum Game Plan - Swing Long Idea
📊 Market Sentiment
Market sentiment remains bullish, supported by expectations of a 0.25% rate cut at the upcoming FOMC meeting. The weakening USD and rising risk appetite across global markets are favoring crypto assets in particular.
📈 Technical Analysis
Price swept the range low (Weekly Fair Value Gap), resulting in a deviation.
It then aggressively reclaimed higher levels and closed above key resistance.
A 12H demand zone was formed during this move.
We’re now seeing a retracement towards that 12H demand zone.
📌 Game Plan
I’m looking for price to hit the 12H demand zone at $3,530 and show a strong reaction.
This level is also below the 0.5 Fibonacci retracement, placing it in the discount area — an ideal entry zone for me.
🎯 Setup Trigger
After price taps the demand zone, I want to see a 1H–4H bullish break of structure to confirm the reversal before entering.
📋 Trade Management
Stoploss: Below 1H–4H swing low
Targets:
• TP1: $3,872
• TP2: $4,090
I’ll trail my stop to lock in profits aggressively as price moves in my favor.
💬 Like, follow, and comment if this breakdown supports your trading!
More setups and market insights coming soon — stay connected!

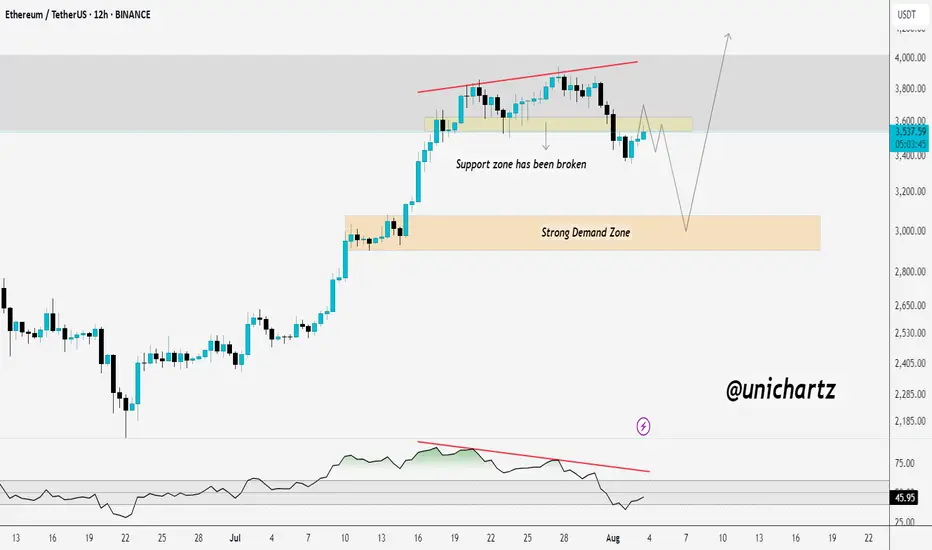
Breakdown Confirmed? ETH Could Drag Alts LowerCRYPTOCAP:ETH support zone around $3,560 has been broken, and current price action appears to be a retest of the breakdown. If ETH fails to reclaim this level, we could see further downside toward the strong demand zone near $3,000.
The RSI bearish divergence also adds to the bearish bias. If this retest fails, altcoins may face deeper corrections, as ETH often leads the market.
DYOR, NFA
Ethereum at a Critical Crossroad: Will $4,000 Finally Break ?Ethereum is once again approaching the psychologically significant $4,000 resistance level, a high-timeframe barrier that has rejected price on multiple occasions. As the second-largest cryptocurrency by market cap pushes higher, traders are closely watching for signs of a breakout—or another range-bound rejection.
Ethereum has entered a decisive phase, with price action now testing the upper boundary of a long-standing trading range. After multiple failed attempts to breach the $4,000 mark, ETH is consolidating just below this level, creating an environment filled with both opportunity and risk. Whether Ethereum can break through or gets rejected again will shape its mid- to long-term outlook.
Key Technical Points:
- Major Resistance at $4,000: A psychologically important level and long-time price cap on high timeframes
- Defined Trading Range: ETH has remained range-bound between $1,300 and $4,000 for an extended period
- Critical Candle Closes Needed: Breakout requires strong daily or weekly closes above $4,000 to confirm
Ethereum’s price is hovering just under the $4,000 resistance zone, which has acted as a ceiling for price action since early 2022. From a high time frame perspective, ETH has been range-bound, trading between $1,300 as the range low and $4,000 as the range high. Each visit to this upper boundary has led to a rejection and a subsequent rotation back toward mid-range or lower levels.
Now, with momentum building and bullish sentiment returning across the crypto market, Ethereum finds itself at another pivotal moment. The key technical requirement for a confirmed breakout will be a decisive daily or weekly close above the $4,000 level. Without this confirmation, any temporary push above the resistance could result in a fakeout and trap late long entries.
Volume behavior around this zone remains mixed. While there is some bullish buildup in recent sessions, there has not yet been a significant influx in volume to confirm conviction from buyers. This aligns with the historical pattern of Ethereum trading at resistance before eventually pulling back, suggesting caution is still warranted.
However, should ETH close decisively above $4,000 and turn this level into support, it would mark the first major break of this range since its inception. This would likely trigger a wave of bullish momentum, possibly sending Ethereum to new yearly highs, with $4,500–$5,000 being the next logical resistance zones based on historical price pivots and Fibonacci extensions.
What to Expect in the Coming Price Action
Ethereum’s price action is currently neutral-bullish but hinges entirely on its interaction with the $4,000 resistance. A confirmed breakout could usher in a powerful rally toward new highs, while another rejection would likely continue the long-standing range between $1,300 and $4,000. Until a decisive move occurs, traders should remain cautious and reactive rather than overly anticipatory.

ETHUSDTPossible short on ETH, as we know this might be a news dump that caused this blood in the market and might recover very soon, but we broke a key support level, this is the 4HR chart and we will have a better idea what's on the table when weekly close.

#eth idea of short im already in it dyoreth/usd idea of short im already in it DYOR
wht im seeing eth give potentially much gains in this quarter
so its time to fill the remaining below and fullfill them
well im not financial advisor but here u can see to other dimention of digital silver


Flat, Quiet… and Full of Clues .Most traders only see the middle.
The acceleration. The “trend”. The movement.
But that’s just one-third of the story.
If you really want to understand the market’s rhythm,
you need to study how moves begin, evolve, and die.
Let’s break down the 3 key phases every market goes through —
again, and again, and again.
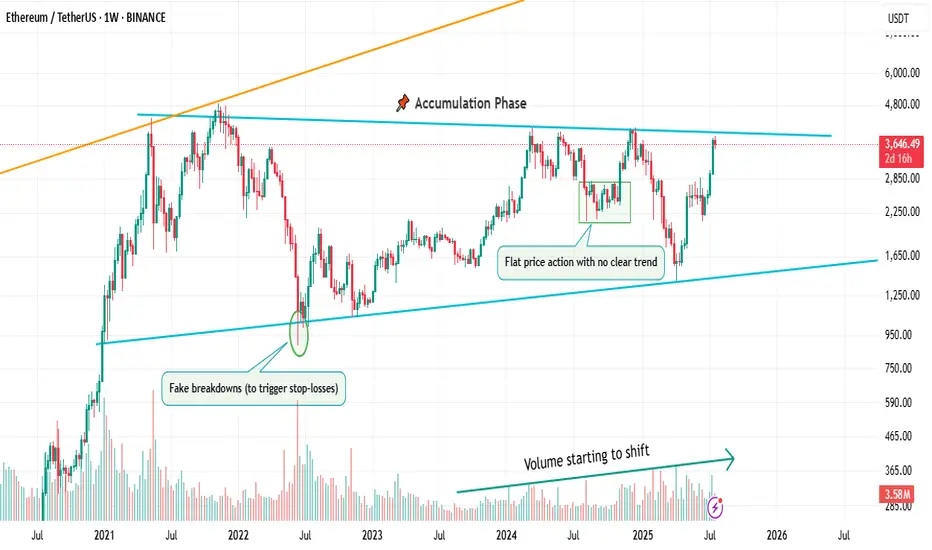
📌 1. Accumulation Phase
This is the part no one talks about.
Why? Because it’s boring. Choppy. Range-bound. Confusing.
Most traders get shaken out here.
But smart money? They’re quietly buying.
You’ll often see:
Flat price action with no clear trend
Fake breakdowns (to trigger stop-losses)
Volume starting to shift
Long wicks — both directions
This phase is a test of patience, not prediction.
And if you learn to read it well, you’ll start catching moves before they go parabolic.
🚀 2. Markup / Acceleration Phase
Here’s where everyone wakes up.
Momentum kicks in.
News gets bullish.
Breakouts start working.
Pullbacks are shallow.
And suddenly, everyone’s calling it a bull market.
But don’t be fooled.
This is not where smart money enters — this is where they ride the wave they already created.
Learn to:
Ride trends, not chase them
Add on pullbacks
Avoid FOMO entries
This is the fastest and most emotional part of the cycle — which means it rewards discipline, not excitement.
🧯 3. Distribution Phase
The party’s still on… but the hosts are quietly leaving.
Price starts to stall.
Breakouts stop working.
Volume gets heavy at the top.
And the same excitement that brought everyone in?
It’s now being used to sell into.
Distribution is sneaky.
It’s not an obvious top.
It’s a process — just like accumulation.
You’ll often see:
Lower highs forming quietly
False breakouts to trap buyers
Increasing volatility
Bullish news… with no follow-through
If you’re not paying attention, you’ll keep buying strength —
right before the rug gets pulled.
So what’s the lesson here?
Markets don’t just “go up or down.”
They prepare, move, then exhaust.
And if you learn to spot these transitions —
you’ll stop reacting late
and start positioning early.
That’s the real edge.
currently we are on the accumulation phase so in this idea I tried to show you the real story behind it and as well talk about the two others to beware of them also in the right moment I will talk about them , but for now let's focous on the current phase because we want to be part of the smart money and enjoy the next phase which is 🚀Markup / Acceleration Phase .
—
🧠 Save this post.
🔁 Revisit it when you’re confused.
📊 Because the chart isn’t random — it’s just cycling
And also remember our golden rule :
🐺 Discipline is rarely enjoyable , but almost always profitable. 🐺
🐺 KIU_COIN 🐺