ETHUSDT trade ideas

ETH showing strength is a good sign for alts.ETH flagging out here is a good sign of a healthy exchange of hands before a continuation. However, the bearish thesis should be considered, there is a volume gap below that defines an imbalance in price. A drop to $1.8k is very possible.
Full TA: Link in the BIO

ETH 4H Setup – Double Tap Reversal + Fib TargetsEthereum has printed a double bottom wick rejection just above the 2,468 level and is now attempting a breakout above the local range high. Price has reclaimed structure, indicating potential momentum toward key fib resistances.
Key Technical Zones:
Support Zone: 2,468 – local double bottom (0% fib)
Breakout Level: 2,544 (0.236 fib)
Targets:
TP1: 2,590
TP2: 2,628
TP3: 2,666 (0.618 fib / likely exhaustion zone)
Scenario Outlook:
🟩 Bullish Path:
Strong rejection from 2,468 confirms demand
Push through 2,544 unlocks path to mid 2,600s
Trend continues if macro holds above 2,500
🟥 Bearish Reversal:
Rejection near 2,590–2,666
Bearish engulfing back below 2,507 invalidates this long setup
Could revisit 2,468 and break to 2,440s
Play Idea:
Entry: Reclaim 2,544 with confirmation
SL: Below 2,496
TP1: 2,590
TP2: 2,628
TP3: 2,666
📌 “ETH bulls defend the low — the battle now shifts to mid-range fib control.”

The wick was the test.Ethereum just kissed the 1.0 fib at $2475.33, tapping into a local demand pocket. That sweep cleared weak longs and set up a cleaner drive back into inefficiency.
What’s happening?
→ ETH is targeting the 1H Fair Value Gap (FVG) around $2512–$2522.
→ $2500 zone = critical reaction level.
→ Volume profile confirms buyer interest above $2480.
Entry Zone: $2480–$2490
SL: Below $2475 swing low
TP1: $2512.75
TP2: $2550.14 (liquidity sweep)
Bias: Bullish while above $2475
Why it matters:
ETH rejected the lows and reversed with structure + timing.
If it reclaims the FVG → it reclaims the narrative.

ETH/USD long | 15m intradaytaking a long from this area for a short term day trade. Price is losing bearish momentum near 2480 in an inverse head and shoulders pattern (15m) and diverging on the RSI. I believe we retest 2550

Current ETH RangeAt the moment i am watching 2 models on ETH. The first is an LTF accumulation model which could have the intention to complete the HTF Distribution model. For the distribution i am expecting a model 2 since ETH already came into supply, but we will see.

ETH is compressing for one reason — delivery.This isn’t just sideways chop. This is coiled intent.
ETH is sitting on top of the 0.618 fib at 2,496.25, after a controlled retracement from 2,546.84. We’ve printed a minor sweep below local lows into a high-volume shelf — exactly where Smart Money wants to reaccumulate.
A 1H Fair Value Gap is forming between 2,505–2,515. That’s the inefficiency that price is magnetized to. It will either reject there (distribution) or displace above it and flip the narrative bullish.
The decision is not in guessing direction — it’s in watching how price interacts at the FVG.
If we break and hold above 2,527.52 (0.236), the draw becomes clear: 2,549.69 and beyond.
Execution focus:
🔄 Current range: 2,496–2,505 (PD array and FVG base)
🔺 Bullish trigger: reclaim 2,515.57 and hold
🎯 Target: 2,549.69
🔻 Bearish scenario: rejection at FVG → continuation to 2,464.97 (final sweep zone)
Let others predict.
I just read the imbalance — and position accordingly.

ETH - max. 8-10k within this bullrunThe weekly target zones for ETH are between $8.6K and $10.4K.
If we reach these levels during this cycle, that would signal a macro top for ETH in my view — which likely also marks the top for TOTAL3, OTHERS, and altcoins in general.
In my opinion, we have full potential to reach these zones within this cycle.
Once ETH breaks its all-time high, the euphoria phase will begin — and things could get very greedy, very fast.
Let me know your thoughts on this 👇

$ETH Analysis — Correction Incoming?Summary:
After a strong ~100% rally in ETH, price hit a major resistance zone near $2734.78, triggering a significant sell-off, likely driven by algorithmic profit-taking. Now, the market is poised for a healthy correction before another potential leg up.
📉 What's Next for Ethereum?
🔍 Expecting a Correction of 7% to 25%
Based on technical structure and indicator behavior, ETH is likely to retrace to one of the two key zones:
✅ Primary Buy Zone ("Most Likely"): $2297.20
This zone aligns with previous structure support.
It’s where the price may form a higher low and resume its upward trend.
Ideal for opening a swing long with a tight risk-reward ratio.
🔥 Deeper Correction Opportunity: $1779.58
While less likely, a drop to this level would be a major long opportunity.
Aligns with historical demand and long-term support levels.
Also intersects with the yellow trendlines suggesting trend-based support zones.
📊 Why This Correction Makes Sense:
Weekly Money Flow Index (MFI) is Dropping:
MFI divergence suggests money is flowing out, weakening bullish momentum.
A trigger wave is forming, often preceding price corrections.
Algo Profit-Taking is Done:
Smart money likely exited around $2734.78 (highlighted in chart).
They’ll need to accumulate again at lower levels before the next rally.
📈 Potential Upside Targets:
If ETH respects the structure and finds support around $2297 or deeper, we could see a rally toward $3296.85 — a key Fibonacci extension and psychological level.
🧘♂️ Reminder:
No emotional entries. Let the price come to you. Trust the setup and stick to your plan.
📌 Disclaimer: This is not financial advice. Just a breakdown of my trading thesis. Always manage your risk.

Quasimodo Pattern + Validator Support = Bullish Signal for ETHToday I want to analyze Ethereum ( BINANCE:ETHUSDT ) for you, many tokens are on the Ethereum network , and the increase or decrease of Ethereum directly affects most tokens.
So please stay with me.
Ethereum is trading in a Heavy Resistance zone($2,929_$2,652) near the Resistance lines and 200_SMA(Daily) . It is worth noting that Ethereum is preparing itself for a third attack on 200_SMA(Daily).
In terms of Price Action Analysis , Ethereum could start to rise with the help of the Bullish Quasimodo Pattern and break out of 200_SMA(Daily) and Resistance lines .
In terms of Elliott Wave theory , Ethereum appears to have completed a main wave 4 near Important Support lines . The structure of the main wave 4 is a Double Three Correction(WXY) . By breaking the 200_SMA(Daily) and Resistance lines , we can confirm the end of the main wave 4 .
The ETHBTC ( BINANCE:ETHBTC ) chart conditions are bullish , so it seems like investing in Ethereum could be better than Bitcoin . At least if the market falls , Ethereum is likely to be less likely to suffer a decline .
Note : Over 150,000 Ethereum validators, representing approximately 15% of the network, signaled support for increasing the gas limit from 36 million to 60 million units. This proposed change aims to enhance network capacity, reduce transaction fees, and improve scalability. While this development could positively impact ETH's price by making the network more efficient, it's essential to monitor potential technical risks and ensure that decentralization is maintained.
Note: If Ethereum touches $2,547 , we can expect further declines.
Please respect each other's ideas and express them politely if you agree or disagree.
Ethereum Analyze (ETHUSDT), 1-hour time frame.
Be sure to follow the updated ideas.
Do not forget to put a Stop loss for your positions (For every position you want to open).
Please follow your strategy and updates; this is just my Idea, and I will gladly see your ideas in this post.
Please do not forget the ✅' like '✅ button 🙏😊 & Share it with your friends; thanks, and Trade safe.

ETH/USDT at Critical CrossroadsGreetings Traders,
As of early June 2025, Ethereum (ETH/USDT) is navigating a pivotal technical juncture, currently consolidating around the $ 2,490 - $ 2,500 level. This zone is a historically significant support/resistance flip across multiple timeframes, making its current test crucial for near-term direction.
Current Market Snapshot:
Long-Term (Weekly): Dominant bearish pressure following breakdowns from major 2024 patterns (Rising Wedge, Double Top around $ 4,000).
Medium-Term (Daily): The uptrend from Q4 2023 ($ 1,500 lows) is under severe threat, with price testing the lower bands of the daily EMA ribbon and critical horizontal support. A conflict exists between weekly bearishness and this daily support test.
Short-Term (4H, 1H, 15M): Clearly bearish, with price trading below downward-sloping EMA ribbons.
Key Levels to Watch:
Critical Immediate Support: $ 2,440 - $ 2,500. This is the line in the sand.
Next Major Support: $ 2,280 - $ 2,320, then $ 2,150 - $ 2,200.
Immediate Resistance: $ 2,640 - $ 2,660 (upper boundary of current consolidation).
Next Major Resistance: $ 2,750 - $ 2,800 (recent swing high).
Volume & EMA Insights:
Volume: Relatively low volume on the recent dip to support (15M chart) suggests some seller caution. However, any break of key levels needs to be confirmed by a significant increase in volume for higher conviction.
EMA Ribbons: Short/medium-term EMAs act as dynamic resistance. The daily EMA ribbon is flattening and being tested as support; a bearish crossover here would be significant.
Potential Scenarios:
Bearish Breakdown (Higher Probability given current technicals):
Trigger: Sustained break below $ 2,440 (ideally on increased volume).
Path: Targets $ 2,280-$ 2,320, potentially extending towards $ 2,150-$ 2,200 or even the major $ 1,700-$ 1,850 accumulation zone from Q1 2025 on further weakness.
Bullish Defense & Reversal (Lower Probability without significant catalyst):
Trigger: Strong hold of $ 2,450 support, followed by a decisive reclaim of $ 2,660 (on increased volume).
Path: Could target $ 2,750-$ 2,800. A break above this would be needed to challenge the broader bearish outlook.
Sideways Consolidation:
Path: Price remains range-bound between roughly $ 2,450 and $ 2,660, indicating market indecision. Wait for a clear breakout.
Concluding Thoughts:
Ethereum is at a critical decision point. While a short-term bounce from current support is possible, the overarching technical context from higher timeframes leans bearish. A confirmed breakdown below $ 2,440 would likely usher in the next leg down. Conversely, bulls need to reclaim $ 2,660 and then $ 2,800 with conviction to signal a potential shift.
Monitor price action around these key levels closely, and always look for volume confirmation.
Disclaimer: This is not financial advice. The analysis is for educational purposes based on the provided information for June 2025. Market conditions can change rapidly. Always conduct your own research (DYOR).

ETH - Ranges overview (update) We are currently holding pretty nicely and strongly on ETH so let's see how we play from here.
Pretty simple plan and triggers as always.
IF we break below 2.5K and hold expect us to trade back towards the sellside liquidity sitting around 1.8K.
IF we reclaim 2.5K expect us to aggressively trade back towards the HTF buyside liquidity at 3.4K and 4K.
Stay safe and never risk more than 1-5% of your capital per trade. The following analysis is merely a price action based analysis and does not constitute financial advice in any form.

ETHUSDT Breakout Watch: Bullish Momentum Brewing🧠 Chart Analysis Summary:
This chart suggests a bullish continuation is likely for ETHUSDT based on the current market structure and visual cues:
🔍 Key Observations:
Current Price Zone:
Trading around $2,574, inside a consolidation range (highlighted blue box).
Strong Supply Area Identified:
Around $2,335.93 (marked in purple) – acted as a solid demand/support zone fueling the current move.
Breakout Box:
The price is forming a rectangle pattern, indicating accumulation or consolidation before a breakout.
Bullish Projection Arrows:
Two projected paths show:
Minor dip toward the supply area followed by a bullish breakout 🚀.
Immediate breakout from the box towards resistance levels.
🎯 Target Levels:
First Target: 🟣 $2,918.70 – “possible next move”
Second Target: 🎯 $3,006.40 – strong resistance zone
🧩 Conclusion:
This setup suggests ETH may be preparing for a breakout from the consolidation zone. If bulls maintain control, we could see a rally towards $2,918 - $3,006 in the coming weeks.
Risk Tip: Watch for a fakeout if price dips below the consolidation range — especially near the $2,335 area.
🧠 Trading Tip:
Use volume confirmation and candle closes above the box to validate the breakout! 📊

Buy### Important and main block order ### can cause a return and reaction to the level. ### In the low time frame, wait for the first ceiling to break and trade when hitting the block!!!! ###buy ###choch

SMI vs. Stochastic: Which One Gives You the Edge?Momentum indicators are essential tools in every trader’s arsenal—but not all are created equal. While the Stochastic Oscillator has been a go-to for decades, the Stochastic Momentum Index (SMI) offers a more refined and reliable way to read market momentum.
In this post, we’ll break down the key differences between these two indicators, how we use them at Xuantify , and why the SMI might just give you the edge you’ve been looking for.
🧠 How We Use It at Xuantify
We’re always looking for tools that offer greater precision and less noise . While the Stochastic Oscillator is one of the most commonly used tools for spotting overbought and oversold conditions, the Stochastic Momentum Index (SMI) gives us a clearer, smoother view of momentum —especially in volatile or choppy markets.
We use the SMI to refine our entries and exits , particularly when trading breakouts or reversals. MEXC:ETHUSDT.P
⭐ Key Features
Stochastic Oscillator : Measures the closing price relative to the high-low range. Simple and responsive. Great for spotting short-term reversals.
Stochastic Momentum Index (SMI) : Measures the distance of the current close from the midpoint of the high-low range. Smoother and more centered around zero. Better at filtering out false signals.
💡 Benefits Compared to Other Indicators
Stochastic Oscillator vs. SMI:
Signal Smoothness: Moderate vs. High
Noise Filtering: Low vs. Excellent
Centered Oscillation: No vs. Yes (around 0)
Best Use Case: Range-bound markets vs. Trend shifts & momentum confirmation
False Signal Risk: Higher vs. Lower
The SMI is especially useful when you want to avoid whipsaws and get a more reliable read on momentum .
⚙️ Settings That Matter
Stochastic Oscillator : %K = 14, %D = 3
SMI : Length = 14, Signal Smoothing = 3, Double Smoothing = 3
You can adjust the SMI smoothing values to match the volatility of the asset— lower smoothing for fast markets , higher for slower ones.
📊 Enhancing Signal Accuracy
Enhance SMI signals by combining them with:
Trend filters like EMAs or Supertrend
Volume confirmation
Support/resistance zones
Divergence spotting for early trend reversals
This layered approach helps us avoid false positives and stay aligned with the broader trend .
🧩 Best Combinations with This Indicator
SMI + EMA Crossovers: Confirm momentum with trend direction
SMI + RSI Divergence: Spot early reversals with confluence
SMI + Volume Profile: Validate momentum near key price levels
⚠️ What to Watch Out For
Lag in fast markets: SMI’s smoothing can delay signals slightly
Over-optimization: Avoid excessive tweaking of parameters
Not ideal alone: Best used with confluence tools for confirmation
🚀 Final Thoughts
The Stochastic Oscillator is a classic for a reason—but the Stochastic Momentum Index is a refined evolution . We’ve found that SMI gives us cleaner signals , better momentum clarity , and fewer false alarms —especially when paired with smart filters.
If you're looking to upgrade your momentum toolkit , the SMI might just be your edge.
🔔 Follow us for more educational insights and strategy breakdowns!
We break down indicators, strategies, and market psychology to help you trade smarter—not harder.

ETH >>> Inverse Head & Shoulders Breakout Sets Stage for RallyHello guys!
Ethereum has formed a textbook inverse head and shoulders pattern on the 15-minute timeframe and just confirmed a breakout above the neckline. This bullish reversal formation comes after a sharp downtrend, signaling a potential shift in short-term momentum.
📌 Breakout Level: ~$2,645
🎯 Potential Target: ~$2,730–$2,750 based on the pattern height
🟦 Retest Zone: ~$2,620–$2,640
We’re currently seeing a healthy breakout followed by a possible retest of the neckline, which could offer a solid entry for continuation toward the upper boundary of the channel.
If bulls hold this structure, ETH could accelerate higher in the coming sessions.

Ethereum (ETH/USDT) Technical Analysis | Retest or Rejection?Ethereum (ETH/USDT) Technical Analysis | Retest or Rejection? The Market Decides
As shown in the 30-minute chart, Ethereum recently broke below the key support at $2,531, entering a short-term bearish phase. After the sell-off, ETH is now in a retracement move and testing the descending trendline from below — a critical decision point for the next move.
🟢 Bullish Scenario: Breakout and Recovery Ahead
If ETH can break above the descending trendline with strong bullish momentum, the next resistance levels to watch are:
$2,531 – the previous support turned resistance
$2,573 – the next major resistance, which could trigger further upside
A confirmed breakout above these levels could shift short-term momentum back in favor of the bulls.
🔻 Bearish Scenario: Rejection and Continuation of the Downtrend
If ETH fails to break the trendline and gets rejected, we may see a new leg down. In that case, keep an eye on these key support levels:
$2,484 – short-term support
$2,453 – local support with multiple recent reactions
$2,393 – a major support zone and potential bounce area
📌 Conclusion
Ethereum is at a technical crossroads. A clean breakout or a sharp rejection from this trendline could define the next major move. Traders should watch for clear candlestick confirmations and volume spikes before taking action.
🚨 If you found this analysis helpful, smash that follow button! I post real-time charts, clean setups, and no-fluff insights to help you stay ahead of the market. Let’s grow together! 💥

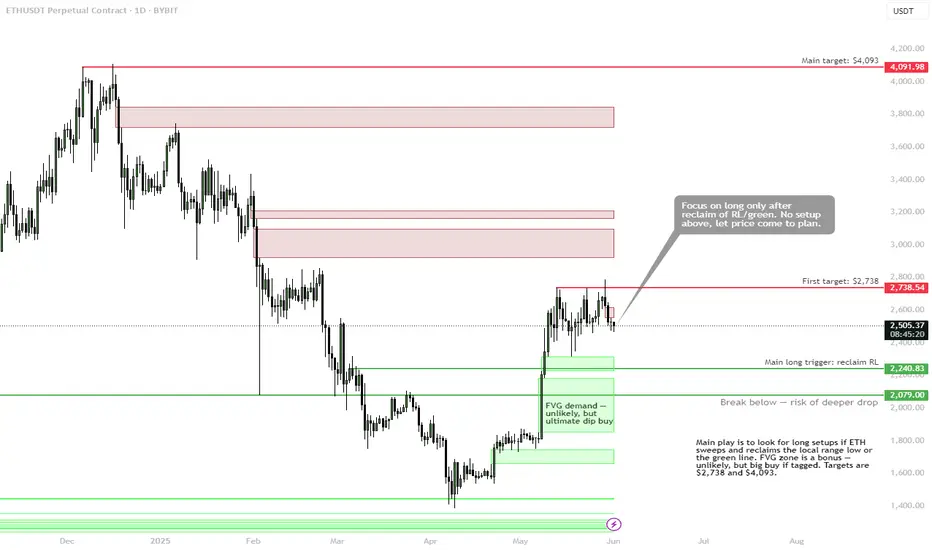
ETH (plan in progress) — Setup Only Valid on ReclaimCRYPTOCAP:ETH is consolidating beneath key resistance at $2,738, failing to show bullish continuation. The current zone offers no valid long setup until structure confirms. Eyes remain on range low sweeps and reclaim triggers.
Plan:
✅ Main Long Trigger: Reclaim of $2,240–2,250 range low
• Must see price sweep and reclaim local lows or green SR
• No setup above current levels — wait for plan to trigger
• First target: $2,738
• Main target: $4,093
🟩 FVG Demand Zone (Ultimate Dip Buy): $2,080–1,800
Unlikely to tag, but if reached — high conviction buy zone.
🚫 Break Below $2,079 → increased risk of deeper drop
• Exit bias if structure breaks down below green zone
Summary:
Let the price come to the plan — no need to chase. Focus is on range low reclaim or FVG tag as entry catalysts. Don’t long mid-range without confirmation.
📌 Discipline is an edge — great entries come to those who wait.
Ethereum Trading Signal: Ready for a ReboundAsset: ETH/USDT
Direction: Long (Catching a Technical Rebound!)
Entry: 2500 USDT (For extra safety, wait for confirmation above 2505–2510 USDT)
Stop-loss: 2475 USDT (Just below key support—protect your capital!)
Take-profit:
Target 1: 2545 USDT (Right at the resistance cluster—first exit)
Target 2: 2580 USDT (Bulls’ next challenge and Bollinger Band top)
Confidence: Medium
🧐 Why?
After a strong downtrend, ETH hit a major support zone (2475–2490 USDT) and is showing signs of a technical bounce. RSI is flashing a bullish divergence, and the MACD looks ready to turn—classic setup for a short-term recovery!
🚦 Trading Plan:
Wait for price action to push above 2500–2510 USDT before jumping in.
Tight stop just below 2475 to manage risk.
Book profits at 2545 and ride the momentum to 2580 if bulls really come out to play!
✨ Pro Tip: This is a tactical “countertrend” play—quick in, quick out. If support fails, step aside and let the bears run.
Ready to ride the Ethereum bounce? Let’s catch this wave! 🌊🚀
#Ethereum #ETH #CryptoTrading #TradingSignal #BullishRebound #CryptoCommunity
Let me know if you want even more hype or a different style!

ETH | (reversal setup) — Waiting for Sweep & Reclaim to Trigger BINANCE:ETHUSDT is approaching a key liquidity pocket around $2,440, where multiple wicks have stacked. Price is likely to sweep this zone before any sustained move higher. The current plan favors waiting for the trap → then reacting.
Setup:
🟩 Trigger Zone: $2,440–2,400
• Expecting a sweep of $2,440
• Long setup only valid if price sweeps + reclaims on lower timeframe
• Break below $2,400 = invalidation, wait for new structure
🚫 No entry on first touch — avoid longs without a strong reclaim
🎯 Target Zone: $2,738+
First resistance comes from the H4 supply and the previous range high.
Plan:
• Monitor for liquidity grab and reclaim
• If structure holds — good R:R swing setup
• If not — stand aside, reassess at deeper levels
📌 Smart money needs liquidity. Let it sweep first — then strike.

eth 4h
It seems that seller pressure will continue in ETH. As long as there are no closes above $2650, a downward movement towards the $2240 and $2100 levels can be expected.

ETH isn’t done. It’s just hunting stops.This isn’t a dump. This is preparation.
ETH swept the low into the 0.786 retracement — right where liquidity was resting. The 1H chart shows an engineered drive down into 2,490.26, just above the final inefficiency at 2,474.00. That’s the last fill zone before repricing.
Look left — we’re now sitting at the tail end of a low-volume node. Price doesn’t stick here. It reacts.
I’m watching for a shift back into the 2,503–2,512 zone, where the 0.5 retracement overlaps the 1H OB. That’s the first stop. Beyond that, 2,520.97 marks the high-volume shelf and the 0.382 retrace — the true magnet.
If ETH reclaims that zone with strength, I expect delivery back to 2,550. If not, expect one more purge below 2,474 — and then the real reversal begins.
Execution logic:
🎯 Long trigger: 2,490.26–2,474.00 sweep
🧠 TP 1: 2,512 (OB/50% retrace)
🧠 TP 2: 2,520.97–2,532 (HVA zone)
❌ Invalidation: clean 1H close below 2,474 = new range forming
This is where most traders hesitate.
I don’t guess the bottom. I wait for Smart Money to make it.

ETH strong byhistory repeats itself - the main postulate of market analysis. Here I see a standard scheme for capturing liquidity. A level is created behind which market participants place stop orders. As soon as a large number of them accumulate there, the price breaks through this level, collecting liquidity. With a sharp return behind the level. This is how bitcoin turned around from 16k
