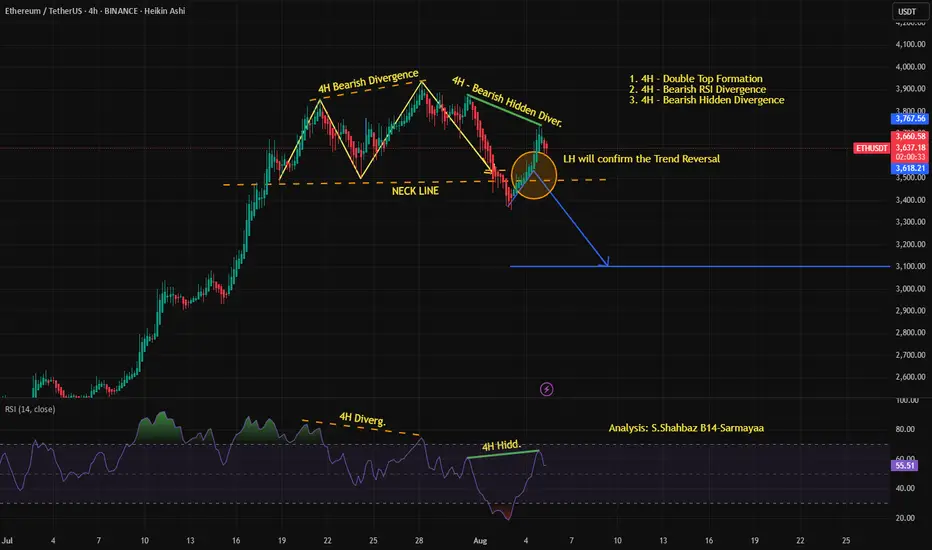
ETH/USDT - 4H Bearish Reversal Setup Confirmed by Double Top &..This 4H chart of Ethereum (ETH/USDT) is indicating a strong bearish reversal setup. A double top formation has formed near the $3,770 zone, accompanied by both a regular bearish divergence and a bearish hidden divergence on the RSI.
Price has broken down below the neckline of the double top, and a possible retest zone is marked, which may act as resistance.
If the price gets rejected from this retest area, the 4H confirmation candle will validate a trend reversal, potentially targeting the $3,100–3,000 zone.
ETHUSDT trade ideas
EthusdHonestly probably marks up very heavily soon...
We are entering etf bid war phase of the cycle.
Can't even really draw how vertical this chart could go as certain macro economic conditions seem to be brewing...
15k is the predicted target of certain large tradfi firms that are accumulating, bitmine for example.
They are basing their targets from the success of the circle internet groups public listing as well as fundamental factors such as JPMorgan and other institutions launching their own stable coins on ethereum...
Multiple companies rushing to accumulate 5% of the supply while predictions of a 75bps rate cut from the fed are starting to brew...
Supply shock combined with inflationary event aswell as eths successful merge earlier this year are incredibly bullish catalysts and we aren't even at the ath valuations seen last cycle.

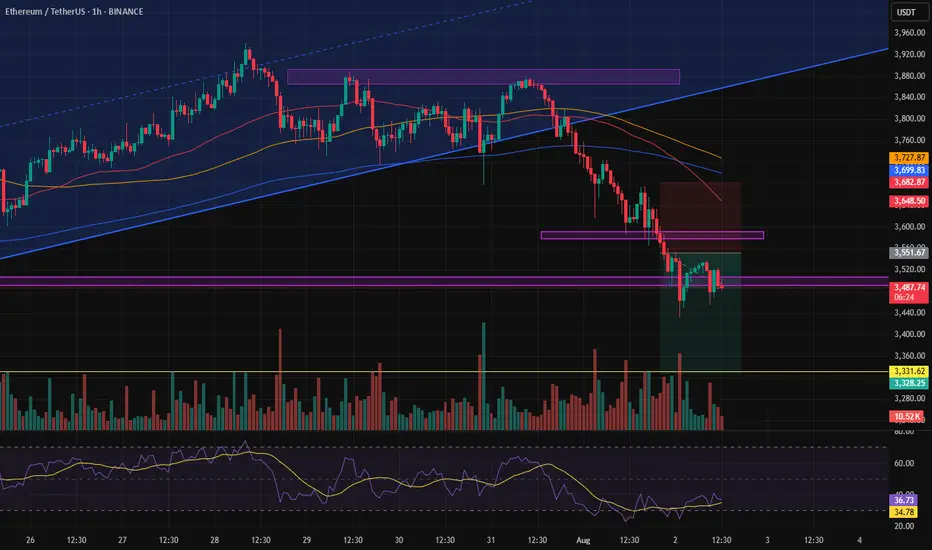
Update on the previous analysis.Our analysis hasn’t changed much since yesterday — we still believe the price will reach the $3,330 zone unless buying volume increases significantly and this area turns out to be a fakeout.
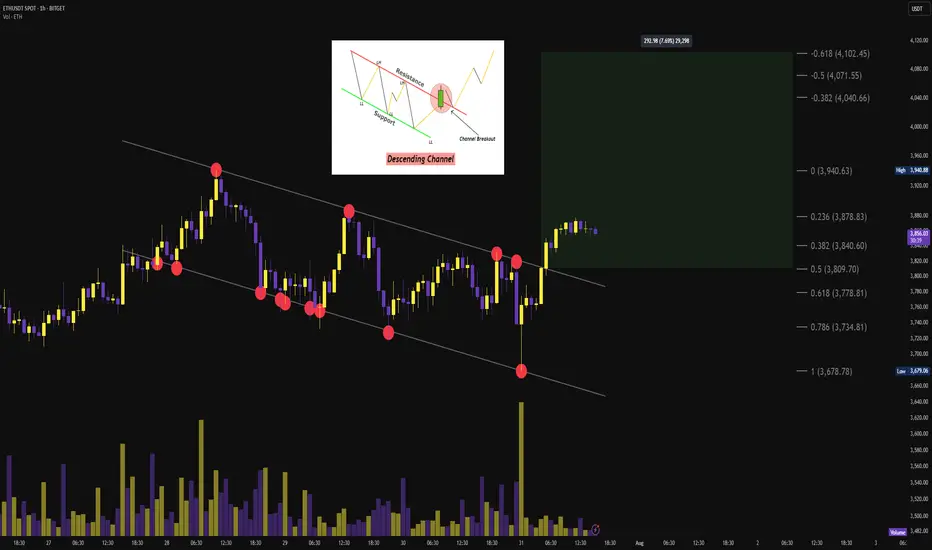
$ETH 1H Descending Channel Breakout🟩 Breakout Level: $3,770
🟩 Fib-Based Targets:
→ $3,878 (0.236)
→ $3,940 (0)
→ $4,040 (0.382)
🟥 Invalidation:
Break back inside the channel + loss of $3,678
Momentum Summary:
Perfect touchpoints across the descending channel. Final wick tagged demand with massive volume, followed by impulsive breakout and retest. Short-term structure favoring bullish continuation.
$ETH - Taking Lead Over $BTC (again)Ethereum is strong as ever here. Despite Bitcoin dumped due to the FUD of Galaxy Digital selling CRYPTOCAP:BTC worth of $3.5B, Ethereum managed not stay above the support and even umped!
It is currently forming a Descending Channel (bullish pattern) above the $3520 support level. Local setup. Once this channel is broken upwards, we can expect the price to move towards the ascending resistance that was set a week ago, target is $4100 - $4200 .
You can either enter a trade here or wait for the breakout of the descending channel, the second option is safer.

ETH NEXT MOVE AND BUY ZONE.1. Market Structure:
ETH/USDT broke previous structure highs (marked with X), confirming a bullish trend shift.
Price made a strong impulsive move upward after that break, forming higher highs and higher lows, indicating smart money accumulation.
2. Price Action & Current Retracement:
After forming a recent peak near $3,950, ETH entered into a retracement.
The retracement is currently holding above key liquidity and demand zones, showing signs of healthy correction rather than reversal.
3. Liquidity Grab – Sell-Side Liquidity (SSL):
There is Sell-Side Liquidity (SSL) resting below $3,700, which has not yet been taken out.
Smart money often targets such liquidity before initiating a new leg up — this makes SSL a potential magnet for price.
4. Fair Value Gap (FVG) + Demand Zone (POI):
Just below the SSL lies a confluence zone:
A clear Fair Value Gap (FVG) between approximately $3,680–$3,700, showing inefficiency in price.
A Demand Zone (POI) below that, between $3,640–$3,680, representing the origin of the bullish move that broke structure.
This zone provides high-probability support and a potential area of smart money re-entry.
5. Trade Setup Expectation:
Scenario: Price is likely to:
Sweep SSL below $3,700.
Tap into the FVG + Demand Zone.
Show bullish confirmation (like a bullish engulfing, Choch/BOS on lower timeframe).
Entry: After confirmation inside demand zone.
Stop Loss: Below demand zone (~$3,620).
Take Profit 1: Retest recent high at $3,950.
Take Profit 2: Extension toward $4,050–$4,100 based on higher timeframe targets.
✅
Summary:
ETH/USDT is in a bullish structure but currently pulling back. A sweep of sell-side liquidity (SSL) and a tap into the FVG + Demand Zone around $3,640–$3,700 is expected. After confirmation, it offers a high-probability long setup, aligning with smart money accumulation logic.

ETH is at a critical inflection pointETH 4H – Decision Time 🧠🐂🐻
Ethereum’s dancing on the edge of a blade.
📍 Entry: $3,778 (Short)
🧪 Next Add: Tiny at $3,906 (updated)
🚨 Major Add: Above $4,100 (TBD)
⚠️TP 1: $3,677 (updated)
We’ve broken the downtrend line — bullish on paper — but ETH is stalling right near resistance at $3,875. If bulls don’t show up with volume and conviction, this move fizzles out fast.
Here’s the playbook:
🔸 $3,875 = key battle zone
— Reclaim it clean (4H close + volume) = "short-term" bear bias invalid (◘reread◘)
— Failure = likely drop to $3,677 → $3,588
🔸 $3,720 = swing short confirmation if broken
🧩 If bulls win $3,875, I keep the short but hedge with a long. Because if the herd’s charging uphill, they might lead us to gra$$.
Momentum is king. No follow-through = fakeout top.
Let the chart breathe.
LOW LEVERAGE POR FAVOR!
Stay Sharp. Stay nimble. 🎯
100% not financial advice, for edutainment purposes only!

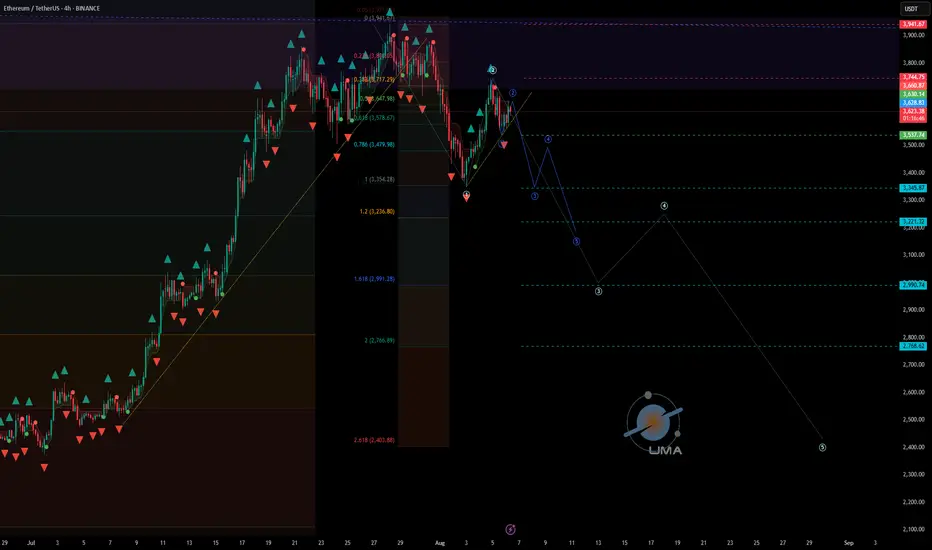
ETHUSDT - UniverseMetta - Analysis#ETHUSDT - UniverseMetta - Analysis
Potential reversal & correction setup in progress
📆 W1 – Weekly Timeframe
🔹 Price is testing a major monthly resistance zone, from which price has previously rejected toward the lower edge of a large triangle structure
🔹 According to the 3-wave structure, ETH has reached 161% of Wave 1 and closed above the 200% Fibo level
🔹 If the price fails to make a new high this week, a top fractal may form — a possible signal for a medium-term correction
📉 D1 – Daily Timeframe
🔹 A double top pattern is forming, along with a potential retest of the trendline
🔹 If confirmed, this could trigger a 3-wave correction structure downward
🔹 A downward fractal is already printed — adding confluence to the bearish scenario
🎯 Correction targets:
• $3,242
• $2,546
⏳ H4 – 4H Timeframe
🔹 Current price action suggests a correction from the recent impulse
🔹 A 3rd wave may initiate upon trendline breakout
🔹 Entry confirmation may come from breakout + retest, or via confirmed double top structure
🔹 Stop should be placed above the high of Wave 1 (H4)
🎯 Trade Setup:
Entry: 0.64930
TP: 0.65404 - 0.65700 - 0.66164 - 0.66676
Stop: 0.64482
‼️ Risk should not exceed 1–3% of your portfolio
This signal/idea is not financial advice
📌 Key Fundamental Triggers to Watch:
🔹 Federal Reserve expectations – a dovish shift could support ETH short-term, but failure to materialize may drive a pullback
🔹 ETH ETF news – updates on applications, approvals, and volume flows can significantly impact sentiment
🔹 Correlation with NASDAQ/S&P500 – weakness in equities could drag crypto lower
🔹 On-chain activity – declining gas usage or demand may indicate lower network utility and bearish pressure
🔹 Weekly overbought condition – many technical indicators (RSI, MACD) point to overextension

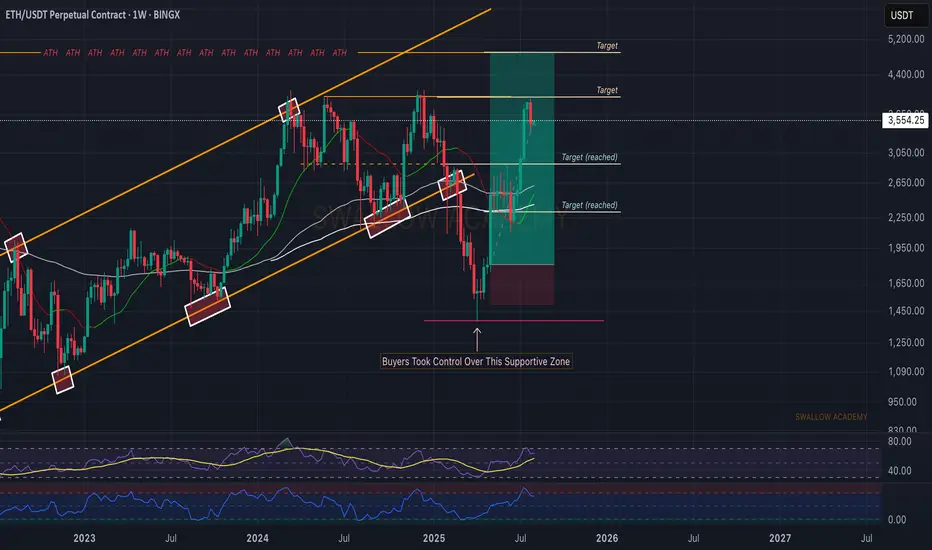
Ethereum (ETH): Looking For Break of $4000 | We Are BullishETH is still bullish in our opinion;recently we had a really good upside movement that got stopped right before reaching the $4000 zone.
Now we had a smaller pullback, which is normal as we had a really strong upside movement so we see it as a natural pullback, which will give us another bounce opportunity (accumulation zone).
Since our entry we have had a good movement, and we are keeping the position open until we reach the ATH zone!
Swallow Academy
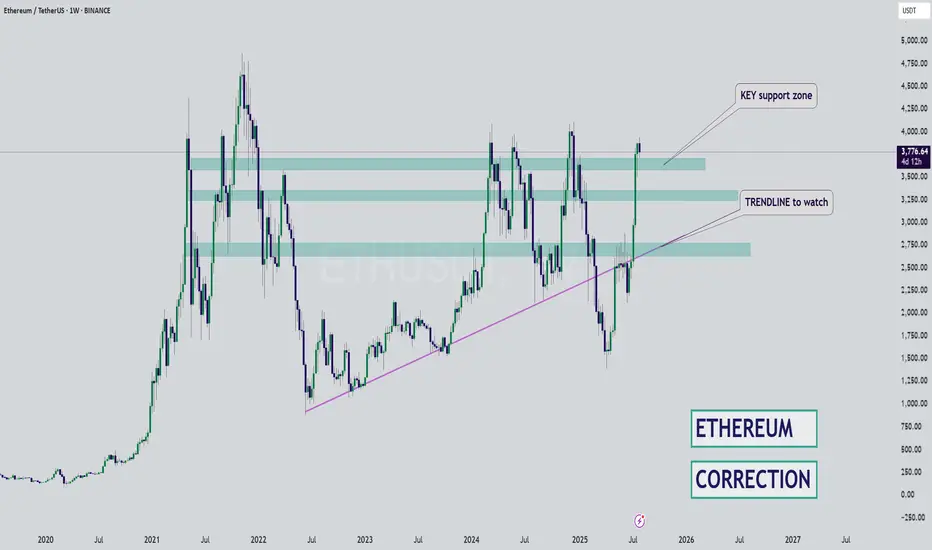
ETH - Bounce Zones - Nears the End for BULLSHello Fello's ☕
I'm watching Ethereum today and I believe it may be very close to the end of it's bullish cycle.
I think what could become likely is an extended altseason, where Bitcoin trades around the same price for some time, and Ethereum increases slightly. Afterwhich smaller altcoins (by marketcap) make random rallies before the beginning of a bearish cycle (which is due, see my previous BTC update).
There's an interesting channel here that previously determined bounce zones... I don't believe the channel itself will hold as much value going down, but this zone may be a likely bounce zone - around $3k.
Key bounce zones to watch include:
I'm not saying it will be this straightforward, but this image demonstrates the power of bounce zones for swing trades:
Next update will be when we've lost the first support zone.
Until then!
ETH analysis (1H)A trendline has been broken, and a resistance zone has formed on the chart. As long as Ethereum fails to hold above the red zone, the price may experience a drop.
The green box can be considered the target.
If the price stabilizes above the red zone and a daily candle closes above the invalidation level, this analysis will be invalidated.
For risk management, please don't forget stop loss and capital management
Comment if you have any questions
Thank You

ETH/USDT Bearish Setup – Rising Wedge Breakdown & RetestEthereum (ETH/USDT) has broken down from a rising wedge — a classic bearish pattern — and is now showing signs of rejection after a clean retest of the broken trendline around $3,679.
Structure:
Rising wedge pattern on the higher timeframe
Breakdown confirmed with retest of lower trendline as resistance
No bullish follow-through after retest
Trade Plan:
Bias: Bearish below $3,680
Entry Zone: Anywhere below $3,670–3,680 if rejection is confirmed
Stop Loss: Above $3,720 (invalidation)
Targets:
Target 1: $3,298
Target 2: $2,880
Target 3: $2,640
Key Notes:
If ETH reclaims and holds above $3,680, the setup gets invalidated
Watch BTC behavior — ETH tends to follow
Volume shows no strength from bulls post-breakdown
This setup presents a high-risk, high-reward opportunity if the price continues to decline from this zone.
Conclusion:
Stay cautious, as the market could see more downside if ETH stays below $3,680. Manage risk accordingly.
DYOR | Not Financial Advice

Ether Update · Accumulate, Buy & Hold · 2025 StrategyGood morning my fellow Cryptocurrency trader, I hope you are having a wonderful day.
Ethereum continues really strong and today is trading at the highest price since December 2024. Right now getting close to a long-term resistance zone that was first established in March 2024. As soon as ETHUSDT manages to break $4,100 as resistance, we can expect a major advance toward a new all-time high. Remember, sustained long-term growth, just as it is happening already. Notice the slope on the rising wave since April. It will continue just like this, prices going higher and higher until a final jump produces very high prices based on a long wick.
Market conditions have not change since our last update. Everything is extremely bullish and the chart looks even better now, the rest of the market is also looking better so the focus should be on hold and preparing a profit taking strategy. How will you profit from this trade? How do you intend to sell? How will you reduce or close your position when the time is right? You can start preparing now.
There are many ways to approach the targets but it is always wise to wait at least until a new all-time high. Since we have enough data support a new all-time high as a high probability scenario, we want to benefit as much as possible from the uptrend and thus we ignore the initial easy targets. We go for the higher targets because we are now in the 2025 bull market.
When in doubt, you don't have to be 100% right but neither 100% wrong. If you don't know how the market will behave next, instead of thinking to sell the entire position, you can sell a small portion only, say 10%. And continue like this long-term.
There are many strategies, many ways to plan and win, but for now focus on holding patiently, patience is key. Those who can wait the longer without being tempted can produce the best results. Just let it roll... The market is set to grow. Accumulation and buying now the best choice.
Namaste.

ETH is PullbackingAs I said befor, a double top has formed at around $4,000 and I guess we have a pullback to around $3,500. The "new RSI Index" is showing a pullback and strong divergence. If ETH breaks $4,000, this analysis will be rejected.
"IT is NOT a commercial advice. you may lose all your money in crypto Specially in FUTURE trading."

ETH may have PULL BackAs we can see, a double top has formed at around $4,000 and I guess we have a pullback to around $3,500. The new RSI is showing a pullback and strong divergence. If ETH breaks $4,000, this analysis will be rejected.

Long trade
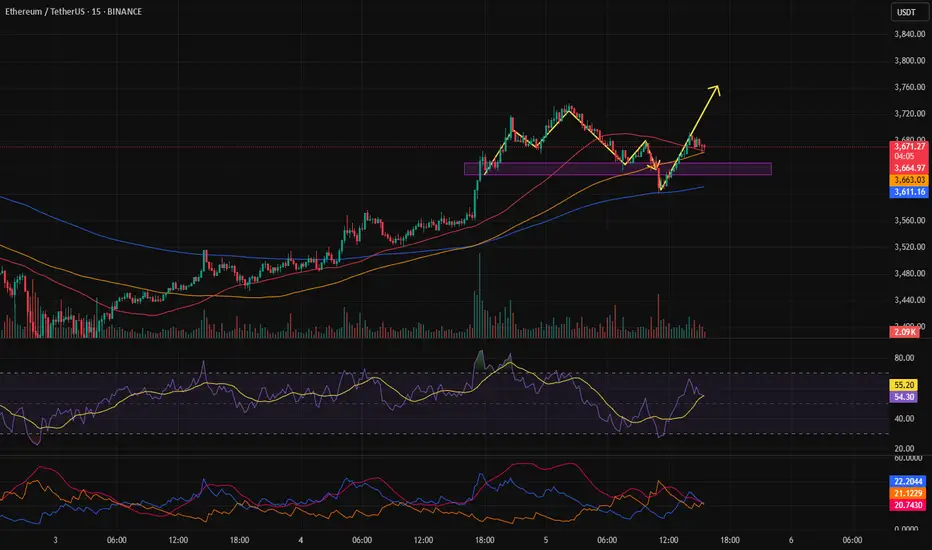
15min TF overview
🟩 Trade Type: Buyside Trade
Pair: ETHUSDT
Date: Sunday, 3rd August 2025
Time: 5:15 PM
Session: London–New York Overlap (LND Session PM)
Timeframe: 15 minutes
🔽 Entry Parameters
Entry Level: 3,455.23
Stop Loss: 3,436.73 (-0.54%)
Take Profit: 3,877.00 (+12.21%)
Risk-to-Reward (RR): 22:8
📉 Market Structure & Technicals
Trend Context:
Price reversed from a steep bearish trend and showed signs of a bullish momentum shift.
EMA/WMA Levels:
EMA (blue) and WMA (yellow) show a bullish crossover at the point of entry
Both MAs began to slope upward, confirming the trend shift.
Liquidity Observations:
Clean sweep of prior lows below 3,500 preceding entry.
Price traded back into a premium zone after reacting from a deep discount.
🧠 Narrative / Rationale
Set up Narrative:
ETH completed a strong downtrend and printed a bullish market structure shift (MSS) on the 15-minute TF. Entry was taken after price reclaimed the (POI) and confirmed a higher low.
Current Status: Trade in progress, profit levels partially hit.
TP aligns with the previous supply zone or relatively equal highs around 3,784.
Additional liquidity above 3,877–3,915 for extended targets if trade continues.

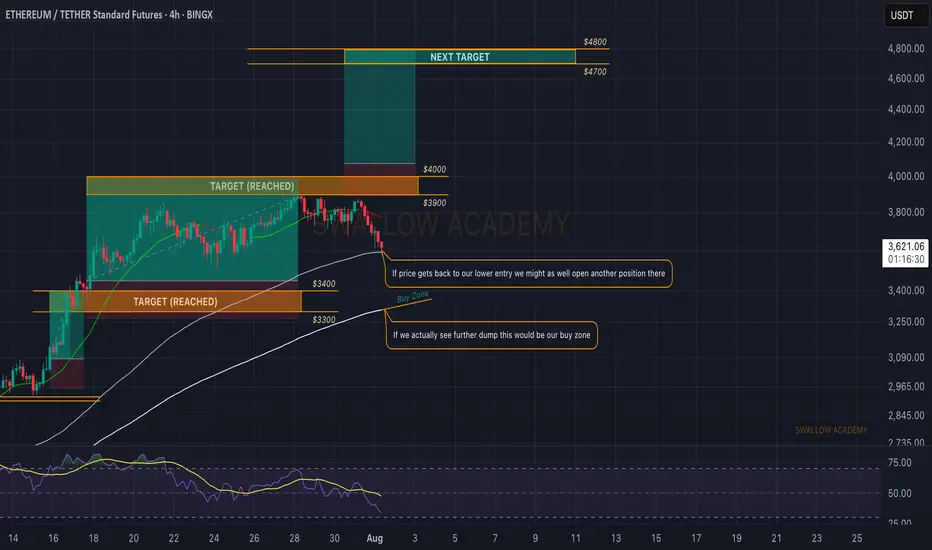
Ethereum (ETH): Bloody End of Week & Start of Month | We Wait!Well, we were close to breaking out of the $4000 area and now we are back on the lower side of the area, where sellers are showing strong pressure to coin.
As we approached the 100 EMA, we waited. Waiting is the worst part of trading, but that's what we do here. The 200 EMA is one key zone for us for another buying opportunity so if we keep on falling, that's the zone we are aiming for.
The second point of interest is the current 100 EMA, where if we see MSB to form, there might be a smaller scalp opportunity.
And last but not least, the zone above $4000.
Swallow Academy
ETH forming double topETH is forming a double top, nice confluence to what BTC is doing rn
Maybe that's the turnaround and its going back down for now.

Eth / UsdtBINANCE:ETHUSDT
### 📈 **Ethereum (ETH/USDT) Update – Technical Snapshot**
💵 **Current Price:** \~\$3,490
🔺 **Intraday High:** \$3,670 | 🔻 Low: \$3,453
---
### 🧱 **Support Zones**
✅ **\$3,500–\$3,600** → Key short-term demand zone
✅ **\$3,000–\$3,200** → Strong mid-term cushion
✅ **\$2,000–\$2,500** → Long-term on-chain investor base
⚠️ **\$2,120** → If broken, risk accelerates toward \$2,000
---
### 📉 **Resistance Zones**
🚫 **\$3,860–\$3,900** → Breakout zone = Bullish confirmation
🚫 **\$4,100–\$4,500** → Major zone with historic pressure
🚀 **\$5,000–\$5,300+** → ATH targets if macro + ETF narrative holds
---
### 📊 **Strategy Overview:**
| 🧭 Scenario | 📌 Strategy |
| ------------------------ | --------------------------------------------------------------- |
| ✅ **Bullish Bias** | Hold above \$3,600 → eyes on \$3,900–\$4,000 next |
| 💥 **Breakout Play** | Clean break above \$4,500 = open skies toward \$5,000–\$5,300+ |
| 🧯 **Bearish Risk** | Below \$3,500 could revisit \$3,000 or \$2,500 support bands |
| ⛔ **Critical Breakdown** | Breach under \$2,120 = watch for strong downside toward \$2,000 |
---
### 🧠 **Final Thoughts**
ETH is in **consolidation near highs**.
• Volume & ETF inflows are key catalysts
• Indicators like **RSI, MACD, Fib zones** can help confirm setups
---
⚠️ **Disclaimer:** Not financial advice. Always **DYOR** and manage your risk wisely. 🧠📉

Failure of the head and shoulders pattern to activateThe failure of the head and shoulders pattern to activate suggests that the bullish trend may likely continue.
#ETH Update #6 – Aug 02, 2025#ETH Update #6 – Aug 02, 2025
Although Ethereum may seem like it has dropped significantly, it still hasn’t completed the correction of its last impulsive move. If we are to say a proper correction is happening, Ethereum must pull back to the $3,300 zone. If it continues upward without reaching this level, the risk of a deeper retracement increases. That’s why it would be much healthier for Ethereum to extend this pullback and complete the correction around $3,300.
If this correction is completed, the next target will be around $4,450. There is also an imbalance zone around $3,300, and since the price is already close, it might aim to fill that as well — possibly even reaching down to the $3,200 level. Contrary to much of the current market sentiment, Ethereum is heading toward a correction in a very healthy manner, and I believe completing this move would be the best scenario.

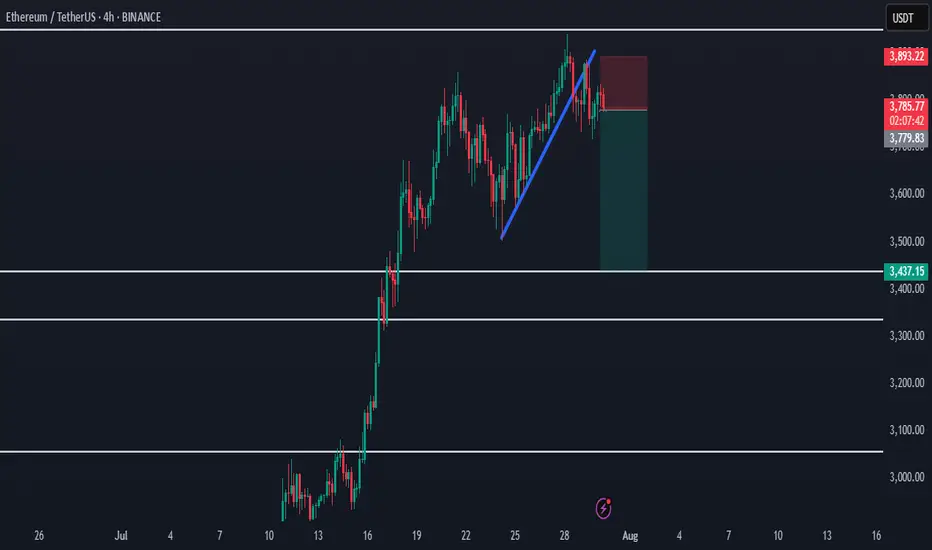
Ethereum Rejected from Supply - Bearish Shift in ProgressHello everybody!
Price has been rejected from a supply area.
The bullish trend has slowed down, and the market structure is slightly shifting bearish.
A polished upward trendline has been broken on the 1H timeframe.
We’re aiming for a target around the first untouched demand zone: 3437.
Manage your risk and trade safe!