Ethereum is approaching the key level ┆ HolderStatKUCOIN:ETHUSDT is consolidating between $3,368 and $3,866 following a strong impulse move. Sideways range formation and trendline support hint at bullish continuation. Breakout above $3,866 may resume the upward trend toward new highs.
ETHUSDT trade ideas

ETHUSDT - FUTURES SIGNAL FUTURES SIGNAL
Coin: ETH
Direction: LONG
🟢Input range: market/3578
✔️ТР: 3726/3902
❌SL: 3501
We work from the order block zone, in which I expect a price reversal.

ETH Daily: Lower High, Lower Low. That Was My Signal
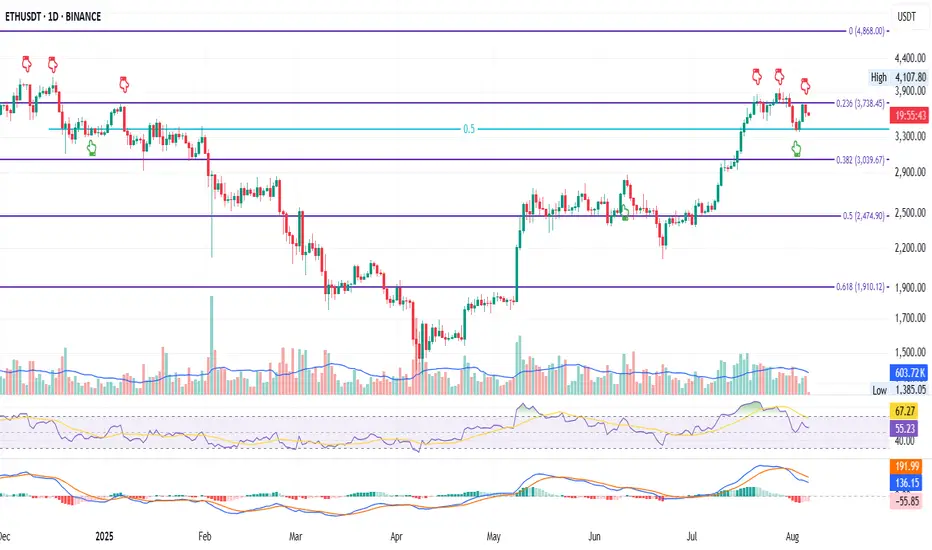
This is ETH on the Daily
Price action today looks very similar to December 2024.
Back then, ETH attempted twice to flip the 0.236 Fib level at $3378.45 — first on Dec 6, then on Dec 12. Both failed. Price found support at the 0.5 (midpoint between the 0.236 and 0.382), bounced, got rejected again at the 0.236, then went lower.
Now, we’re seeing a near-identical pattern:
– First attempt to reclaim the 0.236 Fib on July 21
– Second attempt on July 27
– Both failed
– Price found support again at the 0.5 middle level
– Bounced back to the 0.236
– Got rejected again
What will happen this time?
For me, the answer already came: we’ve now seen a lower low followed by a lower high — a temporary break of bullish structure. That’s my cue to scale out of my long and reduce exposure so I’m not caught off guard overnight.
Now that I’ve done that, I can observe the chart objectively without emotional bias or panic-selling.
Technically, ETH is in a short-term downtrend.
Fundamentally, however, I believe we’re in the early stages of a larger uptrend, driven by strong bullish news around crypto (happy to list them if you're curious).
But until those bullish narratives start kicking in and price moves up again, I have to be extremely careful not to get wiped out — so I’ll stay closely aligned with price action.
Like I said: short-term downtrend, long-term opportunity.
Always take profits and manage risk.
Interaction is welcome.
eth sell midterm "🌟 Welcome to Golden Candle! 🌟
We're a team of 📈 passionate traders 📉 who love sharing our 🔍 technical analysis insights 🔎 with the TradingView community. 🌎
Our goal is to provide 💡 valuable perspectives 💡 on market trends and patterns, but 🚫 please note that our analyses are not intended as buy or sell recommendations. 🚫
Instead, they reflect our own 💭 personal attitudes and thoughts. 💭
Follow along and 📚 learn 📚 from our analyses! 📊💡"

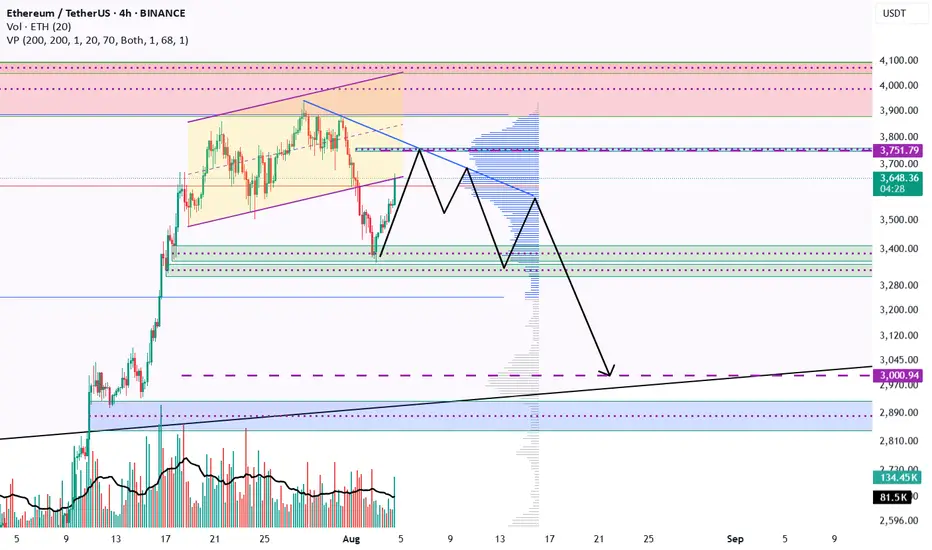
Ethereum Technical Update: $3,750 Target with $3,000 Correction Ethereum could rise to $3,750, and the correction may continue down to $3,000 by the end of August.
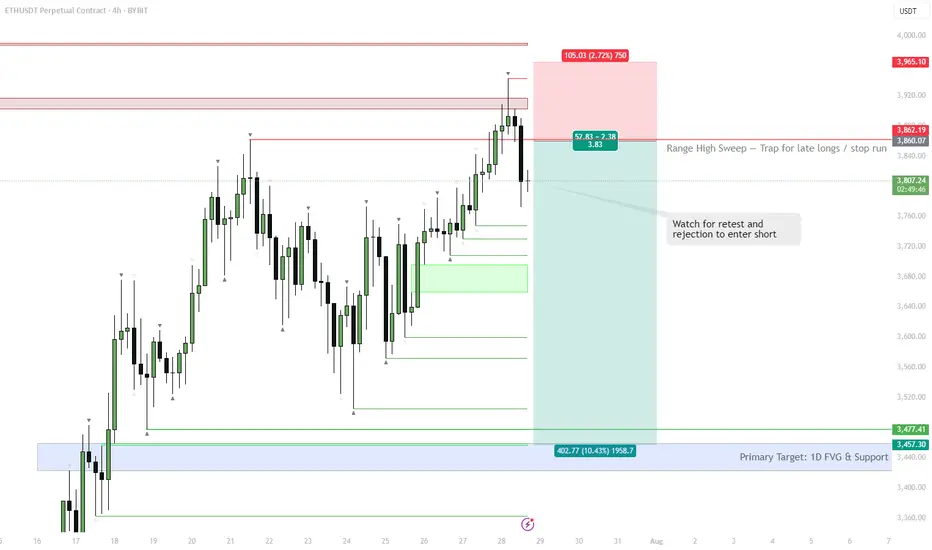
ETH | #4h #short — Range High Sweep & Short SetupScenario:
ETH swept the range high at $3,860, trapping late buyers and triggering stops. Watching for a retest of this level — if it holds as resistance and we see rejection, that’s a short trigger.
Target:
Main target is the 1D FVG at $3,457–$3,477. Possible extension: sweep of range low if selling accelerates.
Why:
Failed breakout setups are classic mean reversion triggers, especially when supported by a visible liquidity pool (FVG) below.
Plan:
Wait for a retest and rejection to confirm short. Partial TP at the FVG zone, manage risk above the sweep high.
ETH - 5500 USD in the short-term (Banks and states buying!)ETH is pumping, and altcoins with it. That means we are in an alt season, which I predicted in the previous post here on July 9, before the pump:
ETH is part of the USA crypto reserve, and banks also love this altcoin. The ETH ETF was launched, and the big players already count this coin as the future of the crypto industry. So if you are a Bitcoin maximalist, you have to convince the rulers of this world to stop buying ETH.
But we are here to make money; we don't care about the crypto technology, which is too restricting anyways. Worse than paper money or fiat or gold. Let's be honest, if there were no charts and no trading on cryptocurrency, no one would even talk about it, and the government would silently integrate this technology.
So I am very bullish on ETH in the short term, because the price is inside this ascending channel and is breaking out with strong bullish momentum. Of course you don't want to buy the top and sell the low. We are somewhere in the middle, so if you buy now, sell at 5500 USDT. This is where the market will most likely stop for a long time before going higher.
We are in an alt season because BTC.D is going down! That means some altcoins can 10x or 50x in the next weeks. This is very important - Write a comment with your altcoin + hit the like button, and I will make an analysis for you in response. Trading is not hard if you have a good coach! This is not a trade setup, as there is no stop-loss or profit target. I share my trades privately. Thank you, and I wish you successful trades!

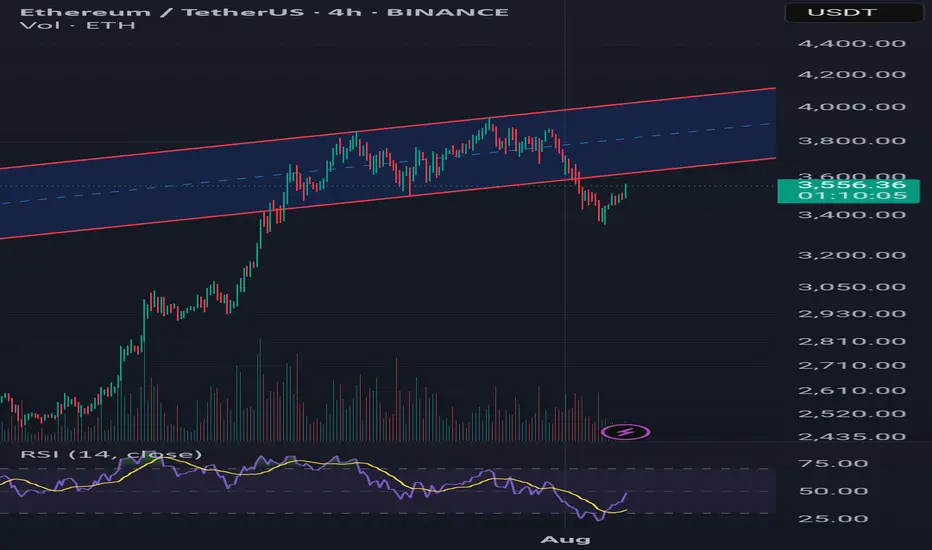
Ethereum at Critical Retest – Pullback or Breakout?Ethereum saw a sharp rally followed by a steady climb inside a rising channel. Recently, price broke below the channel’s lower boundary, signaling potential weakness. Now, ETH is retesting the broken trendline, which could be a classic pullback scenario.
Scenario 1 – Bearish Continuation:
If ETH fails to reclaim the channel and rejects around $3,600–$3,650, selling pressure may return.
Potential targets: $3,400 → $3,250 and, in extension, $3,050.
RSI is recovering from oversold levels but still below midline, hinting at possible limited upside before another drop.
Scenario 2 – Bullish Reclaim:
A daily close above $3,650 with strong volume would invalidate the breakdown and suggest a false break.
In that case, ETH could re-enter the channel and aim for $3,850 and the upper boundary near $4,050.
Risk Management:
Bearish entry: Wait for rejection candle on retest → SL above $3,700.
Bullish entry: Wait for confirmed breakout above $3,650 with volume → SL below $3,550.
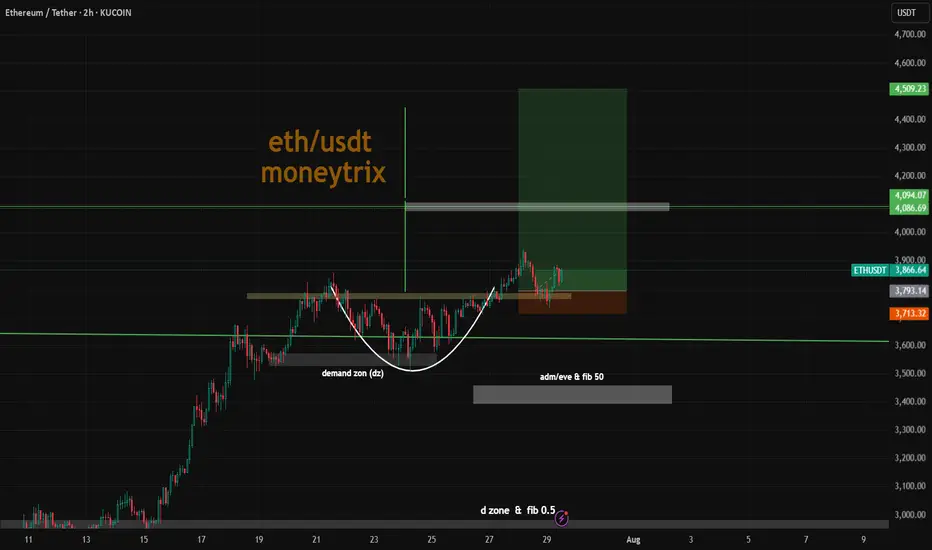
Combining a "cup and handle" pattern with a long position on ETHCombining a "cup and handle" pattern with a long position on ETH/USDT is a classic bullish technical analysis strategy. Let's break down what this pattern signifies and how to approach it for a long trade.
Understanding the Cup and Handle Pattern
The cup and handle is a bullish continuation pattern popularized by William J. O'Neil. It suggests a period of consolidation followed by a breakout to the upside, signaling a likely continuation of the prior uptrend.
Disclaimer: Technical analysis patterns like the cup and handle are tools, not guarantees. Always combine them with sound risk management and your overall trading strategy. Past performance is not indicative of future results.
Ethereum (ETH): 2 Successful Trades | Targeting Now $4800Ethereum was so close to $4K that we considered it basically reading the target; now we set a new target and a new entry for us as well.
We are looking for a complete breakout to happen from the region of $4000, which then would open for us an opportunity for a bullish move towards the $4800.
Swallow Academy

$ETH BREAKOUT FROM $4K IS A MATTER OF TIMEMomentum is in our favour — and this time, it's technically undeniable.
📈 MACD is at the highest levels it's ever been while testing $4K — signaling explosive breakout potential.
Weekly close above $3,959.55 confirms a breakout of a 28-month-long horizontal structure.
Once that’s in — it’s price discovery mode.
🎯 Targets:
→ $5,245 (0.5 Fib)
→ $6,530 (-1 Fib)
→ $9,101 (-2 Fib)
→ $11,673 (-3 Fib)
🟥 Invalidation:
→ Weekly close below $3,352
→ Bearish MACD crossover
Volume rising, structure clean, and momentum fully aligned.
This is the perfect storm for a macro leg to $10K+.

Long here.Genius I know right.
I though I was special calling for a big drop on XPR and closed out a nice trade to start my week with my morning coffee here in NZ.
Of course I look at the rest of the market and see that the drop was clearly across the board. I don't feel as special, but still happy. And will be really happy if we are close to a support level on ETH after this 10% drop. I am already in long with some size and ready to average into a much bigger long position. This is where I am happy to not run close stops, size up without crazy leverage and let my liquidation point act as my stop. Very rarely, but this is a very good opportunity in my opinion. Just be mindful to have a plan if we go lower, but I think we will retrace back up to $1687 within the next couple of hours.

EtherumEth is in bullish trend
on 1D TF there was a bearsish divergeanc which create a correction
scrip has taken support from 0.5 fib level and bouncing back now.
apprently it is forming a flag pattern and it can hit target of 4500 soon.

The Loudmouth Pattern: It Yells, We Trade!
On the 30-minute chart, ETH is forming a classic Broadening Formation – or as some traders like to call it, “The Big Mouth Pattern” 😄. It’s noisy, unpredictable at first glance, but when it speaks, you’d better listen.
Right now, price is moving through the bullish leg of this setup, and if momentum holds, we’re eyeing the $4,000 psychological level, followed by the $4,120 – $4,170 supply zone.
🔹 Bullish Scenario (our expected outlook):
🎯 Target 1: $4,000
🟩 Main Resistance: $4,120 – $4,170
❌ Invalidation: Confirmed close below $2,946
If price breaks and holds below that red support zone, this setup gets thrown out the window.
📊 Risk Management:
Scale in on pullbacks – if structure remains valid
No chasing without confirmation
Keep risk under 1% of total capital
📈 The market’s big mouth is open – and until it closes below $2,946, we’re listening for bullish signals. 🤑

Ethereum's futile attempt to go up.Ethereum’s pointless push and unnecessary insistence on going up — if it really wants to hit a new ATH, it needs to drop first, both to take a breather and to let buyers with lower buy orders get into the game.

ETH | NEW ATH or DUMP ?Ethereum recently peaked at $3900. And allthough this is not a new ATH (close by a few hundred dollars), it is a local high for the year.
My last update was on an inverse Head and Shoulders pattern on ETH, which has since increased over 50%:
(The original idea here:)
The question now, is what's next for ETH - further increase, or are the increases over for the near term and is a correction more likely?
I'm going to say that the increases for ETH are over for now. This is because we correction is most definitely due after such a large increase in a fairly short timeframe. I'm not saying we're heading into a full out bearish cycle, but a 20-25% correction would be most normal at this point.
Additionally, XRP has also made it's peak and lost the high, now trading just under $3. This is a strong sign that the alts have likely already rallied, since XRP used to be the last to increase (if it increased at all, historically. (Thanks Jedd).
I was very lucky to call that top here:
Either way, buyers may use this correction to scoop up on smaller alts over the next few weeks. This ultimately depends on whether the market has ONE MORE pump, and if the correction will bounce back from a 20-25% pullback.
_________________
BINANCE:ETHUSDT

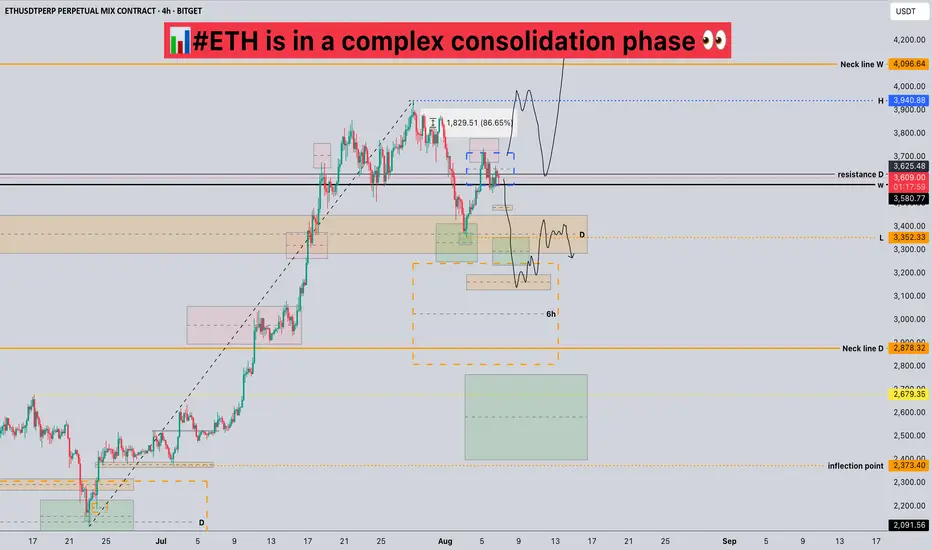
#ETH is in a complex consolidation phase📊#ETH is in a complex consolidation phase 👀
🧠From a structural perspective, the previous long uptrend has ended, so we should be wary of a deeper correction. We are currently in the middle of a complex consolidation, so there are many contradictions.
➡️Thus, if you want to participate in a long trade, you need to patiently observe whether this period of sideways consolidation can continue and a bullish structure can be established.
➡️If you want to participate in a short trade, you need to patiently wait for a break below the yellow support zone on the daily chart. This will then turn into resistance, and then look for short signals within that resistance zone.
🤜If you like my analysis, please like 💖 and share 💬
BITGET:ETHUSDT.P
ETH(20250806) market analysis and operationAugust 6th ETH Contract Technical Analysis:
Today, the daily chart showed a small bullish candlestick pattern yesterday, with prices rising continuously. However, the accompanying indicator formed a death cross. Monday's gains were not followed by a significant pullback on Tuesday. Therefore, it is difficult for both upside and downside to continue, and the trend remains range-bound. Until a breakout occurs, maintain a short-term strategy of selling high and buying low. On the hourly chart, yesterday's US session continued the downward trend of the European session, correcting the current bearish candlestick pattern. The accompanying indicator formed a death cross with shrinking volume, suggesting a high probability of a pullback during the day. Focus on the upward pressure around the 3700 high.
Today's ETH Short-Term Contract Trading Strategy:
Buy on pullbacks to the 3590 area, with a stop loss at the 3560 area, and a target of the 3650 area. Sell on pullbacks to the 3670 area, with a stop loss at the 3701 area, and a target of the 3605 area.

Bitcoin, Ethereum & Market Indexes
🔻 🚀 Bitcoin, Ethereum & Market Indexes 🔍
💎 HWC (1D) – MWC (4H) – LWC (1H) Cycle Analysis
⭕️ Structural Review: TOTAL, TOTAL2, TOTAL3, BTC.D, USDT.D
🔥 analysis Coins: BTC, ETH
📉 Strategy: Dow Theory + Fundamentals + Market Sentiment
🔥 Daily Market Analysis – July 31st 🔥
💎 Summary of Key News & Strategy:
✔️ Interest rates were officially held steady at 4.5% – as widely expected. However, Powell’s comments added slight bearish pressure to the market in the short term ❗️
✔️ It’s important to note: recent market growth happened with the same rate in place. So any positive economic news from the U.S. from now until September could trigger a Bitcoin pump 🚀
✔️ One major bullish catalyst: MicroStrategy purchased 21,000 BTC – a strong institutional support signal 💎
✔️ With the BTC monthly candle closing in a few hours, keep risk low and proceed with caution ❗️
✔️ if Volume is picking up in BTC and altcoin momentum is building. This opens up a strategic opportunity to enter long positions even before key breakouts in TOTAL, TOTAL2, and TOTAL3 🔥
♦️ BTC/USDT
Support 1: 115,000
Support 2: 111,000
Resistance: 120,000
Despite 2 days of bearish pressure, the overall BTC structure remains bullish
If the 120,000 level breaks with strong volume, we can use a stop-buy strategy to enter a long. Sellers managed to push down to 115,700, but buyers defended the level well.
⭕️ This volume near support can serve as early confirmation to enter altcoins.
🔥 Break of 120,000 is critical for sustained altcoin rallies.
♦️ BTC Dominance (BTC.D)
Watch for a breakout above 60.44 – if that happens, you should already be in altcoin positions 🔥
It still hasn’t broken the 62–62.36 zone, which remains supportive for altcoin strength ✅
♦️ TOTAL Market Cap
If we see signs of breaking 3.92, we should already be positioned 🔥
Key support: 3.71 – as long as the market holds above it, the long scenario remains valid 💎
♦️ TOTAL2
Open position should happen before a confirmed break of 1.54 ❗️
Waiting until after could lead to late and risky entries. Stay alert and responsive ✅
♦️ TOTAL3
Same logic – position before the 1.08 breakout. Entry afterward will be harder due to sharp candle and volatility ⭕️
♦️ USDT Dominance (USDT.D)
Currently attempting to break 4.40 but has not succeeded ❌ – this is good for buyers.
We should have long positions before any potential drop below 4.13 🔥
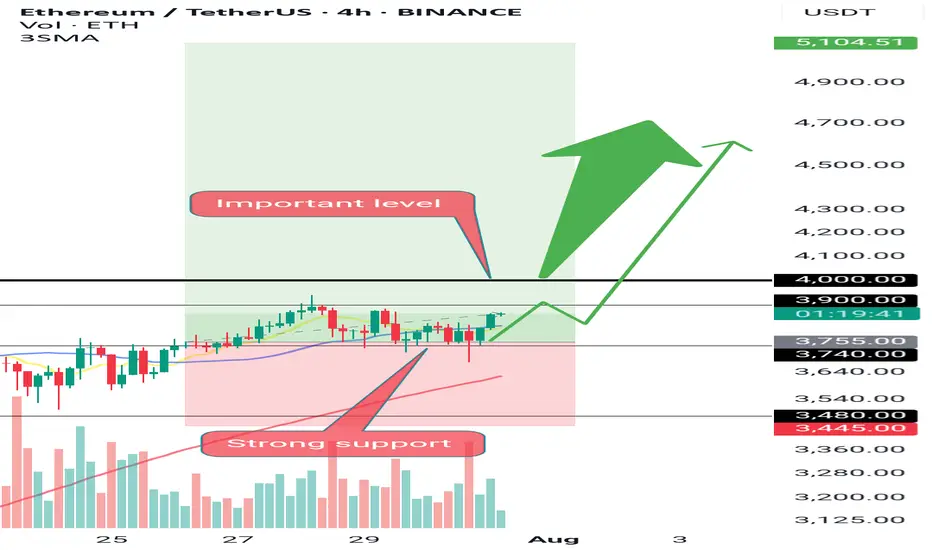
♦️ ETH / USDT
Buyers successfully defended the 3,750 support zone 💎
Given strong institutional interest, ETH has high bullish potential.
A break above 4,000 with powerful candles could kickstart the next bull run 🚀
✅ Early Entry Trigger: 3,858 – but only if ETH dips below this level first and returns back to it.
This gives us a tighter stop-loss and better risk/reward setup.
❌ If ETH blasts through 3,858 with a sharp candle, avoid chasing the move.
⭕️ Additional confirmations:
• ETH/BTC should break 0.3277 to confirm ETH strength
• ETH.D should break 12.16 for final validation
Most likely, ETH.D and ETH/BTC will give early confirmation before ETH/USDT breaks 3,858 ✔️
💥 If you found this helpful, don’t forget to FOLLOW and smash that 🚀 button for more daily insights! 💎
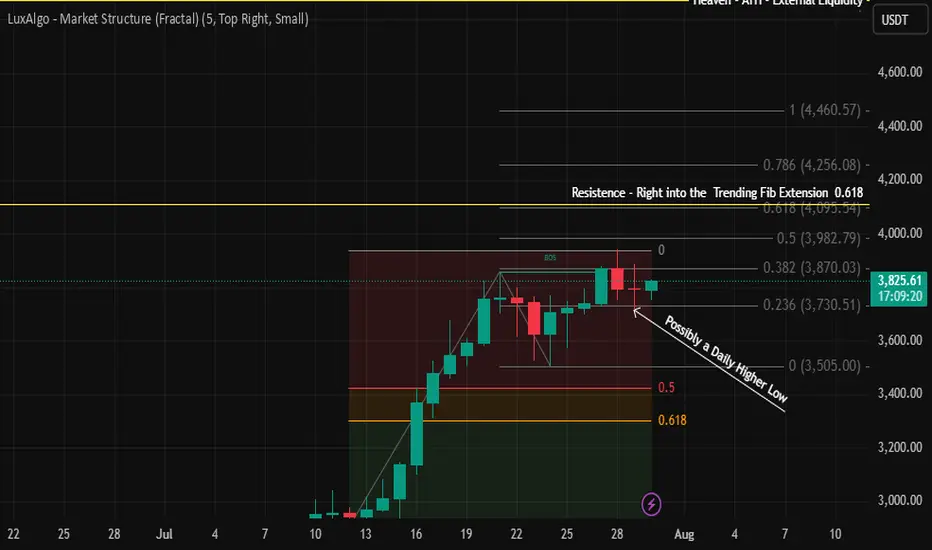
ETH to 4095 level this week??Next major resistence if it forms a daily higher low is right into the trend Fib ex .62.
Interesting to watch where ETH goes next.
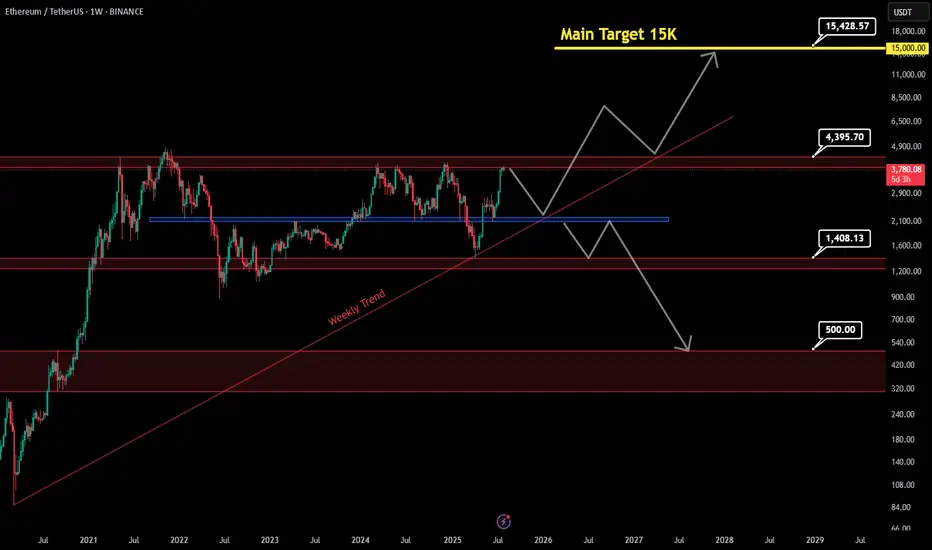
Ethereum to 15K ? or fall to 500$ !!📊 Ethereum – Long range outlook
If the price manages to break the red resistance zone above and hold above it, the path will be poised to reach the main target at $15,000, as shown by the rising arrows. If it fails, it has another opportunity to regroup buyers from the resistance at $2,228, with a very important trend that will support the upward move.
If the price fails to break the rebound from $2,227, closes this area ($2,227), and then breaks the weekly trend, we expect a sharp drop to $1,408 and even $500 in the long term.
Main Target : 15,000$
ETH Bearish DivergenceBINANCE:ETHUSDT
Rezistance Levels: 3,943.44.
Support: 2,111.83
Trade Setup:
Target 1: 3,027.64 (0.50 Fibonnaci Golden Zone).
Target 2: 2,811.51 (0.618 Fibonnaci Golden Zone).
Target 3: 2,503.80 (0.786 Fibonnaci Golden Zone).
Target 4: 2,111.83 (1 Fibonnaci).
Stop Loss: 3,943.44 (above recent high, ~25% above current price).
RSI Analysis: The RSI shows a bullish divergence (price making lower lows while RSI makes higher lows), suggesting potential upward momentum. Current RSI is around 80.39, nearing overbought territory (>70), so caution is advised.

ETHUSDT short positionhi traders
🔻 Short Position Setup – Overextended at Resistance
ETH/USDT is currently trading near a major resistance zone (~$4,080–$4,330), which historically marks the top of the trading range. This level has acted as strong resistance multiple times in the past, and price is now showing signs of overextension after a sharp upward move.
📊 Technical Indicators
RSI (14): Currently overbought at 77.44, with the moving average at 81.65 — levels that have previously led to pullbacks.
Volume: Elevated during the move up, but may begin to taper as momentum slows into resistance.
🧭 Trade Strategy: Short From the Top
Entry Zone: Around current levels near $4,080–$4,330
Rationale: Shorting the top of the range with overbought RSI, expecting a retracement or range rejection
🎯 Target Zones (Take-Profit Levels)
We are monitoring multiple support levels for potential profit-taking:
TP1: $3,494
TP2: $3,133
TP3: $2,827
TP4 (max target): $2,354–$2,363
⚠️ Important Note: Although we’ve identified several potential targets, we expect to close the short position earlier — depending on how the price behaves during the retracement. We'll monitor market structure, volume, and lower timeframe signals on the way down.
🛡️ Risk Management
Stop-loss: Above the previous highs (~$4,330), to limit downside risk if the breakout is sustained
Regular monitoring is essential, as macro conditions and ETH sentiment can shift rapidly.
✅ Conclusion:
We're recommending a short trade at the top of a well-defined range, with confirmation from overbought RSI and historical rejection zones. The trade includes multiple targets, but it’s likely to be managed actively and closed partially or fully before reaching the final levels.
