ETH Weekly Flip ZoneETH on the Weekly
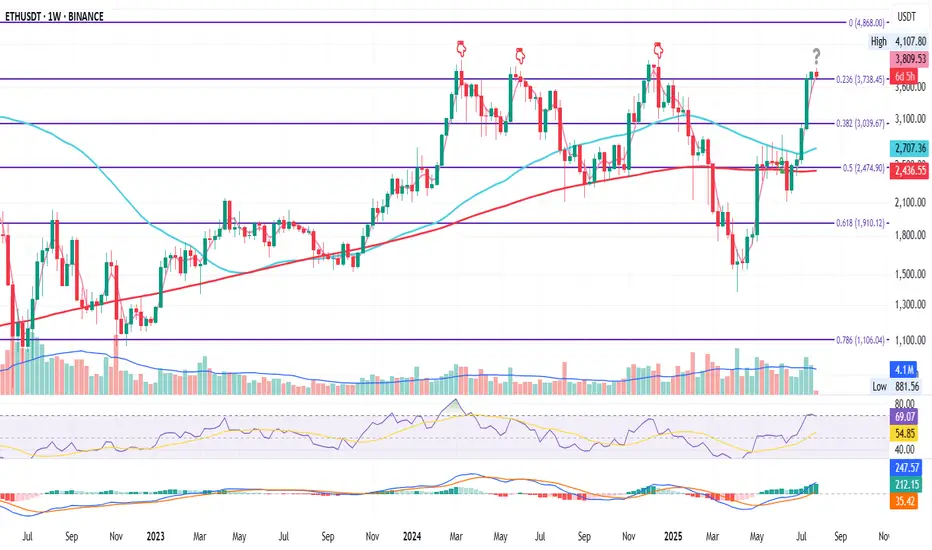
ETH just closed the week above the 0.236 Fib level at $3738.45.
It’s the fourth attempt to conquer this zone since the June 2022 bottom.
If price holds above this level, the odds of continuation increase.
If it fails, we could see downside.
It may also just consolidate here for a while.
RSI just touched overbought, and MACD remains green — still some room for upside.
I remain bullish long term, but this looks like a smart area to manage risk if you’re late to the move, or take partial profits.
Always take profits and manage risk.
Interaction is welcome.
ETHUSDT trade ideas
ETH/USDT (Monthly) – Symmetrical Triangle BreakoutPattern & Technical Setup
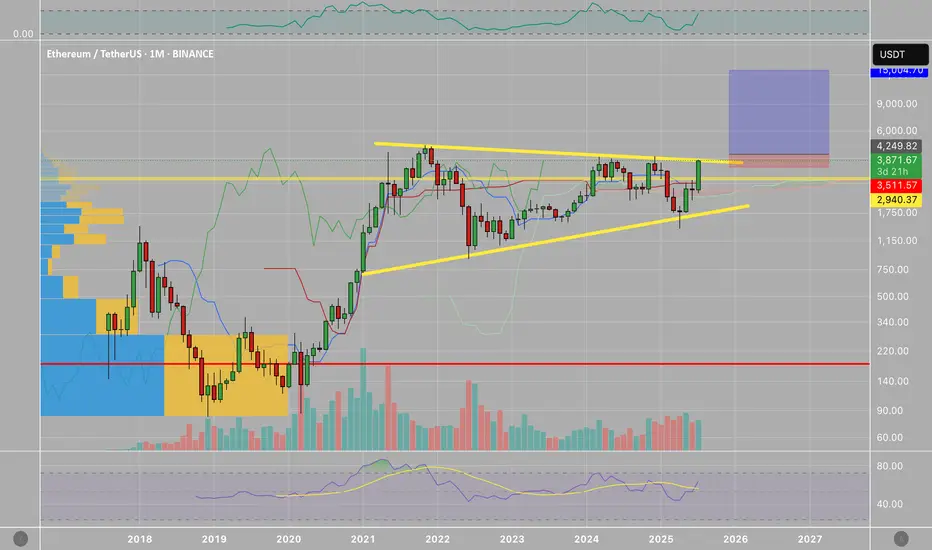
Ethereum (ETH/USDT) is showing a textbook symmetrical triangle pattern on the monthly chart. The pattern has been developing since the 2021 high, with lower highs converging with higher lows.
The current candle has broken out above the triangle’s upper trendline, suggesting a potential bullish continuation. This breakout is significant given the long consolidation period and strong volume profile near the breakout zone.
Trade Plan
• Entry: Around $4000 on confirmed monthly close above triangle.
• Stop Loss: Below $3,500 (safe side under breakout + previous support).
• Profit Targets:
$4,800 (measured move target based on triangle height)
⸻
Risk & Reward
• Risk: ~17% downside (stop at $2,950)
• Reward: ~253% upside to $4,800
• R/R Ratio: ~14:1 (favorable for swing trade)
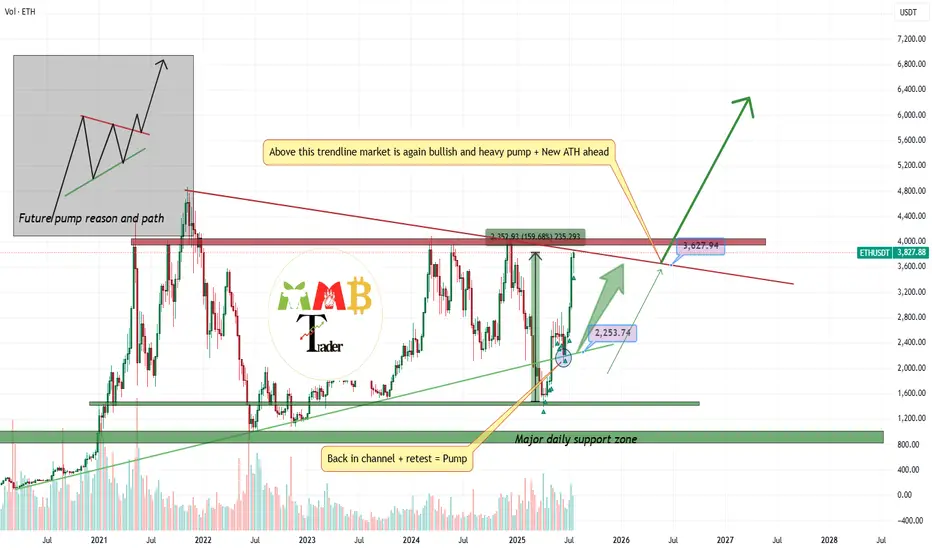
ETHUSDT market is ready to explode and PumpAs we mentioned before Price is now near weekly resistance and range and even short-term fall here is expected but this time i am looking for breakout to the upside and huge pump after that like the green arrows on chart.
So get ready and wait for that breakout and next phase of bull run to start soon.
DISCLAIMER: ((trade based on your own decision))
<<press like👍 if you enjoy💚
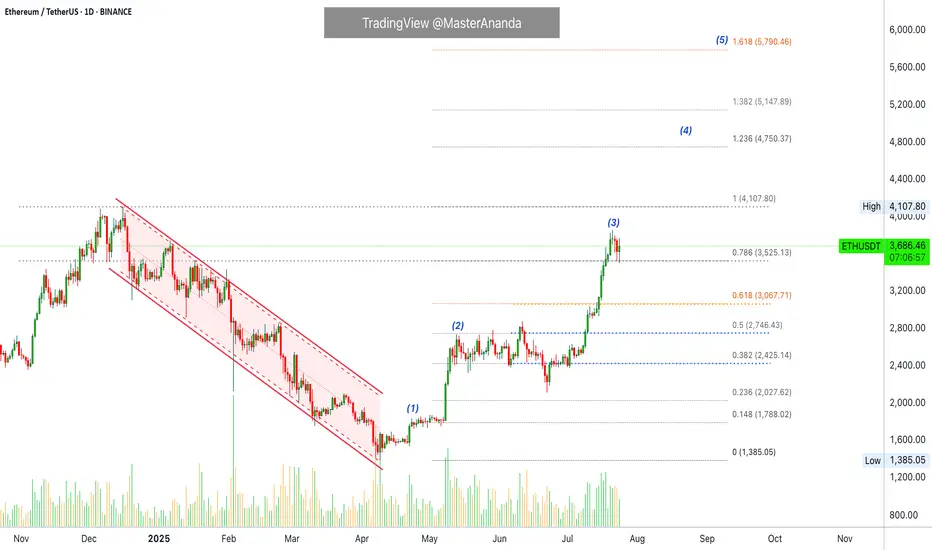
ETH at final leg of 5th WaveAre you Ready to Touch 4000$ and start BIG Drop?
ETH is in final reound of 5th wave of 5th, 5 of 5. After that I expect a BIG drop

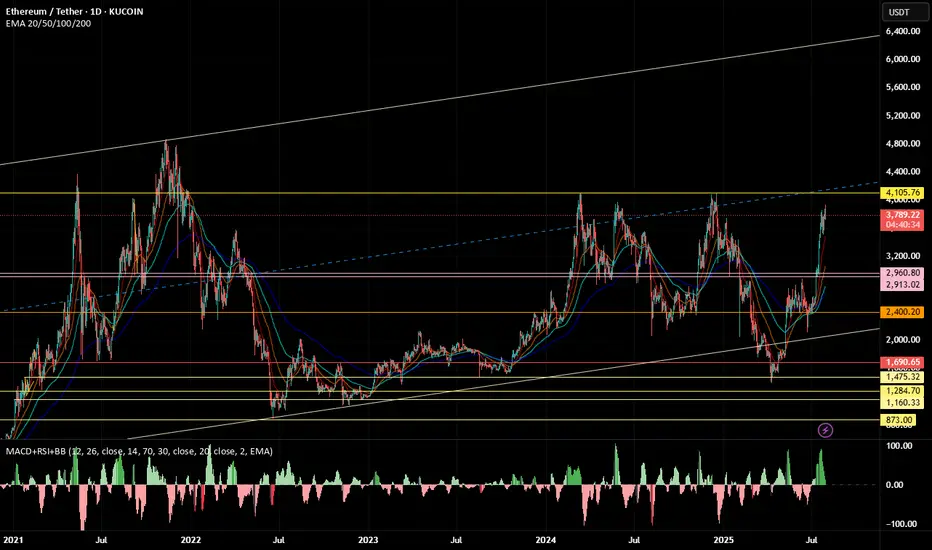
ETH Analysis (1W)Here I am, presenting the asset I personally dislike the most — ETH.
But the chart doesn’t care about feelings. ETH looks ultra bullish, but only if it breaks above the $4,125 level.
Why this level?
The $3,800–$4,100 range has historically acted as a major distribution zone — a place where market participants have consistently taken profit for years.
If this resistance is finally broken, we could see ETH rally toward $6,900 as a minimum target.
This level is based on the breakout projection of the long-standing macro structure.
Honestly, the target looks even better than the asset itself :)
Good Luck.

ETH what is next !This chart displays the weekly price action of Ethereum (ETH), which is currently retesting a key resistance zone around the $4,000 level. This area has acted as a major barrier since 2021, rejecting price multiple times and preventing further upside.
Now, ETH is once again approaching this critical level. If we can get a decisive breakout and a strong weekly close above $4,000, it could signal the beginning of a significant bullish move.
A confirmed breakout could open the door to a rally toward the previous all-time high near $4,860. If momentum continues, the Fibonacci extension points to a long-term target around $13,898 — the 1.618 extension level.
In summary:
👉 A breakout and close above $4,000 could mark the start of a strong bullish trend, with potential targets at $4,860 and $13,898.
Until that breakout is confirmed, though, we remain at a key resistance zone — so it's important to stay cautious.

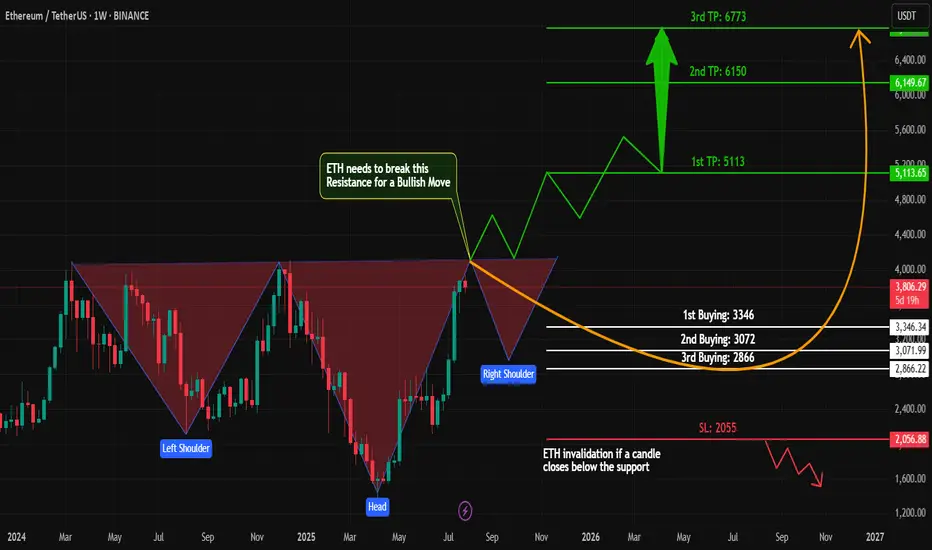
ETH Bullish – Inverse Head & Shoulders Pattern on Weekly Chart!Technical Analysis (Weekly Timeframe)
#Ethereum (ETH) is currently forming a strong bullish structure – the classic Inverse Head & Shoulders pattern – on the weekly chart.
✅ Left Shoulder ✅ Head
🟡 Now Printing the Right Shoulder...
This is a long-term spot trade setup, not for futures.
📈 Key Buy Zones:
1️⃣ First Buy: $3,346
2️⃣ Second Buy: $3,072
3️⃣ Final Support Buy: $2,866
We'll accumulate in these zones as #ETH forms its Right Shoulder.
🔓 Breakout Play:
Once #ETH breaks its All-Time High (ATH), we'll place a Buy Stop Order above the breakout level to ride the next big wave!
💬 Let me know what you think about this #ETH setup.
📌 Are you bullish on #ETH this cycle?
👍 Like, share & follow for more high-probability setups!
#ETH #Ethereum #CryptoTrading #TechnicalAnalysis #InverseHeadAndShoulders #LongTermTrade #SpotTrade #BullishCrypto #Altcoins #TradingView
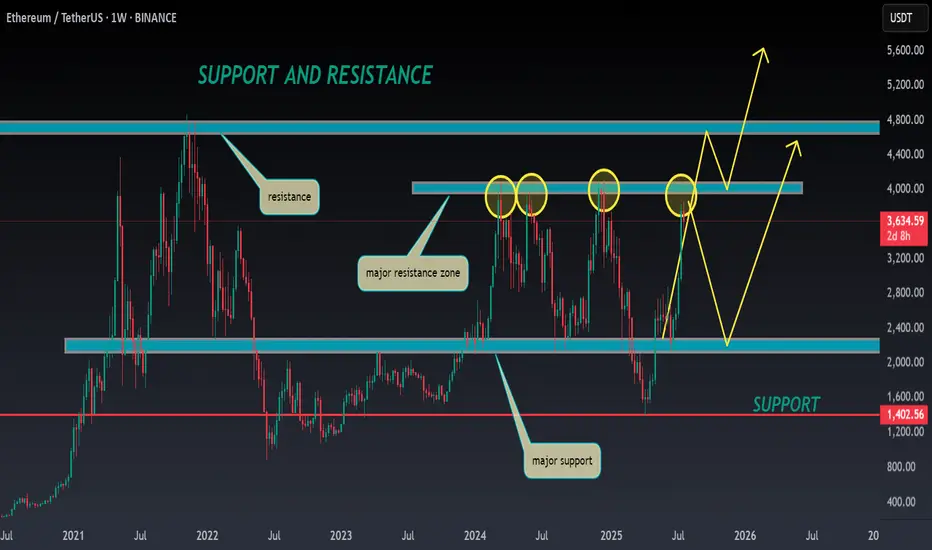
ETH ANALYSIS🔮 #ETH Analysis 🚀🚀
💲💲 #ETH is trading between support and resistance area. There is a potential rejection again from its resistance zone and pullback from support zone. If #ETH breaks the major resistance zone then we would see a bullish move
💸Current Price -- $3634
⁉️ What to do?
- We have marked crucial levels in the chart . We can trade according to the chart and make some profits. 🚀💸
#ETH #Cryptocurrency #DYOR
Ethereum is likely to retrace before continuing its bullish moveEthereum's technicals are highly bullish, supported by strong fundamentals. According to the market structure, it may retrace to the level shown in the chart above to collect liquidity and fill orders before moving forward to All time high near 4800.

EthusdNot discounting the potential for a dip into the August montly open...
Retesting the trend line break for a second time..
Then we enter etf bid war phase.. multiple companies attempting to emerge as the strategy b of ethereum.
Bitmine and sharplink are leading but there's about 10-30 companies starting to accumulate heavily..

Ethereum destroyed resistance at the $3700 level ┆ HolderStatBINANCE:ETHUSDT remains stuck between $3,260 and $3,320, forming a tightening range with bullish undercurrents. Price is holding a higher low and consolidating under resistance, hinting at re-accumulation. A breakout above $3,325 could send ETH toward $3,400+ in short order. Bulls remain in control above $3,260.
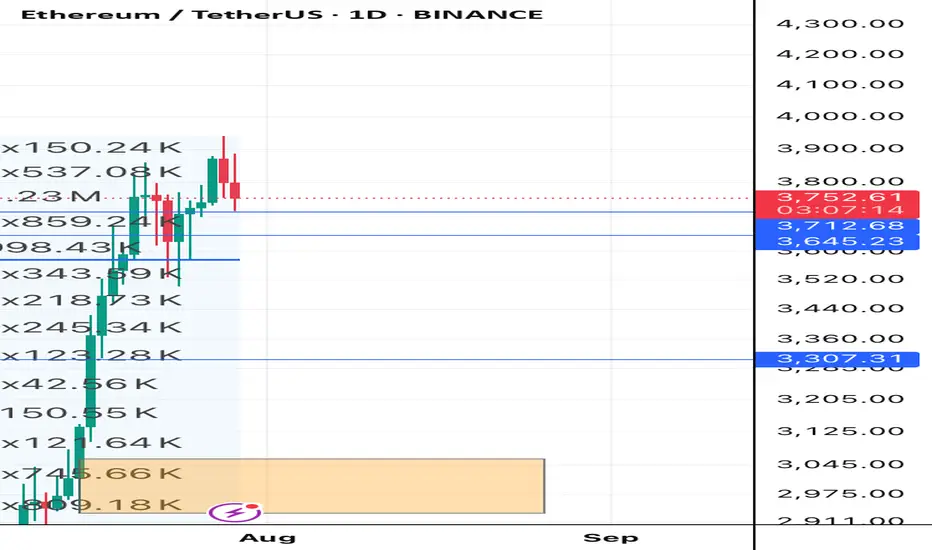
Weekly trading plan for EthereumLast week's BINANCE:ETHUSDT price action performed perfectly according to our scenarios - hitting our first target and establishing a new local high. Currently, price remains above the weekly reversal level at $3,751, maintaining potential for an advance toward Resistance #2.
Key Considerations:
While above $3,751 → Resistance #2 remains in play
Break below reversal level + trendline → Likely retest of last week's low
Such breakdown would likely breach both primary support levels
Trade Plan:
Bulls: Watch for continuation above $3,751
Bears: Require confirmed break of trendline + reversal level
As always, confirmation is key - trade the breaks, not the anticipations

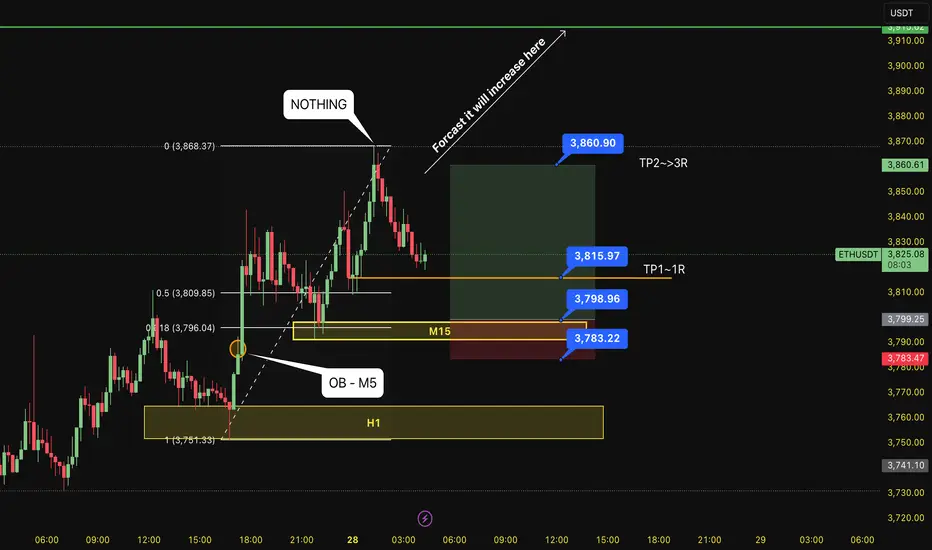
BUY ETH 28.7.2025Confluence order: BUY at M15
Type of order: Limit order
Reason:
- The current top is not touching anything, expected to rise to the H1 above.
- M15~FIBO 0,5-0,618 (same position)
Note:
- Management of money carefully at the last bottom (3,815)
Set up entry:
- Entry buy at 3,798
- SL at 3,783 (below OB NOT USED of M5)
- TP1: 3,815 (~1R)
- TP2: 3,860
Trading Method: Price action (No indicator, only trend and candles)
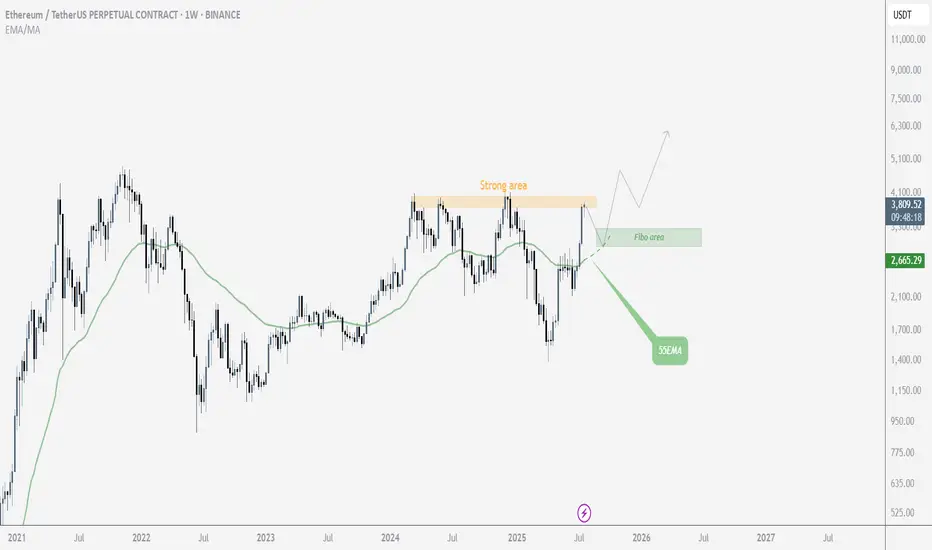
$ETH Mid-TermLooking at Ethereum from a mid-term perspective, it’s currently sitting near its price ceiling, suggesting a potential need for a correction. Of course, it’s also possible that this level could be broken, depending on overall market conditions. However, the primary scenario is that it fails to break through and pulls back, with the potential reversal zone identified based on Fibonacci levels. On the other hand, the 55 EMA is also providing solid support.
If Ethereum manages to break above this resistance, then we'll wait for either a confirmation or a pullback before entering a long position
Ethereum will retest $3,500 ┆ HolderStatOKX:ETHUSDT bounced from $2,875 and is approaching $3,100. Breakout may target $3,250 next. Bullish structure remains.

ethereumI think Ethereum is ready for a historic bull run, it has collected almost all the lower stops and has done everything right in terms of the right trend pattern. But from a fundamental perspective, with the arrival of President Trump and the launch of Ethereum ETFs, we can see a historic growth for Ethereum from a fundamental perspective, but we have to wait for the right pattern for the entry point. I will specify a few ranges for you, and my expectation is that Ethereum will be at $20,000.
ETH to $6500?Have had this chart created for a while since before 2020, now loading it back up looks like everything is going as planned. ETH has to reach its ATH again around 4800 then it shoots to prices discovery, it will forsure run through 5000$ so $6500 becomes a target afterwards.
Ethereum Turns 10 Amid Bullish News and Institutional AccumulatiJuly 23, 2025 - World Liberty Financial a crypto project linked to U.S. President Donald Trump spent millions to acquire more Ethereum and acquired more than 3,400 ETH
July 29, 2025 - World Liberty Financial purchased 256.75 ETH for $1 million
July 29, 2025 - The mining company BitMine, which has adopted the strategy of accumulating Ethereum (ETH), presented the results of a study according to which the cost of replacing Ethereum is $60 thousand. The current price of the altcoin is 15 times lower, it fluctuates around $3.8 thousand
Against the backdrop of such strong news, tomorrow July 30, 2025 ETH will have a bile tomorrow, 10 years since the coin was created
Ethereum has tried to break through the $4,000 mark and stay there 4 times already
Against the backdrop of such powerful news, it is clear that institutional investors are clearly preparing for the fact that the coins will grow in the long term, and for some time to strengthen on new ATN
In the near future, you can focus on the $4100 and $4200 marks
Also, you should not bet on growth, a correction from the current marks to $3600 is always possible
AI-powered charting tools and news sentiment analyzers indicate a continued bullish trend

ETH Update – Eyes on the $3,820 Zone📈 ETH Update – Eyes on the $3,820 Zone
Ethereum is showing bullish momentum, and there’s a strong chance it could rally toward the orange resistance line around $3,820.
If price breaks above this level, the next target will be the blue trendline, marking the next key resistance.
🚀 Stay ready — momentum is building.
🔔 Follow for more clean setups and real-time analysis!

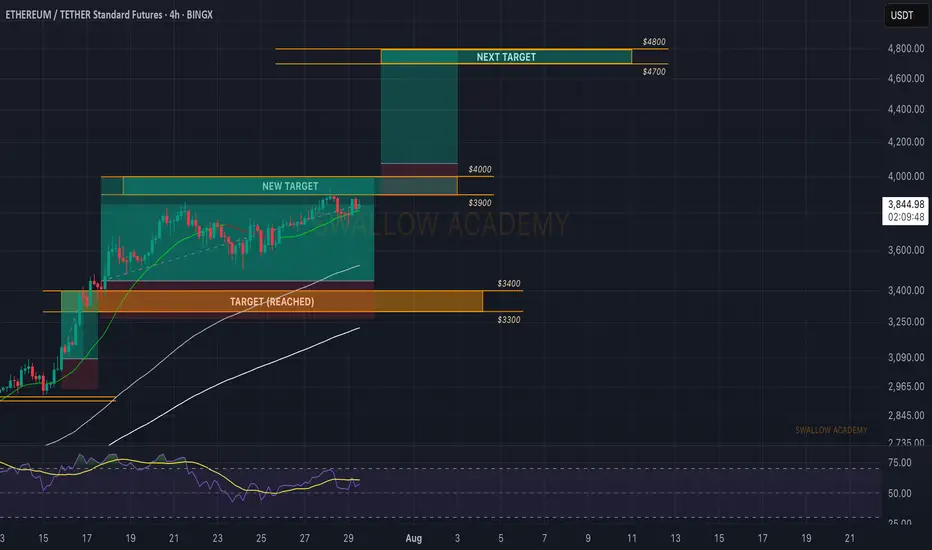
Ethereum (ETH): Approaching $4000, Targeting Next $4800Ethereum is still below our current target, which is $4000. Soon to approach it, we are looking for a breakout from there and another trade to be opened right after the breakout.
The game plan is simple: 1 trade has been successfully closed, and the second one is almost near the target. Now waiting for the third one to be activated!
Swallow Academy
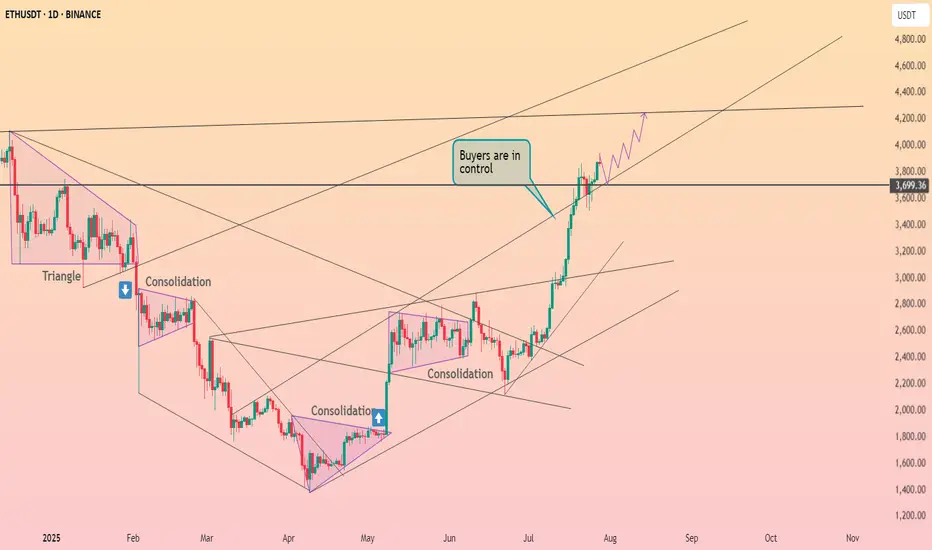
Why Ethereum Will Continue Growing · Trading Above ResistanceEthereum started its latest bullish on the 9th of April. Each advance has been preceded by a period of consolidation.
ETHUSDT (Ether) recovered from its bottom range 23-April, immediately it went sideways for 14 days before moving forward (1). As soon as Ethereum reached $2,700, we have the same pattern but extended, more sideways before moving forward. See this as (2) on the chart. This time the consolidation period lasted 57 days.
The last advance was even stronger (3), Ethereum peaked at $3,860 and we can expect another sideways period, a pause, repeating the same pattern as before. Now, there is an interesting part. The first is a prediction: This consolidation period wont be as long as the second one. The second is related to resistance and support. Notice how ETHUSDT peaked above 0.786 Fib. and this level is being tested as support. The fact that bullish action managed to conquer this level and stop above it, not below, favors the bulls. This means that the market is strong and set to continue growing. There is no significant bearish volume on the red days and the action is neutral so we can expect an advance; the next high will be a new all-time high. We will name it (4) on the chart.
This price pattern should repeat giving us additional growth. After a new all-time high, there will be resistance shy of 6K. And then we expect higher prices with Ethereum peaking around $8,500. Depending on how this level is handled, we can look for $10,000 or even $11,000.
Right now the chart is bullish and points higher.
Continue to hold long-term. It is still too early to fold; it is too early to sell. We are going higher.
Thank you for reading.
Namaste.
ETH Buy Idea📈 Setup Summary:
Ethereum (ETHUSD) is breaking out of a multi-week consolidation with rising volume and strong bullish momentum. Price has reclaimed key moving averages, and sentiment has shifted favorably across crypto markets.
📊 Entry & Risk:
• Entry Price: $3,860 - 3870
• Stop: $3,470
🧠 Macro Catalyst: Spot ETH ETFs Are Coming
• The SEC is reviewing multiple Ethereum Spot ETF applications from BlackRock, VanEck, ARK/21Shares, and others.
• Market expects approvals Q3–Q4 2025, mirroring the prior surge seen in BTC after IBIT and similar ETFs launched.
• A successful launch could unlock institutional ETH flows, driving significant upside.
🟢 Adding ETF tailwind to technical breakout = high-conviction swing trade.
🚀 Momentum Signals:
• RSI & MACD bullish cross on daily
• Increasing volume on breakout
• ETH outperforming BTC (ETHBTC ratio turning up)
• Crypto market as a whole showing risk-on tone
DISCLAIMER : The content and materials featured are for your information and education only and are not attended to address your particular personal requirements. The information does not constitute financial advice or recommendation and should not be considered as such. Risk Management is Your Shield! Always prioritise risk management. It’s your best defence against losses.

Ethereum Charts Aligning for a Major BreakoutI analyzed Ethereum on both the monthly and 2-week timeframes, and the structure looks strong.
On the right side, we have the monthly chart, where ETH has printed a bullish Morning Star pattern right off the key support trendline.
This is a classic reversal signal, and price is now approaching the upper resistance zone. A breakout from here could trigger a major rally, similar to what we saw in 2020.
On the left side, the 2-week chart shows CRYPTOCAP:ETH pressing into a critical resistance zone after a strong bounce. If price breaks and holds above this zone, it could open the doors to $6K–$8K targets in the coming months.
ETH is showing strength, now we wait for confirmation from the breakout.
Thanks for reading!
