You thinking of buying ETH ? read this first
There is a saying- "Charts NEVER lie"
And here it is
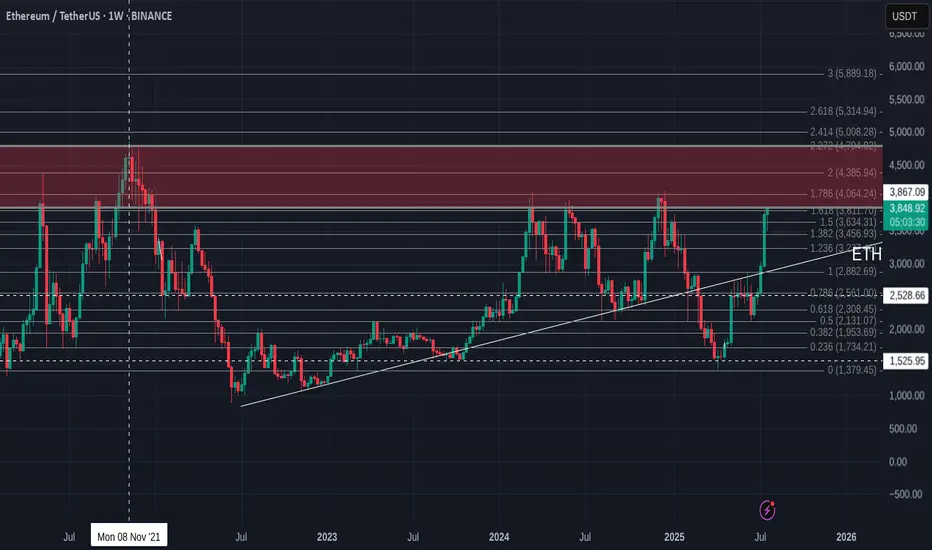
ETH USDT Weekly chart, suggesting that, right now, ETH is up against resistance that has rejected it more times than it has been support.
The RSI on this chart also suggests a pull back is coming
Again, RSI has been rejected in this range more times than it found support
Conclusion -WAIT before you buy and see if it crosses that line of resistance and tests it as support before you spend your money
Just saying
ETHUSDT trade ideas
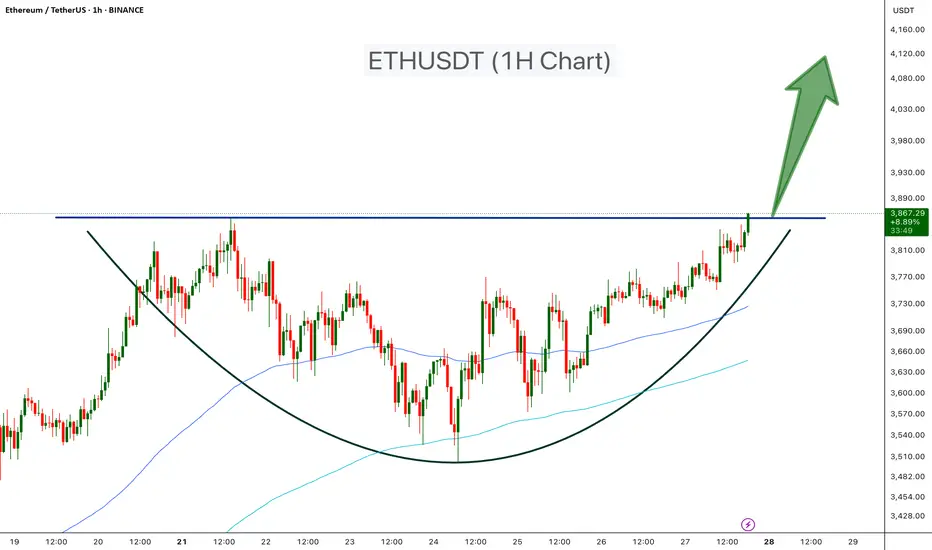
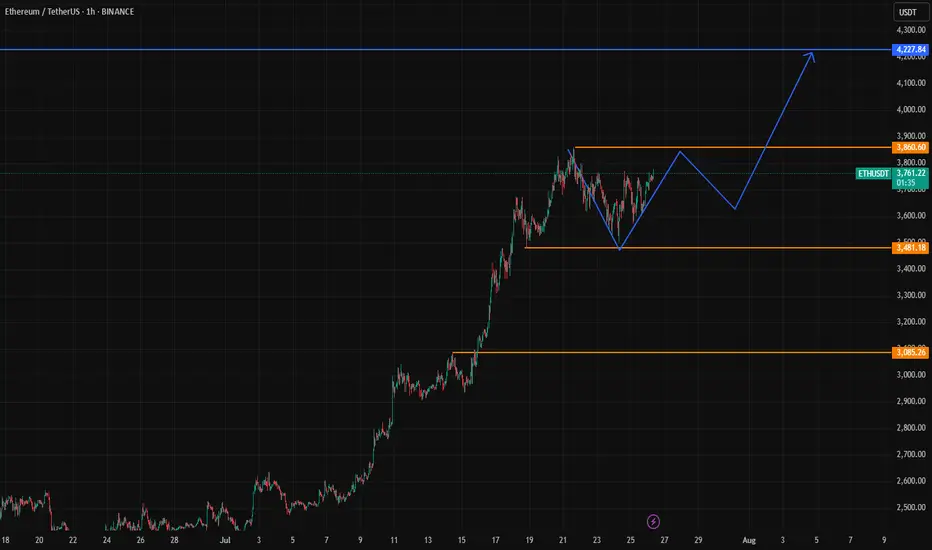
ETHUSDT Classic Cup PatternEthereum is forming a textbook Cup pattern on the 1H chart, signaling a strong bullish setup. After a rounded bottom forming the “cup,” ETH is now pushing toward the neckline resistance around $3,870. A confirmed breakout above this level could lead to a powerful upward move.
Cheers
Hexa
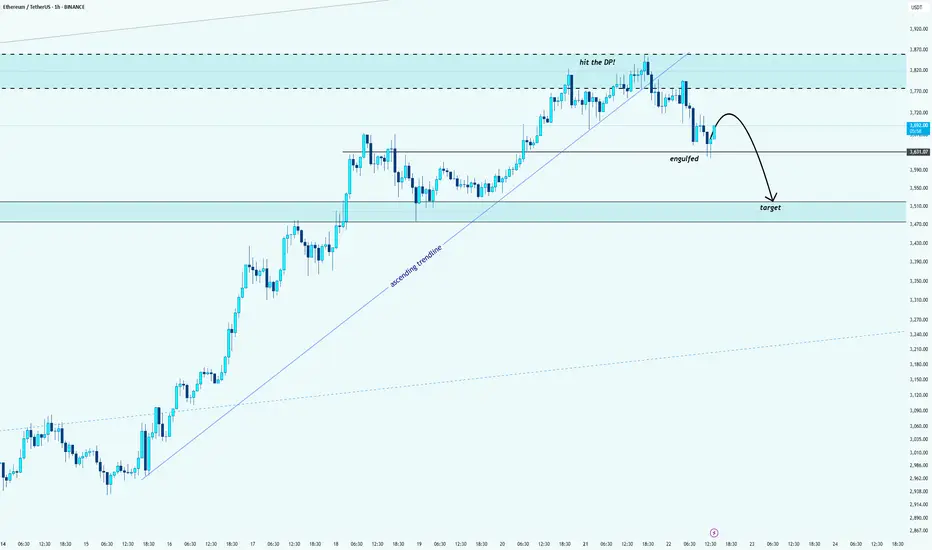
ETH/USDT: Bearish Reversal After Hitting the Decision PointHello guys!
After a strong rally, ETH finally hit the Decision Point (DP) zone marked above. Like what I said:
And we’ve already seen signs of rejection from that level.
🔹 The ascending trendline is broken
🔹 A key support got engulfed
🔹 Price is now forming a bearish structure
The target zone is mapped out around $3,500 – $3,470, where previous demand sits.
We might see a small pullback before continuation, but overall momentum is shifting downward.
Wait for confirmations and protect your capital
Ethereum (ETH) AnalysisEthereum (ETH), the second-largest cryptocurrency by market capitalization, continues to be a pivotal asset in the digital economy, driving the decentralized finance (DeFi), NFT, and Web3 ecosystems. Its price action is influenced by a combination of its own fundamental developments, the broader cryptocurrency market sentiment (primarily Bitcoin's movements), and macroeconomic factors.
1. Fundamental Strengths & Developments:
Ecosystem Growth: Ethereum boasts the largest and most vibrant ecosystem of decentralized applications (dApps). The majority of DeFi protocols, NFT marketplaces, and Web3 infrastructure are built on or heavily integrated with Ethereum. This network effect provides strong underlying demand for ETH as gas fees and collateral.
Scalability Progress (Ethereum 2.0 / Serenity): The ongoing transition to Ethereum 2.0 (now largely referred to as "Serenity" or simply "The Merge" and subsequent upgrades) is a critical long-term bullish factor.
The Merge (completed): The successful transition to Proof-of-Stake (PoS) in September 2022 drastically reduced Ethereum's energy consumption and introduced ETH staking rewards, making it a more environmentally friendly and yield-generating asset.
Shanghai/Capella Upgrade (completed): This enabled staked ETH withdrawals, reducing a major liquidity concern for stakers and attracting more participation in the staking mechanism.
Upcoming Upgrades (e.g., Danksharding, Proto-Danksharding): Future upgrades are focused on increasing scalability and throughput through sharding, which is crucial for lowering transaction costs (gas fees) and enhancing network capacity. Progress on these fronts generally bodes well for ETH's long-term value.
Deflationary Mechanism: EIP-1559, implemented in August 2021, introduced a mechanism to burn a portion of transaction fees. Coupled with staking, this can lead to a net deflationary supply of ETH during periods of high network activity, reducing circulating supply and potentially increasing value.
2. Price Action and Technical Considerations (General Outlook):
Correlation with Bitcoin (BTC): ETH's price often highly correlates with Bitcoin. A strong bullish trend in BTC typically pulls ETH higher, while a significant BTC correction usually leads to ETH declines. Observing BTC's technical structure (support, resistance, momentum) is crucial for predicting ETH's near-term movements.
Key Price Levels:
Support: Historically significant support levels often exist around previous highs or strong accumulation zones. These levels act as price floors where buying interest tends to emerge.
Resistance: Previous all-time highs or significant resistance zones (where selling pressure has historically been strong) act as ceilings. A decisive break above these levels, especially with high volume, can signal a continuation of an uptrend.
Market Cycles: Cryptocurrencies are highly cyclical. After periods of rapid price appreciation, consolidation or correction phases are common. These periods allow the market to digest gains, reset funding rates, and build new bases for future moves.
3. Macroeconomic and Regulatory Factors:
Interest Rates and Inflation: Higher interest rates and tighter monetary policies from central banks can reduce liquidity in financial markets, impacting risk assets like cryptocurrencies. Conversely, a more dovish stance can be supportive.
Regulatory Environment: Clarity or uncertainty from regulators (e.g., SEC in the US, MiCA in Europe) can significantly influence institutional adoption and overall market sentiment. Positive regulatory developments can instill confidence, while restrictive measures can cause FUD (Fear, Uncertainty, Doubt).
Global Economic Health: A robust global economy generally fosters a risk-on environment, which is favorable for crypto. Economic slowdowns or recessions can lead to risk aversion.
Outlook:
Ethereum remains a strong long-term investment given its foundational role in the decentralized web and its continuous technological advancements. The successful transition to PoS and ongoing scalability efforts are critical drivers.
Bullish Scenario: If the broader crypto market remains strong, Bitcoin maintains its uptrend, and Ethereum continues to deliver on its roadmap (e.g., successful sharding implementations), ETH could target new all-time highs. Increased institutional interest, ETF approvals (for ETH directly or indirectly), and sustained DeFi/NFT activity would further fuel this.
Bearish Scenario: Significant macroeconomic headwinds, a prolonged downturn in Bitcoin's price, major regulatory crackdowns, or unforeseen technical issues with Ethereum's upgrades could lead to a correction.
Conclusion:
Ethereum's value proposition is robust due to its vibrant ecosystem and relentless development. While short-term price movements will be influenced by market sentiment and macroeconomic factors, its long-term trajectory appears promising as it continues to solidify its position as the backbone of the decentralized future. Investors should closely monitor Bitcoin's price action, Ethereum's development milestones, and broader economic indicators.
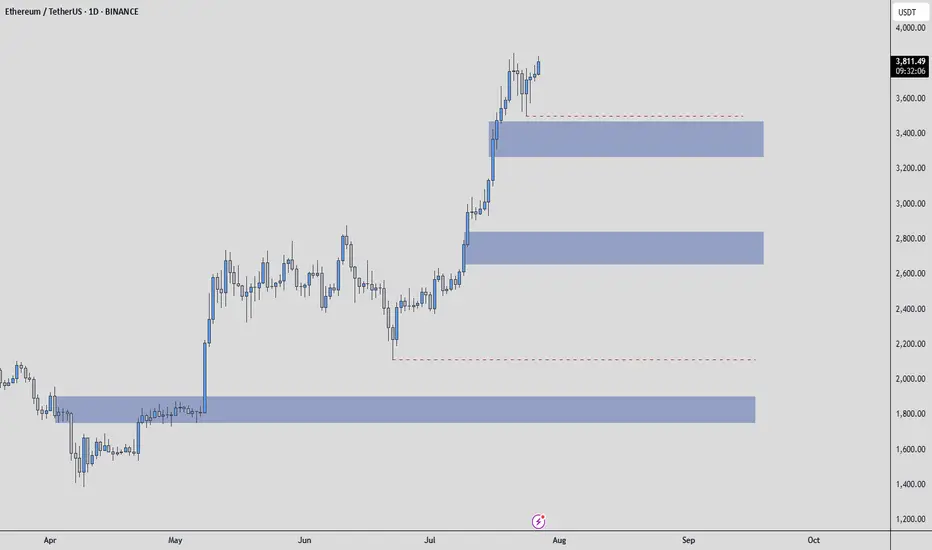
Ethereum - Possible Zones / How to use them ? Hello everyone, and special greetings to my dear friends who follow me, I hope you're happy that I helped you buy Ethereum at $2200.
Let's get to today's situation. There are many areas for Ethereum. The first blue box is the one I'd want to be the first buyer in.
I might want to be a buyer in the other blue boxes as well, but there will be increases even before these areas are reached.
I think the bottom blue box could be the one in the event of a Q3 correction.
What is a Q3 correction? All risk-on markets typically experience significant corrections in the third quarter of the year and struggle to recover from this correction until the end of the year.
The first blue box would be the first area I'd want to be in for any increases leading up to this correction.
HOW DO I GET INVOLVED!! THIS IS IMPORTANT BECAUSE SOME OF YOU LOSE MONEY WHEN BLUE BOXES ARE PULLED AWAY. THIS SHOULD NOT HAPPEN!!
When the price reaches the blue box, the transition is made to the 1-hour timeframe. Here, an upward breakout is sought, and during this breakout, the CDV is expected to be positive and rising. If these conditions are met, then RISK is taken. However, the entire amount of money isn't spent; it simply means that the conditions necessary to spend one bullet are met. One bullet is an amount that won't upset you too much; this varies for everyone.
I hope you use this analysis beneficially and profitably, because I want you to make a lot of money. Best wishes to you all, UmutTrades.
Ethereum monthly analysis Price Action & Structure:
• Ethereum is forming a symmetrical triangle, indicating a potential breakout or breakdown in the coming months.
• Key resistance levels:
• $4,698 (mid-term resistance)
• $5,640 (all-time high area)
• Key support levels:
• $2,235
• $1,600
Indicators:
• RSI (14): Currently around 50, showing neutral momentum but slightly recovering. No overbought or oversold condition.
• MACD (12,26): The blue line is attempting to cross above the orange line, a possible early bullish crossover. Histogram shows weakening bearish momentum.
• Volume: Decreasing volume inside the triangle pattern, typical before a breakout.
Outlook:
• A breakout above $4,698 with volume could target the $5,640 zone.
• A breakdown below $2,235 would open the door toward $1,600 or lower.
• Wait for a confirmed breakout from the triangle before major entries.

#ETH Update #5 – July 27, 2025#ETH Update #5 – July 27, 2025
Ethereum is attempting to revisit the levels of its previous impulsive move without having completed a proper correction. The fact that Ethereum has not made a retracement around 3280 and is instead pushing toward a new ATH does not seem very healthy to me. If it had completed the correction, it would have also balanced an existing imbalance in the structure.
When we look at the recent candles, we observe a lack of volume. This volume weakness is not sufficient to break the resistance at the previous high. If Ethereum breaks the 3900 dollar resistance level with a strong candle, it could move toward the 4335 dollar zone.
However, it should not be forgotten that there is still an imbalance and a correction zone around 3280 dollars. If the price decides to return to that level, it would mean an approximately 15% pullback from here. This could pose significant risk for altcoins, and we might see corrections of up to 40% in some.
Ethereum is currently one of the riskier assets for either taking a long or short position. Therefore, I do not recommend opening any position at this stage.

Ethereum Tests Key Long Term ResistanceEthereum continues to push higher, but a key resistance zone is causing a pause in the upward movement. Every day brings new positive developments for the crypto market, from ETF to tokenization news. This pattern reflects the typical progression of a crypto bull cycle. The latest SEC decision regarding a crypto-based ETF adds to the bullish backdrop.
However, a rising dollar index and a slowing momentum of U.S. stock market are having a short-term negative impact. Another reason for the current slowdown is the presence of massive resistance. The long-term trendline from the 2021 top, combined with the horizontal 4100 level, has formed a major resistance zone for Ether.
In the short term, ETHUSD may have formed another flag pattern. If it breaks to the upside, a retest of the 4100 resistance is possible. Today, dovishness level of Powell and the number of dissents in the rate-hold decision could significantly influence the price action.
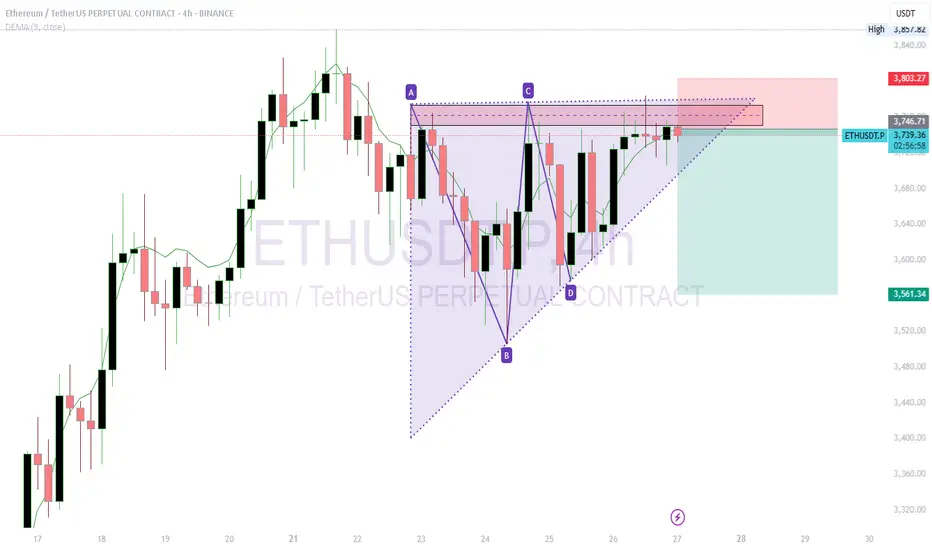
ETHUSDT Short Trade IdeaShort ETHUSDT at $3,745.22 with a target of $3,561.34.
Reason for Short: The 4-hour chart shows a symmetrical triangle pattern with resistance around $3,745-$3,800. The price is testing this upper trendline, and a recent bearish candle suggests potential rejection. The DEMA at $3,747.75 indicates overextension, supporting a pullback.
What I See: Heavy sell pressure is forming near $3,745, with the triangle nearing a breakout/breakdown point. Support lies around $3,561, aligning with prior lows.
Stop Loss: Set at $3,802, above the recent high and triangle resistance, to avoid a bullish breakout.
Trade Rationale: A breakdown from the triangle with volume confirmation could drive the price to $3,561. The tight stop above resistance minimizes risk while targeting a key support level.
eth buyI think Ethereum is ready for a historic bull run, it has collected almost all the lower stops and has done everything right in terms of the right trend pattern. But from a fundamental perspective, with the arrival of President Trump and the launch of Ethereum ETFs, we can see a historic growth for Ethereum from a fundamental perspective, but we have to wait for the right pattern for the entry point. I will specify a few ranges for you, and my expectation is that Ethereum will be at $20,000.


ETHUSD 8H — Strategy Nailed the Breakout, But Is $4K Next?This Ethereum 8H chart captures a powerful trend reversal, triggered by the **Enhanced Ichimoku Cloud Strategy V1**. After months of chop, the system delivered a clean entry and held the full breakout — now nearing key resistance around \$4K.
---
**📊 Setup Breakdown:**
* Entry triggered after **three major confirmations**:
* Breakout above long-term trendline
* Flip above the **171 EMA**
* Bullish **Ichimoku Cloud alignment**
* Strategy entered long near **\$2,530**, and has held the move for over 80 days
* Current price: \~\$3,988 — a **+57% trend** captured without exit signal
---
**⚙️ Strategy Logic:**
The strategy uses:
* Custom Ichimoku inputs: *(7 / 255 / 120 / 41)*
* A 171 EMA trend filter for signal clarity
* Optional “Cloud Mode” to confirm direction
* A memory-based system that reduces false chop signals
On this trade, the system **ignored mid-trend noise**, stayed in position, and let the move fully play out — exactly what it’s designed for.
---
**🔍 What to Watch Next:**
* Price structure remains bullish as ETH nears the psychological **\$4K resistance**
* Cloud support rising beneath — confirming healthy structure
* A clean break above \$4K could trigger another leg, while rejection may form a range
---
This is a prime example of how **low-frequency, high-conviction signals** can lead to massive upside when paired with disciplined exits. Backtest this strategy on your favorite altcoin pairs and compare.
Let me know when you’re ready to move to the next chart brother — this one’s ready for the spotlight 🔥

Ethereum (ETH): Buyers Accumulated | Time For Boune & BreakoutEthereum had its fun this week, and now we are already seeing some signs of buyer dominance forming here.
Based on our overall target and bigger timeframes, TAs, the $4000 is the target and 4hour candels are showing that buyers have not given away anything yet but rather have just been accumulating.
As long as we are above our entry area, we are bullish, and so should you be ...
Swallow Academy

ETH 1H Cloud Strategy Nailed the Trend, But Is It Losing Steam?This Enhanced Ichimoku Cloud Strategy filtered out the chop and triggered a high-conviction long at 2510 — backed by a bullish cloud flip, 25-period breakout, and alignment above the 171 EMA. Since then, price has climbed nearly +50%, with the trend still intact above both cloud and EMA.
The custom parameters (7 / 255 / 120 / 41) are tuned for clarity and patience, making it ideal for swing entries on volatile assets like ETH and SOL.
Want to optimize for your own asset? Just load the strategy, tweak the inputs, and run a parameter test using TradingView’s Strategy Tester.
#ETHUSD #Ichimoku #TradingStrategy #TrendFollowing #TradingView #CryptoTrading #AlgoTrading

Buy LimitI think it's a great zone to buy — but only if the selling volume decreases as the price approaches that area. Otherwise, we wait for the volume to drop. But I will never buy above that price, even if I miss the move.

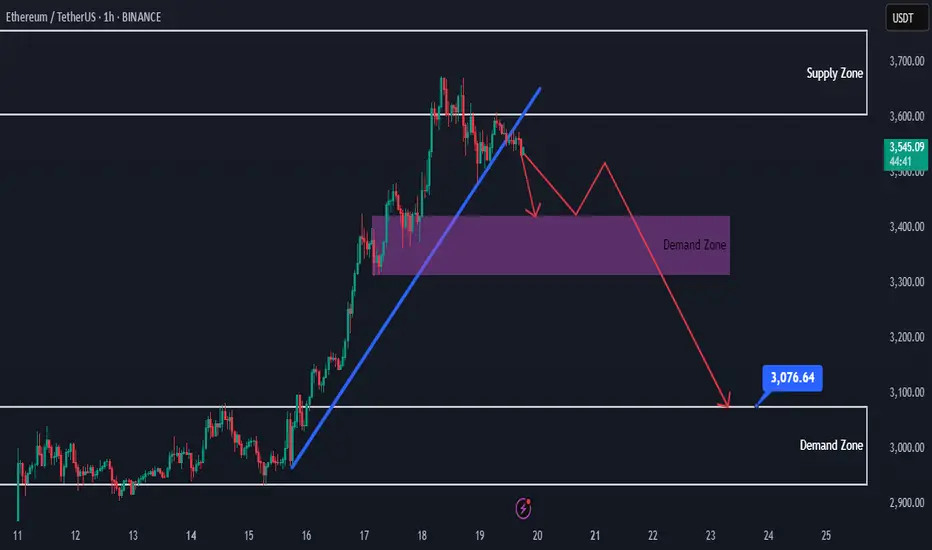
Ethereum at Key Supply — Short-Term Sell OpportunityHello everybody!
Ethereum has reached a strong supply/resistance area in the daily timeframe.
As we see on the chart, lower highs have started to forming.
In addition to that, an upward trendline has been broken.
Keeping in mind that overall trend is bullish, we can look to short time sell positions here.
The first target can be 3300-3400.
If the price breaks below 3300, we can expect it to go lower toward 3100 area.
Manage your risk and trade safe!
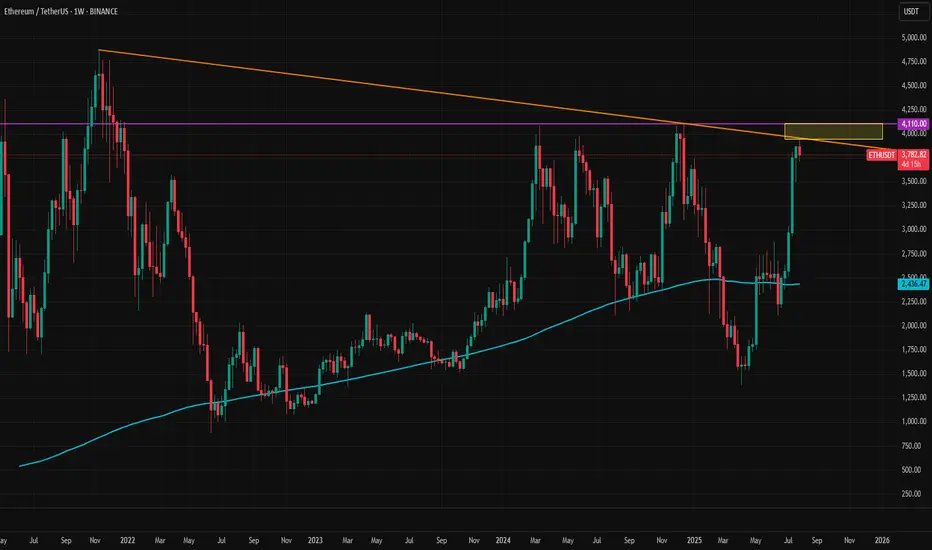
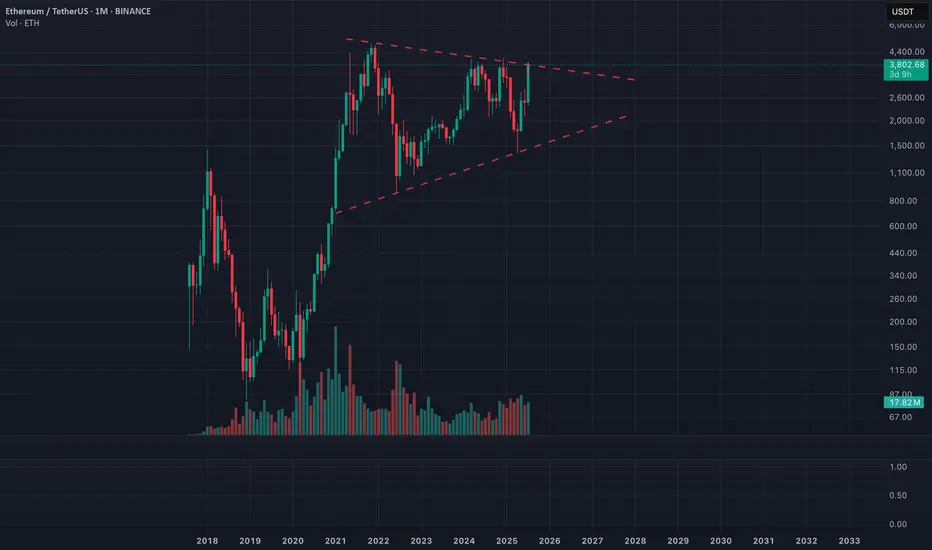
ETHUSDT - Multi-year Symmetrical Triangle ETH has formed a massive symmetrical triangle since the 2021 top (~$4,800).
This triangle has been tightening since 2022 with:
- Lower highs from $4,800 → ~$4,000
- Higher lows from ~$850 → $1,370 → $1,850+
We now close to the apex, meaning a major breakout or breakdown is imminent in the coming weeks/months.
Price Action
ETH is pressing against the upper resistance of the triangle (~$3,850–3,950).
A monthly close above $4,000 would be the first breakout in over 2 years.
Volume
Volume has decreased over time, typical for a symmetrical triangle.
We are looking for volume increase on breakout to confirm it’s on the right track.
Momentum (Laguerre RSI: 0.67)
Momentum is rising, supportive of a bullish breakout.
RSI is not yet overbought, so there’s room for continuation.
Scenarios
Bullish Breakout Scenario:
Trigger: Monthly close above $4,000–4,200
Target: ~$7,000–7,500
Timeline: Could play out over 3–6 months
Bearish Breakdown Scenario
Trigger: Monthly close below $2,500
Target Zone: $1,850 → $1,300 (last major supports)
Would invalidate the higher low structure
I am bullish but it is hard to not to be cautious given its crypto and this is a pretty tough resistance.
Do your own research and make responsible decisions all.
Peace out.
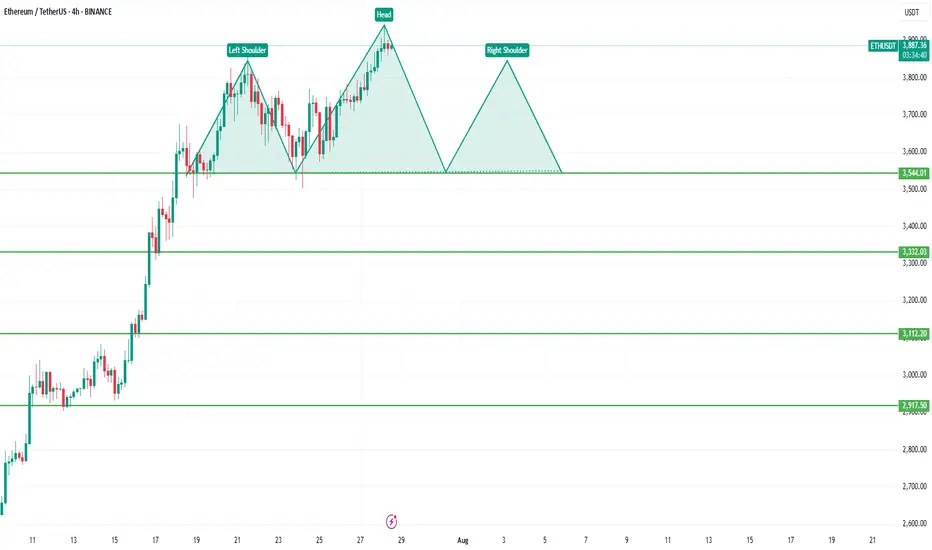
"ETH Warning Signal: Is a Bearish Breakdown Imminent?"📊 Pattern Overview: Head and Shoulders
Left Shoulder: Formed around July 24th, marked by a high near $3,800 followed by a retracement.
Head: A higher peak on July 27th, topping out near $3,888, then pulling back again.
Right Shoulder: Currently anticipated, projected to form around the same height as the left shoulder, with a potential completion near $3,800 before another decline.
Neckline: Flat support line around $3,544, acting as the crucial level that, if broken, confirms the pattern.
🧠 Interpretation
The Head and Shoulders is generally interpreted as a trend reversal pattern. In this context, Ethereum has been in a strong uptrend, but the pattern signals a potential topping out and shift toward a bearish phase.
If ETH breaks below the neckline at $3,544 with volume confirmation, it would signal that bulls are losing control, and sellers may take over.
📉 Bearish Breakdown Target
The theoretical downside target can be calculated by measuring the distance from the Head to the Neckline and projecting it downward from the neckline:
Head peak: ~$3,888
Neckline: ~$3,544
Height: ~$344
📌 Target after breakdown:
$3,544 - $344 = $3,200 (approx.), with interim support levels around:
$3,332 (horizontal support)
$3,112
$2,917
These levels might act as pause points or bounce zones if the breakdown unfolds.
🟢 Invalidation Scenario
If Ethereum invalidates the pattern by:
Breaking above the Head level ($3,888) and holding
Sustaining higher highs with strong volume
Then the bearish thesis would be invalidated, and bulls may aim for continuation toward $4,000+ levels.
🧩 Strategic Takeaways
Aggressive traders might short the neckline break at $3,544, with stops just above the right shoulder (~$3,800).
Conservative traders may wait for a retest of the neckline post-breakdown.
Risk management is key, especially in crypto markets, which are known for head fakes and false breakouts.
⏳ Final Thought
This setup doesn't guarantee a drop—it merely increases the probability of a reversal. Watch for volume on the neckline break and monitor how price reacts at key support levels.
DYOR before taking a trade
Ethereum (ETH): Getting Closer To Our Third Target | $4000Ethereum has done really well since our entry, and we are almost at the third target. After that, we are going to expect to see the movement towards the ATH area.
As we said, money flow has to go somewhere, and as Bitcoin has had its time, now people need new projects where to get their profits from, which was of course the ETH. Still good for long, still has time to make that new ATH.
Swallow Academy

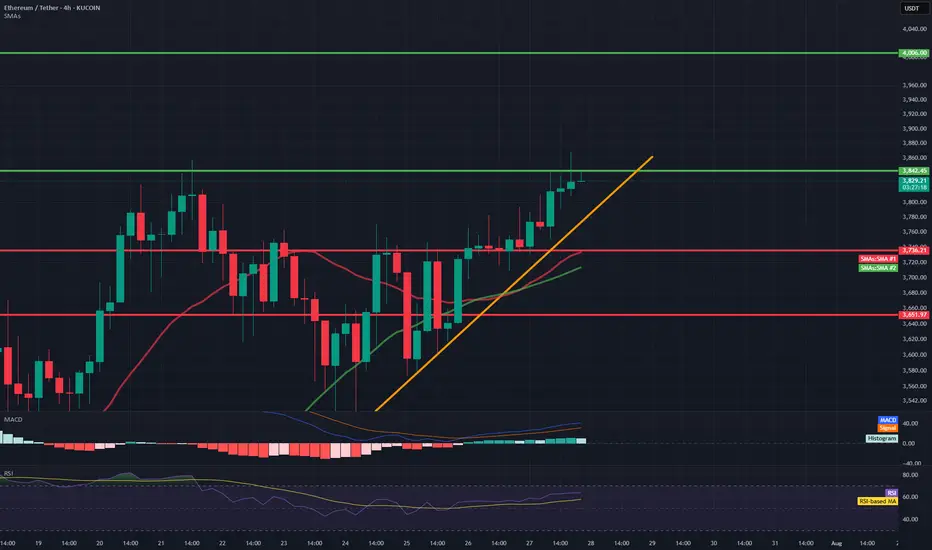
ETH/USDT 4H Chart📊 General Context
Ethereum is rising in a strong short-term uptrend, supported by a rising trendline (orange).
Current price: 3831 USDT
We are approaching a significant resistance level around 3842–3850 USDT (green line).
Technical support is located around 3760 USDT (previous consolidation level and 50/200 SMA).
🔍 Technical Levels
Resistance:
3842–3850 USDT – local high, currently being tested.
4006 USDT – key psychological level and the last local high on the chart.
Support:
3762 USDT – previous resistance, currently turned into support (may be tested in a correction).
3650 USDT – strong technical support, confirmed several times in the past.
SMA50 and SMA200 – currently just below the price, also acting as dynamic support.
📈 Technical Indicators
MACD:
The histogram is rising and positive → bullish momentum.
The MACD line crosses the signal line from below → a buy signal.
RSI (14):
Currently: around 64 → not yet overbought, but close to the overbought zone.
Slightly rising trend, but may suggest impending market overheating with further gains.
🧭 Trend
Short-term: strong uptrend (trend line, green candles, breakout from consolidation).
Medium-term: higher lows and higher highs – the uptrend is maintained.
The price is holding above the 50 and 200 SMAs – confirming bullish sentiment.
⚠️ What to watch next?
A 4-hour candle close above 3842 USDT → confirmation of a breakout, a potential attack on 4000–4010 USDT.
A break of the trend line (orange) → a possible correction to 3760 or even 3650 USDT is possible.
An RSI rise above 70 → an overbought signal, a possible pullback or consolidation.
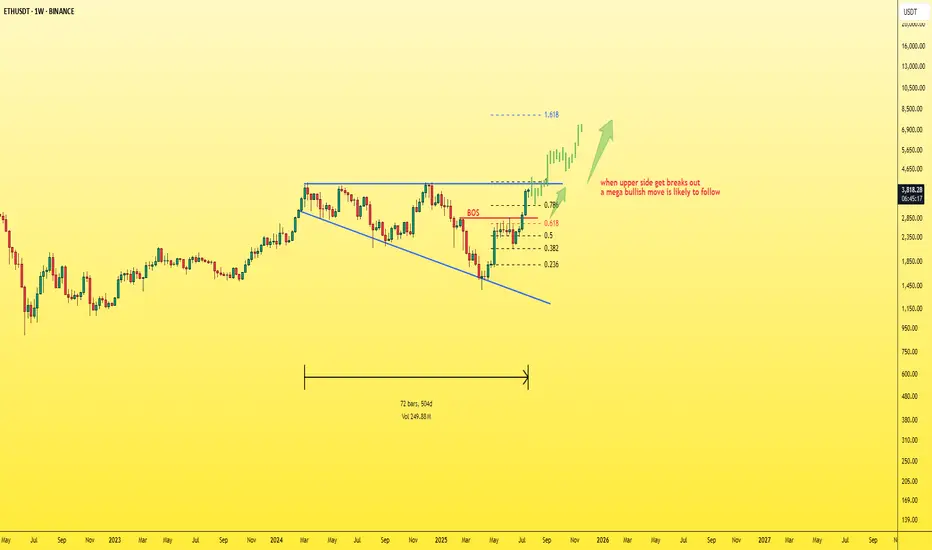
ETH - simple chart and mega moveEthereum is currently the strongest and most stable asset in the market, especially after many had lost hope in it.
Now, Ethereum is back with strength, and it’s just a few steps away from breaking out of the current pattern.
📈A breakout above the upper boundary will likely lead to a new all-time high (ATH) for ETH.
My projection: Ethereum could surpass $7,000 before the end of 2025.
Best regards:
Ceciliones🎯
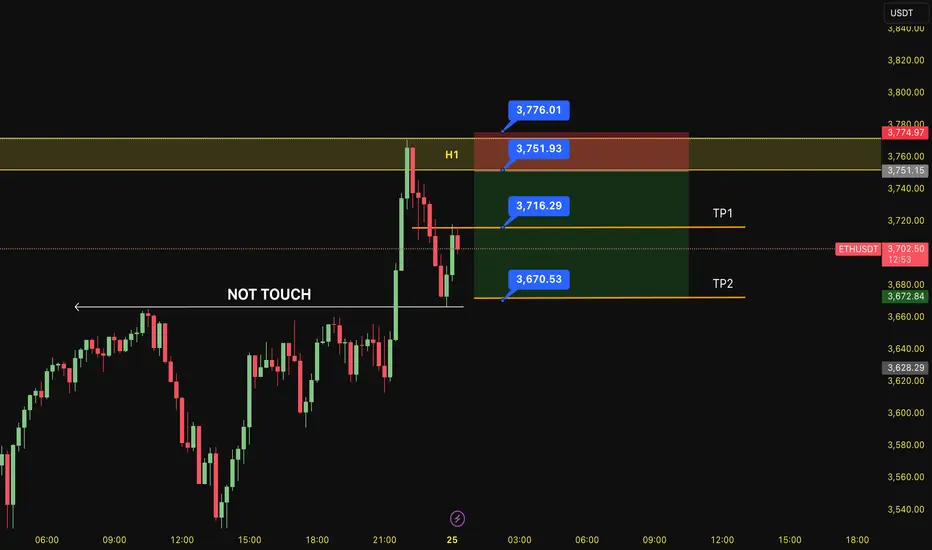
SELL ETH 25.7.2025Reversal trade order: SELL at H1~M15
Type of entry: Limit order
Reason:
- Candle creates reverse number 1 model
- The bottom hasn't touched any peak yet (meaning it hasn't reached a strong reversal zone)
Note:
- Management of money carefully at the price of bottom of M5 (3,716)
Set up entry:
- Entry sell at 3,751
- SL at 3,776
- TP1: 3,716
- TP2: 3,670
Trading Method: Price action (No indicator, only trend and candles)
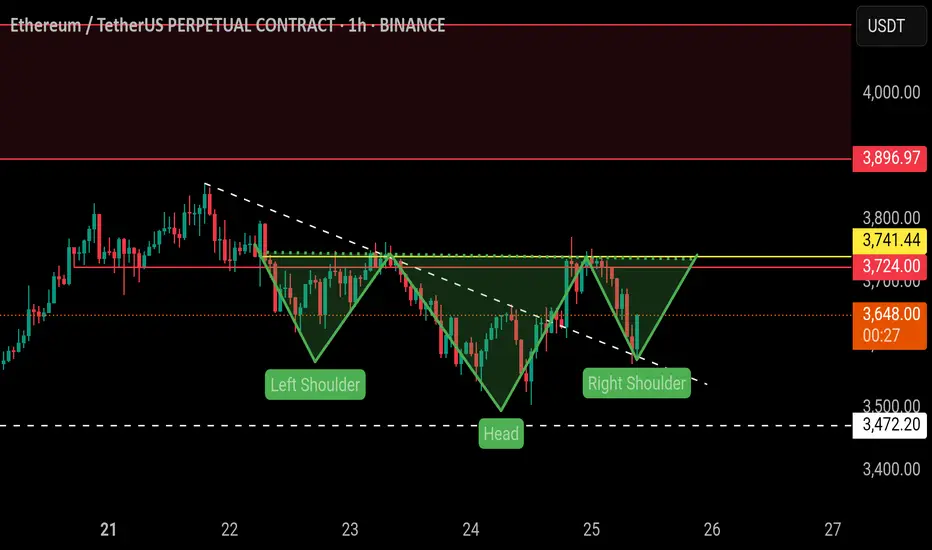
$ETH | Ready to fly (Inverted head and shoulders)BINANCE:ETHUSDT.P
On 1H TF, the price is forming inverted head and shoulders pattern, which is a strong bullish pattern.
The price has retested the trendline support and bounced back.
Expecting it to breakout above yellow line soon.
A breakout above the yellow line will be a bullish and pattern confirmation.
We can initiate a long entry from here.
Please do proper risk management and must use stop loss.
NFA, DYOR