ETH - Perfect Test & BounceTo fully understand this post you will need to refer to our 3 previous posts. Here is the play by play of chart analytic mastery.
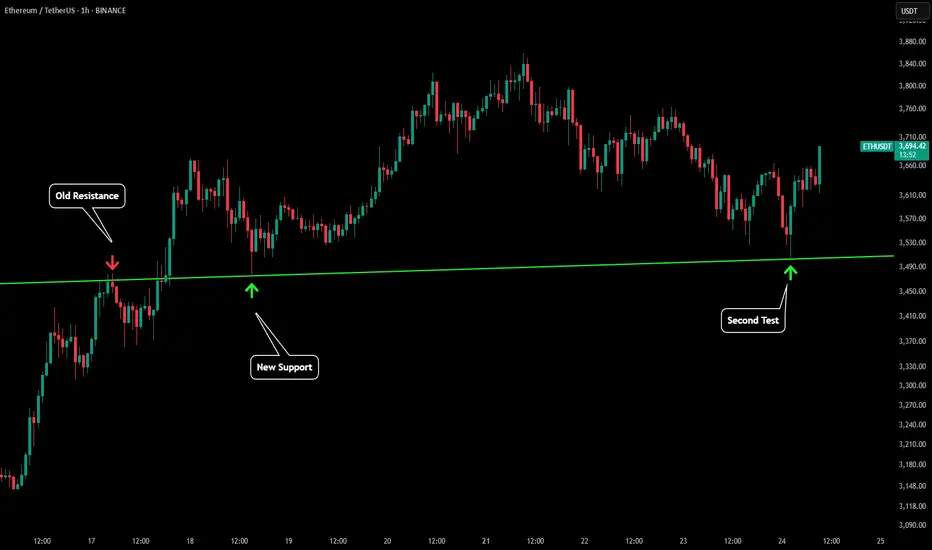
In this first post we made almost 2 weeks ago we outline "ETH'S CRAZY IMPORTANT LINES". In this post there were a lot of lines drawn and what we were saying was ETH was about to have a 20%+ rally to test the green trendline that we labeled "WATCH TRENDLINE".
Then we made an updated post titled "ETH - CHARTS DONT LIE" once price had teleported to our green trendline. This was establishing our green trendline as a very key level.
Once price had broken above the green trendline we made a post titled "ETH - PULLBACK INCOMING". What we said was ETH was likely to have a pull back that would bring us back to the green trendline marked "first support".
Fast forward 3 days and to the exact dollar price tested the green trendline and has seen a solid bounce so far! Hope you have been able to follow the incredible technical provided in real time by Viaquant!
ETHUSDT trade ideas
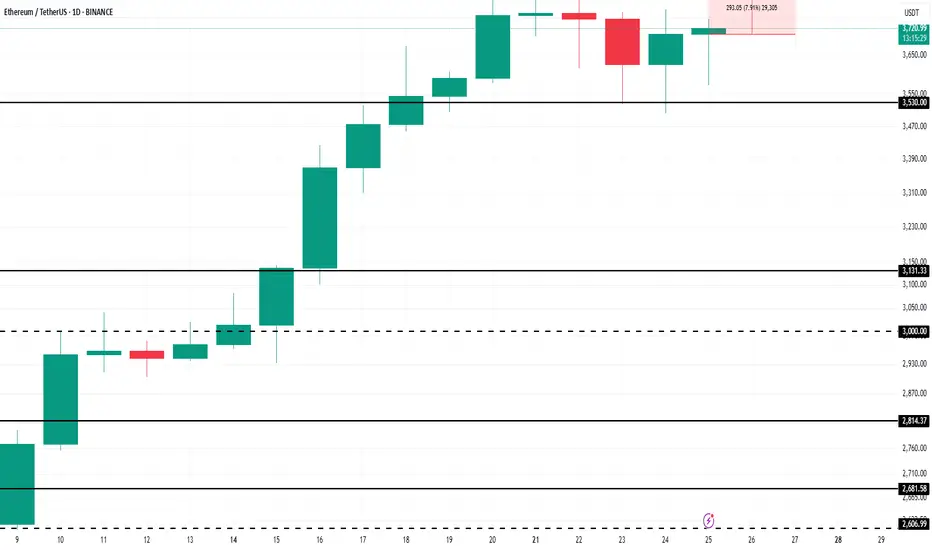
Ethereum’s $4,000 Target Alive as Historic Rally Signs EmergeBINANCE:ETHUSDT is currently trading at $3,680, just 9% away from the critical $4,000 resistance that many investors have been waiting for over the past seven months. The altcoin is expected to continue its upward momentum despite the recent consolidation, with the potential to breach the $4,000 mark soon.
Looking at broader technical indicators, the NUPL (Net Unrealized Profit/Loss) suggests that BINANCE:ETHUSDT is poised for a significant rally . The NUPL indicator, when reaching a threshold of 0.5, traditionally signals a pause in the uptrend, followed by a sharp rally.
$ BINANCE:ETHUSDT is currently nearing this threshold , which, in the past, has marked the beginning of powerful upward price action.
As long as BINANCE:ETHUSDT remains above its key support levels, the price is likely to surge toward $4,000 . If Ethereum can maintain its momentum, a breach of $4,000 could act as a catalyst for further gains.
However, should unforeseen selling pressure arise, $BINANCE:ETHUSDTprice could slip below the $3,530 support level. In such a scenario, Ethereum may fall to $3,131, invalidating the current bullish outlook. The key will be maintaining support and capitalizing on the retail-driven surge.
Eth mvrvBeen a solid buy and sell strategy using the oversold and overbought territories of eth mvrv z score. Impossible to time exact pivots but great time to dca in and out

Huge Bear Trap next in line??Ethereum Exit Queue: 518,180 ETH
Half a million ETH is currently queued for unstaking on Ethereum...
Keep in mind, August 1st, Trump's Reciprocal Tariffs get in effect
Everyone's talking about BTC's new ATH, ETH's rally, XRP new ATH, but no one is talking about August 1st...
Manipulation is taking place. Stay safe, because a huge bear trap might be next in line (BTC back to 90K)
*NOT INVESTMENT ADVICE*
#crypto #ethereum #eth #btc #bitcoin #trading #xrp #trump #tariff #finance #economy

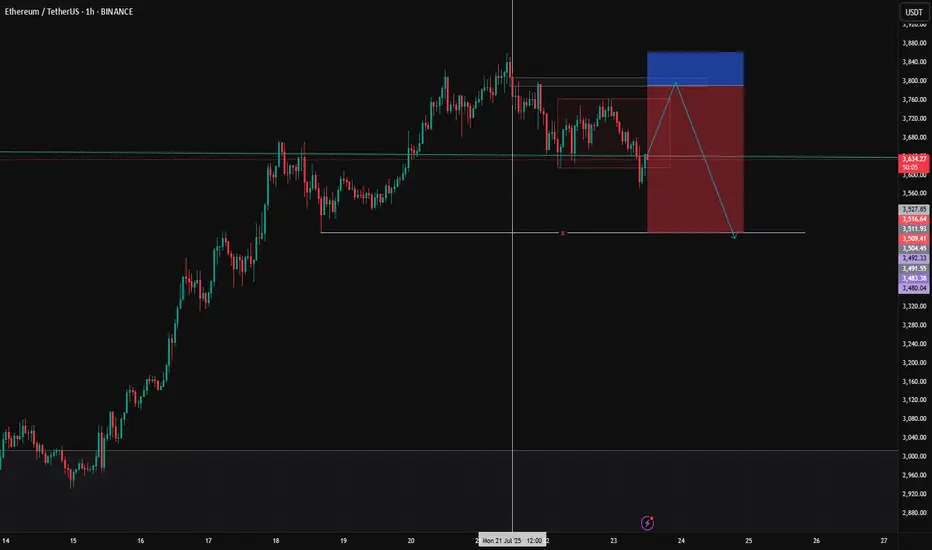
ETH – Potential liquidity sweep before major continuation?While I remain long-term bullish on ETH, I’m currently eyeing a potential short-term sweep of liquidity before continuation.
Price has formed a rounded top structure and is approaching a key 12h/1d liquidation zone near 3680–3700. I expect a potential fakeout to the upside, triggering stop-losses and short liquidations, before a reversal targeting the 3500–3400 area completing the rounded top structure, which also comfortably re-tests a bunch of unmitigated bullish FVGs, and also the 0.382 level since the major rally.
This is how I imagine the next leg up.
🔁 Trade Plan: small position size with 10x leverage on futures only. This is a counter-trend play against my main spot ETH position, which remains strongly bullish.
🚨 Not financial advice. Just sharing the setup I’m watching. Let’s see how it plays out.

Ethereum (ETH): Nothing Has Changed, We Still Target $4000Ethereum buyers have to reclaim back the middle line of Bollinger Bands, which recently switched the trends and is now under the control of sellers.
This sideways movement we have had is like a perfect setup, which will most likely lead the ETH to $4000K, which is one of the major resistance areas and a round number, which gives it a status of "psychological resistance."
Swallow Academy

ETH Just Lost Key Support — Next Stop: $2,879?Ethereum (ETH) appears to be losing steam on the 4-hour chart as it fails to sustain above the critical $3,860 resistance level. After a strong rally, the price structure has started showing signs of exhaustion — the previous bullish momentum has clearly stalled, and ETH is now forming lower highs and lower lows. This breakdown marks a potential shift in trend, especially considering the clean rejection from $3,860 with several upper-wick rejections signaling aggressive selling pressure.
The green ascending trendline, which supported ETH throughout its recent rally, has been breached. Price has broken below the trendline and is now moving in a declining structure highlighted by the recent bearish wave. Sellers have stepped in, and the most recent candles indicate a bearish continuation setup forming just below a failed support-turned-resistance near $3,533.
There’s a visible trade setup taking shape:
• Entry: $3,530–$3,550 (post-retest of broken trend support)
• Stop-loss: $3,650 (above recent local highs)
• Target 1: $3,200 (key support level)
• Target 2: $2,879
• Target 3 (extended): $2,635 if downside pressure intensifies
This short setup offers a solid risk-reward ratio, especially if momentum accelerates below $3,500. The sell signal seen earlier aligns with this potential reversal zone, and unless ETH reclaims $3,650 with volume, the bears look likely to stay in control.
In summary, ETH on the 4H timeframe is now trading below major support, with a bearish structure, trendline breakdown, and rejection at resistance — all aligning for a short-biased move in the coming sessions. Any bullish invalidation would require ETH to push and close above $3,650 convincingly. Until then, the path of least resistance appears downward.

ETH risk of further downside moves 1HR chartIf ETH breaks $3539, could see a further drop to next support. This is short time frame, the bigger Macro trends are still in tact.

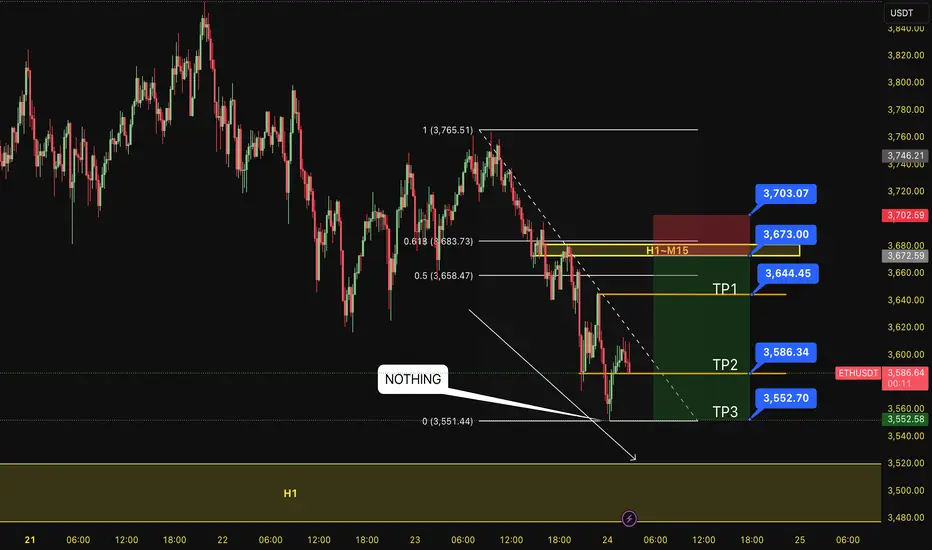
SELL ETH 24.7.2025Confluence trade order: SELL at H1~M15
Type of entry: Limit order
Reason:
- The bottom doesn't touch anything. It is expected to continue to decline into H1.
- Keylevel H1~M15~FIB 0,5-0,618
Note:
- Management of money carefully at the price of bottom (3,644)
Set up entry:
- Entry sell at 3,673
- SL at 3,703
- TP1: 3,644
- TP2: 3,586
- TP3: 3,552
Trading Method: Price action (No indicator, only trend and candles)
How far will the drop go?Ethereum is currently in a downtrend, and so far we don't see any signs of a reversal yet.
But let’s not forget that in the higher cycle, the trend remains strongly bullish.
Now you may ask — when is the best time to buy Ethereum?
3500? Or 3400?
We need to wait a bit to get more confirmations before answering that.
I’ll share the best buy zone with you soon in the near future.
Good luck!
ETH Short PositionHi
This is good zone for ETH correction , it's my personal idea and not trading advice.
please manage your risk .:)
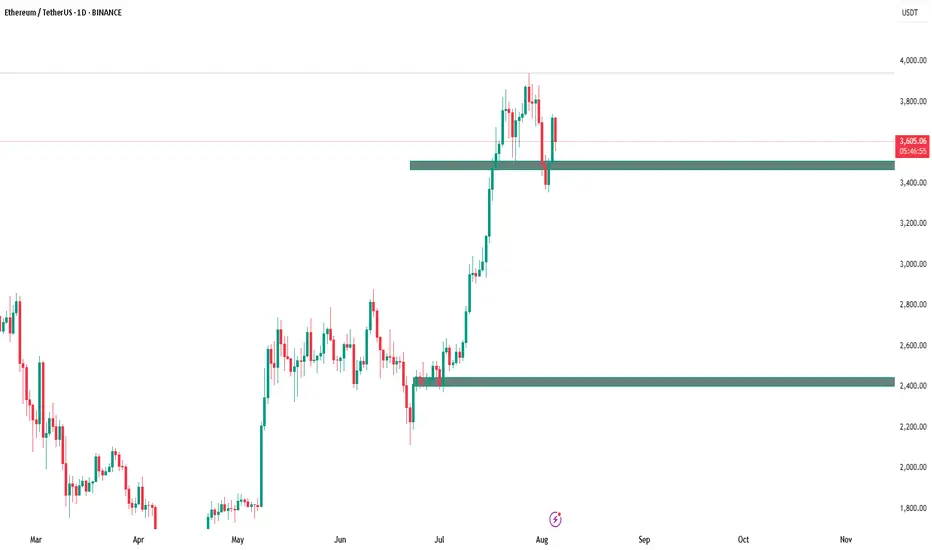
Ethereum is consolidating ┆ HolderStatBYBIT:ETHUSDT is trading within a consolidation zone just under $4000 after rallying from sub-$3000 levels. The trend remains strong with prior triangle and consolidation patterns fueling upward moves. A continuation breakout may test the $4000 barrier soon.

Ethereum Profit-Taking in Progress, Longterm Bullish Case StandsEther was unable to break above the trendline following its strong rally. In the medium term, our base case remains bullish, with expectations of over 100% return within a year. However, in the short term, some downward pressure and profit-taking are currently in play.
Two days ago, the Ethereum ETF experienced its largest single-day net outflow. If this turns into a trend, a broader selloff may begin. Should ETH approach the 3000 level, it could present a strong opportunity to re-enter from the bullish side.
There is also a chance of a trendline breakout occurring before a significant downward reaction. If that happens, it would suggest that demand for ETH is stronger than previously realized, and our base case may actually be too conservative.

ETH | Short | 3hrs This technical analysis is for informational and educational purposes only. It does not constitute financial advice. Remember to always research and consult with a professional before making investment decisions. Good luck! 📈💼🚀

ETHERIUMTHE RESULT
Follow for more Simple And accurate swing analysis on Indices, Currency, Commodities.
Pattern formationA head and shoulders pattern has formed on Ethereum. If it gets activated, the price is likely to drop. However, if it fails to activate, it will itself be a bullish signal.
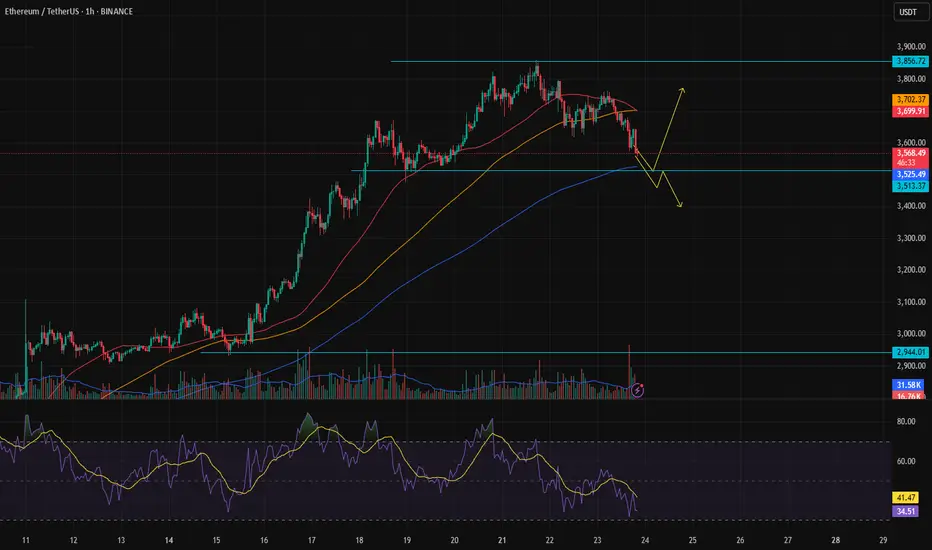
ETHUSDT 4H Chart Review🔍 General Technical Context:
Prior Trend: Upward (strong rally from around 3,150 USDT).
Current Structure: After breaking out of the ascending channel, there was a strong decline, but is currently rebounding upward – it looks like a test of prior support as resistance.
📈 Key Horizontal Levels (Support/Resistance):
Resistance:
3,794 USDT – strong resistance resulting from the prior high (green line).
3,943 USDT – high of the ascending channel.
Support:
3,504 USDT – prior support, now potentially acting as resistance (red line).
3,383 USDT – July support.
3,132 USDT – strong base support, potential correction low.
📉 Technical Patterns:
Broken Upward Channel (orange lines): A clear downward breakout suggests a weakening of the previous trend.
Downward Trendline (purple): The current price is approaching it – a test and reaction (bounce or breakout) may occur.
📊 Stochastic RSI (oscillator at the bottom):
The indicator is entering the overbought zone (>80).
This may indicate an impending slowdown or correction, especially if the price encounters resistance at the purple downward trendline.
🔮 Scenarios:
✅ Bullish (if the breakout is upward):
A breakout of the purple trendline and resistance at 3,794 USDT could signal further gains towards 3,943 USDT or higher.
Confirmation could come from a retest of the purple line as support.
❌ Bearish (if resistance rejected):
Rejection from the trendline or the 3,794 USDT zone = possible correction to 3,504 or 3,383 USDT.
Break of 3,383 = potential decline to the 3,132–3,150 USDT zone.
🧭 Conclusion:
The market has regained strength from the local low but is at a potentially strong resistance zone.
Stochastic RSI overbought + near resistance = high risk of a near-term correction.
The key will be price performance within the purple trendline and 3,794 USDT.

Clean Setup Completed After our previous analysis hit the target, the price has now reached a key decision zone — whether it wants to move higher or not.
At this point, we need to wait and see how the market decides, and then react accordingly.

Weekly trading plan for EthereumLast week, BINANCE:ETHUSDT mirrored Bitcoin's moves, hitting all three of our targets. While we're seeing strong recovery now, the overbought RSI suggests a pullback may be coming soon.
Key Takeaways:
Recent longs opened yesterday during the trend shift → Consider managing risk
Better re-entry post-correction than sitting through volatility
Last week's pullback was shallow → Downward continuation remains possible
Markets reward patience - don't force trades in overbought zones

ConsenSys: Powering the Future of Cryptocurrency InfrastructureCryptocurrency ecosystem is actively maturing and investors are increasingly drawn to infrastructure providers that underpin the decentralized economy. Consensys is a leading blockchain software company, stands out with its flagship MetaMask wallet and a suite of Ethereum-focused solutions. With a robust business model and global adoption, Consensys offers a pretty interesting case for those, who are eyeing the backbone of Web3.
MetaMask: The Leading Crypto Wallet
Consensys’s flagship product, MetaMask, is one of the most widely used cryptocurrency wallets globally, competing closely with Trust Wallet for market dominance. Unlike centralized exchange storage, MetaMask is a decentralized, self-custodial wallet—essentially software that allows users to manage digital assets independently. With an estimated 30 million monthly active users, MetaMask facilitates billions in transactions, verifiable on the Ethereum blockchain.
MetaMask generates revenue through a 0.875% fee on token swaps, contributing to a reported $60 million in net profit for 2024. Its user base is spread across various markets, including Nigeria, Indonesia, the United States, South Korea, and Germany. In regions like Nigeria, where banking systems charge high fees, MetaMask transforms cash flow by enabling low-cost transactions. In developed markets like the U.S. and Germany, it serves as a gateway for asset storage and decentralized app (dApp) interactions.
A key growth catalyst for MetaMask is the potential launch of its own governance token. Unlike competitors Trust Wallet and Gnosis, MetaMask lacks a native token, which could streamline transactions and boost revenue by reducing reliance on third-party staking providers. Market speculation suggests a token launch could enhance MetaMask’s valuation and make it by this a hot topic for discussions.
Infura: Ethereum’s Infrastructure Backbone
Beyond MetaMask, Consensys’s Infura provides critical infrastructure for Ethereum COINBASE:ETHUSD , the world’s second-largest blockchain. Infura’s API services enable developers to build and scale dApps without running their own nodes, supporting over 430,000 developers and processing transactions worth over $1 trillion annually. Infrastructure is integral to Ethereum’s ecosystem, powering everything from DeFi platforms to NFT marketplaces.
Infura’s revenue model, based on usage fees ($40–$50 per 200,000 API requests), capitalizes on Ethereum’s growth. As transaction volumes rise—up 83% since 2017—Infura’s role as a reliable backend for MetaMask and other dApps positions it as a critical part of Consensys’s business.
Sharplink: Smart Contracts for Enterprises
Consensys’s Sharplink division develops software for smart contracts, serving high-profile clients like Ernst & Young , Airbus EURONEXT:AIR , JPMorgan NYSE:JPM , Microsoft NASDAQ:MSFT , and Amazon $NASDAQ:AMZN. Solutions enable secure and automated agreements on Ethereum, with applications ranging from supply chain management to digital identity. Central banks in countries like Norway and Israel are also exploring Sharplink’s technology for digital currency initiatives.
Staking and Asset Management
Consensys owns approximately $500 million in Ethereum and other cryptocurrencies, generating income from staking and other revenue-generating operations, thereby complementing the company's software offerings, ensuring financial stability, and providing access to the growth of the cryptocurrency market.
Why Consensys Stands Out
Lets take Kraken or Bybit, for example. Their reported trading volumes are quite difficult to verify, but at the same time, Consensys' decentralized products provide transparency. Every MetaMask transaction and Infura API call is recorded on Ethereum’s public ledger, allowing investors to validate activity. Such openness mitigates the exaggeration common in crypto, where claims of user bases or turnovers can be inflated.
Consensys’s diversified portfolio—spanning wallets, infrastructure, smart contracts, and staking, as we told before—reduces reliance on any single revenue source. Its global reach, from emerging markets like Nigeria to tech hubs like the U.S., further de-risks its business model. Major investors, including BlackRock, JPMorgan, and Microsoft, have already backed Consensys, signaling that way confidence in its long-term potential.
The Road Ahead
Founded by Ethereum co-founder Joseph Lubin, Consensys has raised $1 billion to date, with a reported valuation target of $7 billion for a potential IPO. While the timeline for going public remains uncertain, the company’s focus on Ethereum’s ecosystem positions it to benefit from Web3’s expansion. Challenges, such as regulatory scrutiny and competition from wallets like Trust Wallet or blockchains like Solana, exist, but Consensys’s entrenched role in Ethereum gives it a competitive edge.Cryptocurrency ecosystem is actively maturing and investors are increasingly drawn to infrastructure providers that underpin the decentralized economy. Consensys is a leading blockchain software company, stands out with its flagship MetaMask wallet and a suite of Ethereum-focused solutions. With a robust business model and global adoption, Consensys offers a pretty interesting case for those, who are eyeing the backbone of Web3.
MetaMask: The Leading Crypto Wallet
Consensys’s flagship product, MetaMask, is one of the most widely used cryptocurrency wallets globally, competing closely with Trust Wallet for market dominance. Unlike centralized exchange storage, MetaMask is a decentralized, self-custodial wallet—essentially software that allows users to manage digital assets independently. With an estimated 30 million monthly active users, MetaMask facilitates billions in transactions, verifiable on the Ethereum blockchain.
MetaMask generates revenue through a 0.875% fee on token swaps, contributing to a reported $60 million in net profit for 2024. Its user base is spread across various markets, including Nigeria, Indonesia, the United States, South Korea, and Germany. In regions like Nigeria, where banking systems charge high fees, MetaMask transforms cash flow by enabling low-cost transactions. In developed markets like the U.S. and Germany, it serves as a gateway for asset storage and decentralized app (dApp) interactions.
A key growth catalyst for MetaMask is the potential launch of its own governance token. Unlike competitors Trust Wallet and Gnosis, MetaMask lacks a native token, which could streamline transactions and boost revenue by reducing reliance on third-party staking providers. Market speculation suggests a token launch could enhance MetaMask’s valuation and make it by this a hot topic for discussions.
Infura: Ethereum’s Infrastructure Backbone
Beyond MetaMask, Consensys’s Infura provides critical infrastructure for Ethereum, the world’s second-largest blockchain. Infura’s API services enable developers to build and scale dApps without running their own nodes, supporting over 430,000 developers and processing transactions worth over $1 trillion annually. Infrastructure is integral to Ethereum’s ecosystem, powering everything from DeFi platforms to NFT marketplaces.
Infura’s revenue model, based on usage fees ($40–$50 per 200,000 API requests), capitalizes on Ethereum’s growth. As transaction volumes rise—up 83% since 2017—Infura’s role as a reliable backend for MetaMask and other dApps positions it as a critical part of Consensys’s business.
Sharplink: Smart Contracts for Enterprises
Consensys’s Sharplink division develops software for smart contracts, serving high-profile clients like Ernst & Young, Airbus, JPMorgan, Microsoft, and Amazon. Solutions enable secure and automated agreements on Ethereum, with applications ranging from supply chain management to digital identity. Central banks in countries like Norway and Israel are also exploring Sharplink’s technology for digital currency initiatives.
Staking and Asset Management
Consensys owns approximately $500 million in Ethereum and other cryptocurrencies, generating income from staking and other revenue-generating operations, thereby complementing the company's software offerings, ensuring financial stability, and providing access to the growth of the cryptocurrency market.
Why Consensys Stands Out
Take Kraken or Bybit, for example. Their reported trading volumes are quite difficult to verify, but at the same time, Consensys' decentralized products provide transparency. Every MetaMask transaction and Infura API call is recorded on Ethereum’s public ledger, allowing investors to validate activity. Such openness mitigates the exaggeration common in crypto, where claims of user bases or turnovers can be inflated.
Consensys’s diversified portfolio—spanning wallets, infrastructure, smart contracts, and staking, as we told before—reduces reliance on any single revenue source. Its global reach, from emerging markets like Nigeria to tech hubs like the U.S., further de-risks its business model. Major investors, including BlackRock, JPMorgan, and Microsoft, have already backed Consensys, signaling that way confidence in its long-term potential.
The Road Ahead
Founded by Ethereum co-founder Joseph Lubin, Consensys has raised $1 billion to date, with a reported valuation target of $7 billion for a potential IPO. While the timeline for going public remains uncertain, the company’s focus on Ethereum’s ecosystem positions it to benefit from Web3’s expansion. Challenges, such as regulatory scrutiny and competition from wallets like Trust Wallet or blockchains like Solana, exist, but Consensys’s entrenched role in Ethereum gives it a competitive edge.
Bullish engulfing flex on the weeklyWhat’s up Candle Fam,
Ethereum just pulled a bullish engulfing flex on the weekly — and it’s not here to play. The recent correction shook out late longs, but structure remains beautifully intact.
🎯 LONG Setup
📍 Entry: $3,430–$3,340
🩸 Stop Loss: $3,190
🎯 Targets:
TP1: $3,750
TP2: $3,980
TP3: $4,200
📊 Strategy: Weekly OB + FVG Reclaim
– Weekly: Clean engulfing candle reclaiming the $3.2k–3.4k order block
– Daily: Structure holding higher lows — bullish market structure intact
– LTF: Watch for CHoCH + volume spike around $3.4k (12H/1H footprint shows absorption)
🧠 Footprint Flow:
– Aggressive shorts caught below $3.4k
– Buyers stepping in with clear delta divergence
– POC shifting higher = reclaim attempt underway
⚠️ Invalidation below $3,200 — breaks HTF structure
⛓️ Stick to low leverage or spot to manage broader macro risks.
No hopium, just structure.
Stick to the craft. Trade the plan.
Candle Craft | Signal. Structure. Execution.

ETH, 4000 when? or $2900?Yes, can come to $2900 but before that scalp all the momentums and then create an extent!

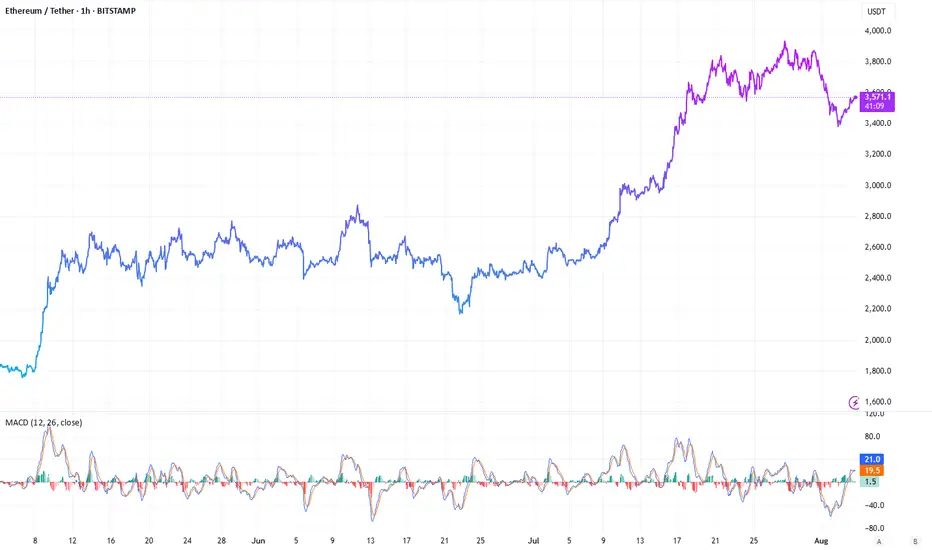
ETH 4H – MACD Histogram Caught The 54% Increase, Did You?The MACD Liquidity Tracker Strategy doesn’t just catch trends — it shows you how strong they are. On this ETH 4H chart, a textbook move unfolds:
🔹 Histogram flipped positive → Long entry triggered
🔹 Rising bars = building momentum
🔹 Tallest bar = momentum peak (July 21)
🔹 Shrinking bars signaled a weakening trend before price ever reversed
🔹 Histogram turned negative → clean exit at the top
The MACD histogram is a direct visual of momentum:
– Bars rising = acceleration
– Bars shrinking = exhaustion
– Crossing below 0 = confirmation of reversal
⚙️ Strategy Settings:
– MACD: 25 / 60 / 220
– EMA Filter: 50 / 9 / 3
– Entry Mode: Histogram + Crossover Combo
