Range again $ETHDue to typical ETH behavior we can form a range
Can be identified without any lines where I suppose will stay for a month or so consolidating
ETHUSDT trade ideas

A look at a CPR strategy using monthly CPRA look at a CPR strategy using monthly CPR - Using conditions to enter and move SL

Ethereum Price to Reach $4,000, but Market Top Suggests DelayBINANCE:ETHUSDT current price stands at $3,872, holding above its local support level of $3,742. While ETH is approaching the $4,000 mark , it has not yet managed to breach it. This resistance could continue to hold, limiting Ethereum's immediate potential for further gains.
Currently, 96% of BINANCE:ETHUSDT total supply is in profit. Historically, when the profitable supply surpasses 95%, it signals a market top . This has been followed by price corrections as investors begin to secure profits.
If the market top triggers a reversal, BINANCE:ETHUSDT price could drop to $3,530 or lower . A sharp decline to $3,131 is also a possibility, erasing much of the recent gains made in the past month.
On the other hand, if the influx of new addresses continues and strengthens, BINANCE:ETHUSDT may finally break through the $4,000 resistance. Should this happen, ETH could rise towards $4,425, with a renewed surge in price. This would invalidate the bearish thesis and push Ethereum into a new bullish phase.

Eth Targetseth short term trade but once the market breals obver 3960 and sustain the longs will work great to 4350 level

ETHEREUM Long Outlook – Grand Supercycle Perspective(2025.05.21)Hello everyone,
This is SeoVereign, operator of the SeoVereign Team.
Today, I would like to share an Ethereum analysis based on the daily (1D) chart for the first time in a while.
Before reading this post, please refer to the idea I uploaded on April 18, 2025, through the link below. It will help you better understand the context:
🔗
(Clicking the image will take you to the corresponding link.)
If you look at the April 18 idea, you’ll see that I presented a bullish outlook based on the Deep Crab pattern.
This analysis is a continuation of that idea.
Through years of research, I’ve observed that when a Deep Crab pattern sees a rebound from the PRZ (Potential Reversal Zone), the trend that begins from that point tends to extend for a long time.
If you look closely at the chart, you’ll also see the 2.24 Fibonacci extension level.
Some people messaged me saying, “Since it went above 1.902 and even exceeded the 2.0 Fibonacci line, isn’t this Deep Crab invalid?”
However, I’ve studied harmonic patterns in depth for a long time and have set my own Fibonacci criteria based on that research.
In this particular Deep Crab case, I define the invalidation level as 2.24.
Therefore, I judged that the pattern is still valid, and this allowed me to forecast a long-term bullish trend.
Back to the main point,
Based on this Deep Crab pattern, I’ve consistently maintained a bullish outlook on the daily chart,
and so far, there have been no clear signals indicating a reversal into a bearish trend.
Thus, I would like to post a continuation of the bullish outlook on the daily chart.
On May 19, 2025, there was a sharp drop around the 2,587 USDT level.
At that time, our team expected the bullish trend that started from around 2,447 USDT to hold its low and continue.
However, the price broke below 2,447 USDT and made a new low.
We then closely monitored Bitcoin’s movement in response.
Typically, strong volatility occurs before a major trend begins.
Bitcoin was also showing significant volatility at the time.
So we concluded: “Let’s maintain a bullish stance, but do not be fully convinced until the previous high of 2,587 USDT is clearly broken upward.”
And by the time this post is published, we’ve confirmed that the price has indeed broken above 2,587 USDT.
Therefore, I have come to the conclusion that the bullish trend is still valid.
Based on this, I present the following three target levels.
🎯 SeoVereign’s Ethereum Bullish Targets
1st Target: 3,000 USDT
2nd Target: 3,400 USDT
3rd Target: 3,700 USDT
The market still shows strong volatility.
I sincerely hope you all trade wisely and calmly, achieving great returns,
and may great fortune be with you both in trading and in life.
I’ll see you again in the next daily analysis.
Thank you.
- SeoVereign

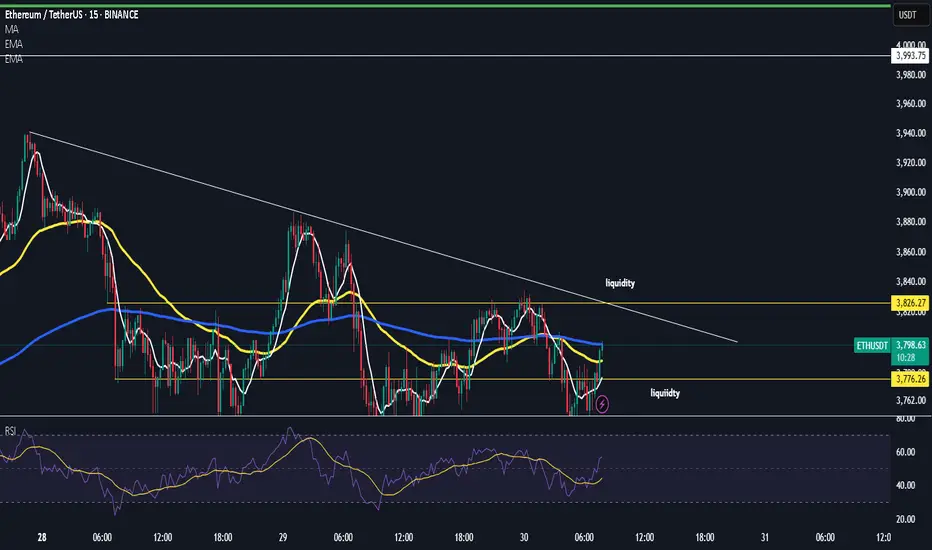
ETH-----Buy around 3850, target 3930 areaTechnical analysis of ETH contract on July 28:
Today, the large-cycle daily level closed with a small positive line yesterday, the K-line pattern continued to rise, the price was above the moving average, and the attached indicator was running in a golden cross. The general trend of rising is still very obvious. The current price has deviated from the moving average and returned to the moving average support position near the 3775 area, so you still need to pay attention to the risk trend of retracement in trading. The overall trend of the short-cycle hourly chart is in a volatile upward trend, but the price is relying on the support of the MA5 and MA10 daily moving averages to rise, and the general trend of rising is relatively obvious, so you still need to find obvious signals to enter the market during the day. The current four-hour moving average support position is near the 3850 area, and the hourly chart continues to fall.
Today's ETH short-term contract trading strategy:
Purchase at the 3850 area when retreating, stop loss at the 3820 area, and target the 3930 area;

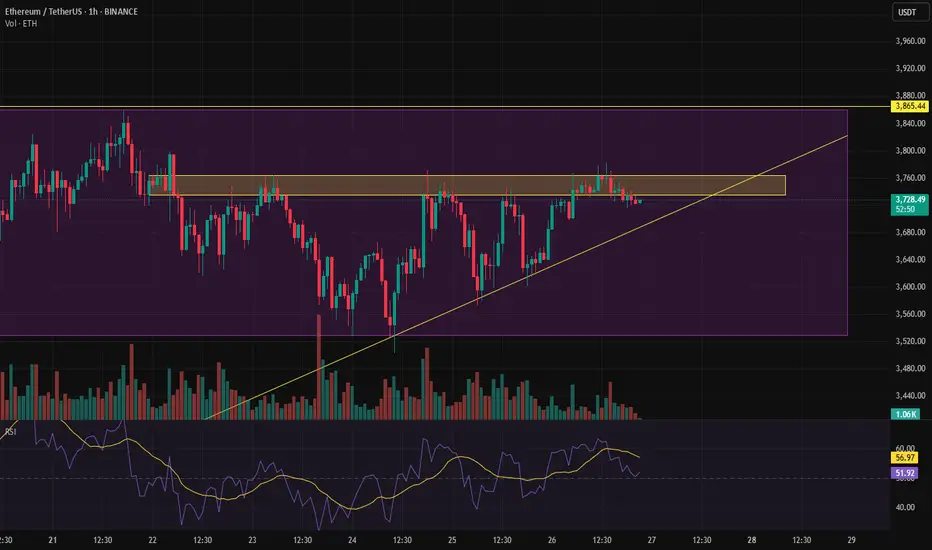
ETH Daily – Triple Rejection Zone Back in PlayEthereum’s pushing back into one of the most important resistance zones on the chart — the same level that’s caused three major rejections in the past year.
Now we’re testing it again, but this time momentum’s different. Daily structure is stronger, volume’s climbing, and bulls are showing no hesitation.
Here’s what matters:
– Triple top? If rejected again, this zone holds the trend hostage
– Break + retest? That’s the setup bulls have been waiting for
– Either way, this is a high-stakes level — and price won’t stay here long
Eyes on ETH. This zone will decide the next leg.
#ETH #Ethereum #TripleTop #ResistanceTest #CryptoTrading #DailyChart #TechnicalAnalysis #QuantTradingPro

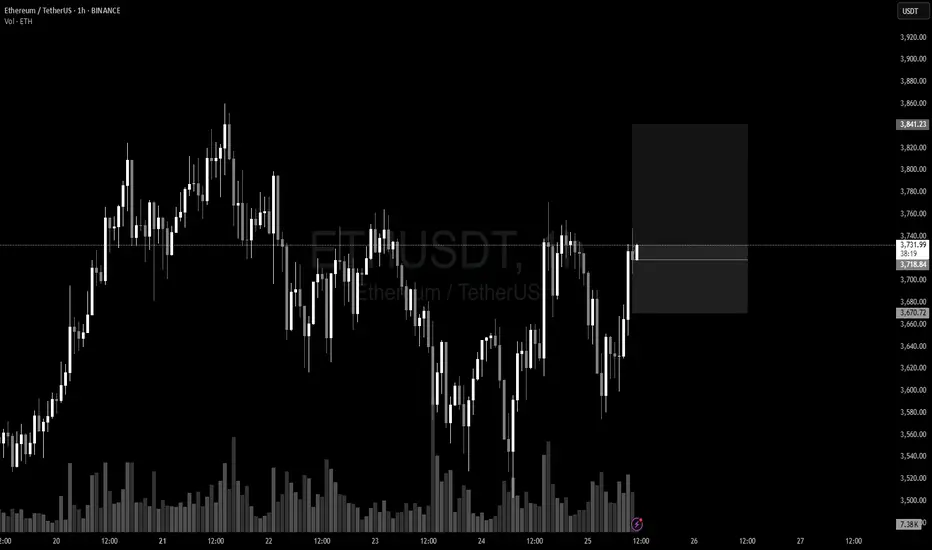
Very low volumeLow volume before momentum — something’s cooking. Let’s see if it breaks up or down. 🔍📉📈
Ethereum Analysis + Market Overview 🚀 Ethereum Analysis + Market Overview 🚀
Before diving into Ethereum, let’s quickly review the overall market conditions 👇👇👇
(For a more detailed market analysis, you can check my previous post, I’ll link it below.)
---
🔹 Analysis style:
Reviewing previous highs/lows breakouts in the mid-term (MWC - 4H).
Entries based on momentum & volume.
---
♦️ USDT.D
Support: 4.22
Max expected correction: 4.51
If 4.51 breaks upward, this could push us toward short positions.
---
♦️ BTC.D
Yesterday’s levels & analysis still remain valid.
Remember, on HWC (1D), after the recent downtrend, there’s only been one bullish candle.
For altcoins to rally: BTC.D must drop below 61.6 → 60.83 → 60.42.
Otherwise, if BTC.D grows (bearish for alts), 62.17 is the key resistance to watch.
---
♦️ TOTAL (Crypto Market Cap)
Must break 3.91 to confirm a bullish trend.
Early signal: 3.85 (1H timeframe).
---
♦️ TOTAL2 (Altcoin Market Cap)
Early bullish signal: 1.48
Confirmation level: 1.55
---
♦️ ETH (Ethereum)
Ethereum has shown strong support around 3500, despite the 48-hour drop, which reflects solid buying activity.
Additionally, positive whale news is increasing.
Early & risky trigger: 3653 (1H) – already broken.
Next potential entries:
3750 (1H)
3833 (4H)
Preferred entry: 3750, as it allows a tighter & safer stop-loss.
Beware: Fake breakout probability around 3833 is high.
Stop-loss for all 3 levels: 3455.
---
🔸 Entry Strategy:
If volume & momentum increase → place a stop-buy order on the exchange.
If volume is weak → wait for confirmed breakout above 3750.
---
♦️ ETH.D
The chart is fully bullish.
If ETH hits 3750, an early long position could be taken.
---
💎 Follow me & hit 🚀 for more real-time updates and setups!
---

ETH/USDT – Altseason Confirmation in Sight?Ethereum's recent breakout at 1900$ is showing strong momentum and may be signaling the long-awaited start of altseason. A daily close above the red resistance box will act as a key confirmation of this shift and could trigger a parabolic move across many altcoins.
For ETH, the next upside targets are:
$3,500
$4,000
$4,700
Stay alert — a confirmed breakout here could light the fuse for the broader altcoin market.

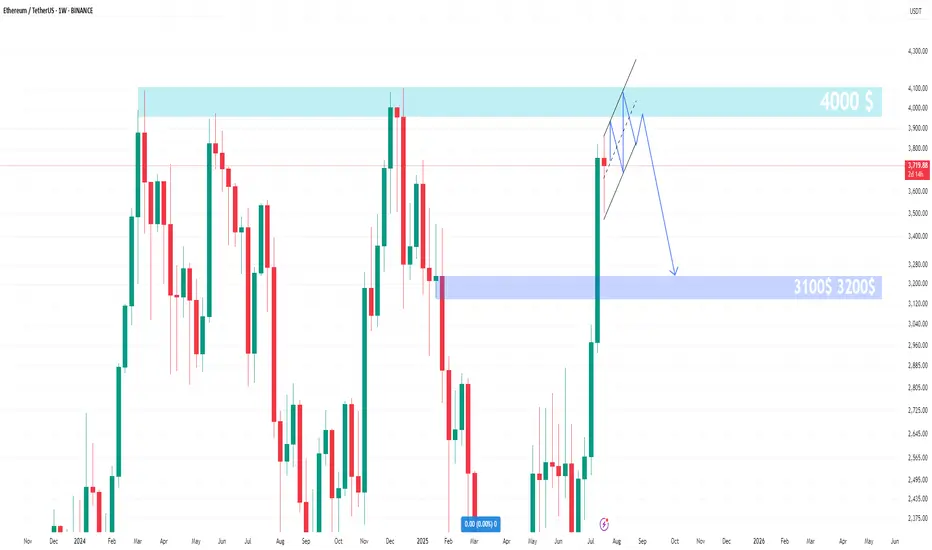
ETH-USDT Close to the supply areaI think Ethereum can grow to the $4,000 range. Then it will enter a good correction. What do you think? 😊
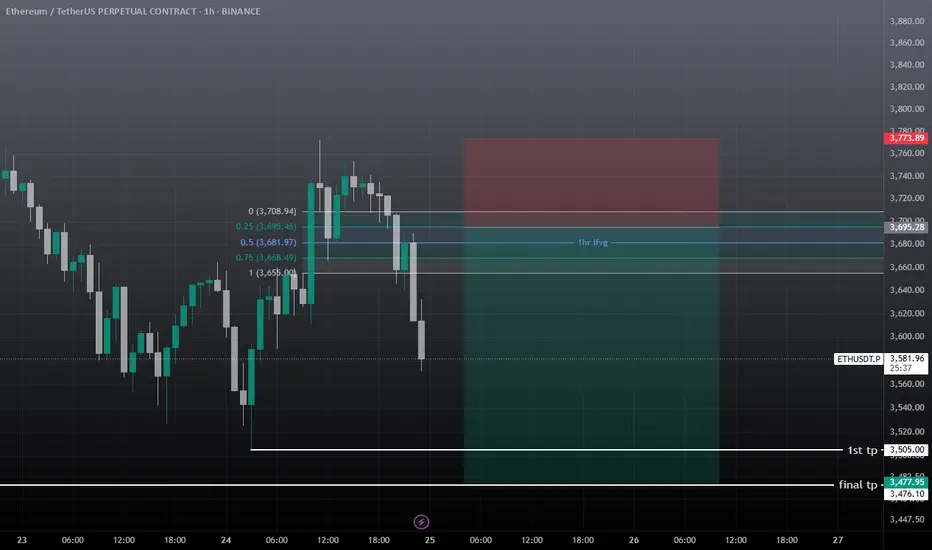
eth usdt short setupEth showing some correction towards 3.4-3.2k , I'm not bearish but alts needs some correction before another mini leg-up, must use sl, take some entry at 3681 and other on 3695. If tp hits first then ignore it.
ETH-----Sell around 3690, target 3615 areaTechnical analysis of ETH contract on July 25:
Today, the large-cycle daily level closed with a small positive line yesterday, the K-line pattern was single negative and single positive, the price was at a high level, and the attached indicator was golden cross and running with shrinking volume. From the big trend, the current trend is in a weak trend, the price rebound is not strong and has not continued, the trend is prone to fall under pressure and test the low point downward, so the trend has changed; the short-cycle hourly chart yesterday hit a high in the US market and fell under pressure in the Asian morning. The current K-line pattern is continuous negative, the price is at a low level, and the attached indicator is dead cross running. It is highly likely that the decline will continue during the day. Yesterday's low point of 3500 is the position that needs to be paid attention to today. The current hourly chart resistance is near the 3695 area.
Today's ETH short-term contract trading strategy:
Sell in the 3690 area after the rebound, stop loss in the 3720 area, and target the 3615 area;

ETH ~ Receive more than you expect!Such nice momentum to see but buys at red! but always place to limits to take those buys!

Sell opportunity?If the trendline breaks in the lower timeframe, a short position can be taken down to the bottom of the channel.**

ETH/USDTHello friends, my analysis for Ethereum is bullish and I think it will continue its recent gains. What do you think?

Ether is About to Break the FlagETH is making an attept to break flag formation. 3860 top could be the short term target for upward moves. Over the medium term, 4100 could be the main target. Our bull cycle top target is 6830 for the moment. This was a quick update,please check our earlier post for details.

Ethusdt buy / long setupEth has a good pullback yesterday. Eth showing strong momentum against all the market. Long at cmp 3641, first tp is 3960 the next is 4.1k. must use sl.

Ethereum (ETH) has taken the lead in the crypto market, surpassiEthereum (ETH) has taken the lead in the crypto market, surpassing Bitcoin."

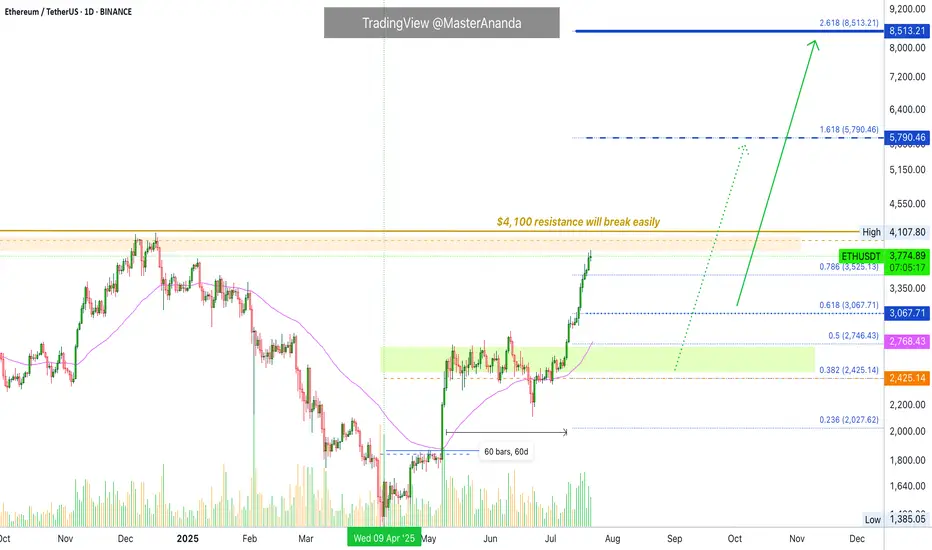
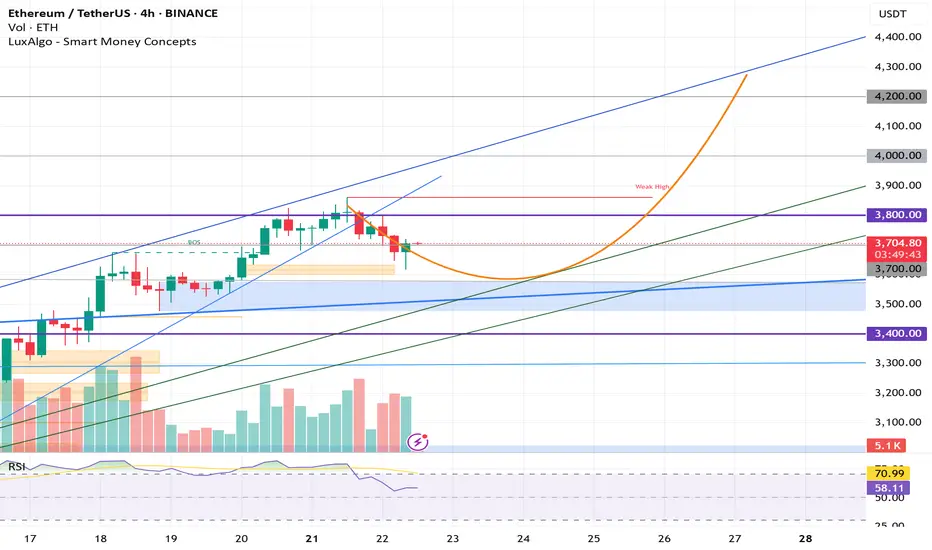
ETH in correction mode. But only for a while!As a result of breaking the previous biggest resistance of CRYPTOCAP:ETH , this was predicted to require a correction and range. However, Ethereum is expected to start breaking 4200 as soon as we anticipated.
Ethereum Update · Minor Break Below $4,000, Nothing ChangesOk. Straight up has been confirmed but as you already know, the market never moves straight down neither straight up. It seems Ethereum is about to take a small break. This shouldn't alarm you nor be a concern, we are set for sustained long-term growth. When bullish momentum dies down, the market tends to take a break, a pause, before additional growth.
Please remember that these breaks are very tricky, they can last just a few days, say 3-6 days, just as they can go for weeks. It is very hard to predict. In fact, we don't try to predict the duration of those, we simply focus on the bigger picture and know that a new all-time high will be hit in the coming months. This new all-time high will be followed by additional growth.
The short-term can be tricky though. Ethereum will continue rising, but watch out, it can make a pause and this time can be used wisely to profit beautifully from smaller altcoins. Don't let your capital just sit around when it can grow.
Ethereum is awesome but it is also a giant. The smaller altcoins is where the true opportunities lie. The opportunity to quadruple in a matter of months. And this process can be repeated several times for the duration of the bullish cycle.
Namaste.