ETH/USDTWe have talked about Ethereum many times and said that the main goal of Ethereum is 3000. Ethereum has had an upward movement and is now in a channel. The last movement it had led to a failure and it went back inside. I think Ethereum is bullish. Comment your opinion.
ETHUST.P trade ideas


Testing system on ETHlooked at 17 trades . 5 wins= 29.41% ,8 losses= 47.06%, 4 breakevens= 23.53%. average losing trade is 1% of account size and the average win is 5.14 times the risk==> 1:5.14 r:r .so every trade trade has a >50% chance of not losing and when it goes right it will hit hard, with the average winner is 5 times bigger than the loser. this is the worst performing pair that i have tested on so my confidence is boosted because i know that my edge is working in any market and the worst performing one is still profitable

Ethereum Weekly Chart Shows Strength Above Key SupportEthereum is showing strong structure on the higher time frame. After rejecting lower levels, price has reclaimed the mid support/resistance zone, and is now consolidating just above it.
What’s key here is the long-term rising trendline, which has held beautifully since 2020 and once again acted as a springboard for the recent bounce. This kind of confluence — trendline + zone flip — adds weight to the current price structure.
If ETH maintains this zone, we could see accumulation continue, followed by a breakout toward the upper resistance line. For now, the chart leans bullish, but patience is key as consolidation plays out.
DYOR, NFA


ETH/USDT – Bearish Reversal from Resistance Zone ETH/USDT – Bearish Reversal from Resistance Zone 📉
The chart above clearly illustrates a strong bearish setup on the ETH/USDT pair. Here's a professional breakdown:
📊 Technical Overview:
Resistance Zone (~2750–2850 USDT):
Marked by three distinct rejections (highlighted by red arrows).
Every attempt to break above this zone has resulted in a sharp price rejection, indicating strong selling pressure.
Current Price: 2529.69 USDT
Price has already broken below the immediate support formed after the last rejection.
The pair is now trending lower with bearish momentum.
Support Zone (~2250–2350 USDT):
This is the next major demand zone where previous accumulation took place.
The projection arrow indicates the likely path toward this area.
🔍 Price Action Insights:
Repeated failure to break resistance confirms a triple top pattern, a classic bearish reversal signal.
The recent sharp drop from the top is accompanied by strong bearish candles, showing momentum.
Minor consolidation might occur before continuation downward, as suggested by the zigzag arrow.
📉 Conclusion:
If bearish momentum sustains, ETH/USDT is likely to drop toward the 2,300 USDT support zone. A break below could open the door for even lower levels, while any bounce would need to reclaim the 2,700 USDT level to shift sentiment.
📌 Traders should watch for lower highs and bearish confirmations before entering short positions.


ETH/USDT Scalping Signal of the DayDirection: Empty
Entry Range: 2523 ~ 2528
Take Profit Target: 2508, 2501

ETH: Daily Timeframe 14/06/25Same idea as BTC — healthy corrective leg needed
Spot buyer at $2,100 and below
Will focus on accumulating other strong alts only when ETH is in my region of interest
No interest in predicting alt bottoms might bottom until BTC and ETH hit my buy zones


Every breakdown is just a setup — if you know where the reaccumuPrice collapsed. But I didn’t flinch. Because beneath that move sits something most won’t look for: High-Volume Rebalancing (H RB), paired with a clean FVG structure that tells me exactly where Smart Money wants to reload.
The structure:
The breakdown into ~2483 wasn’t just a move — it was intentional. That candle didn’t just fall, it delivered into the H RB zone and paused. Below that? Nothing but inefficient space and a tightly engineered low.
Above? Three clear target zones:
TP1: 2528
TP2 : 2582
TP3: 2656
Final objective: 2762 — the origin of the final collapse
Every leg above is engineered to grab liquidity, rebalance inefficiency, and then clear out the next range. It’s a chain of fulfillment.
The trade:
Entry: 2483–2500 zone
SL: Below the H RB zone (~2470)
TP1: 2528
TP2: 2582
TP3: 2656
Optional extension: 2762
We aren’t buying because it’s “down.” We’re executing because it’s deliberate.
Final thought:
“Collapse isn’t the end. It’s the invitation.”

Let the Market Teach You PatienceEvery red candle has a reason. Every drawdown has a lesson.
In this journey, it's not just about profits, it's about who you become.
As traders, we don’t just manage risk, we grow through it. Let patience, discipline, and humility shape you in silence, just like the markets do.
This is the mindset behind the candles.
#PEACE

Short trade Sell-side trade
ETHUSDT
Sat 14th June 25
7.30 am
Asia Session AM
Entry 2531.42
Profit level 2498.58 (1.30%)
Stop level 2547.18 (0.62%)
RR 2.08
Reason: Observing a previous failed sell-side trade, I decided to take another sell-side trade on this occasion. To add the trade was executed during the early Asia session, typically marked by lower liquidity and increased sensitivity to order flow.

ETHUSDT - Rare Flat Range + Potential Wyckoff SpringUnusually flat range – ETH has spent -30 days- oscillating between ≈ $2 470 (support) and $2 780 (resistance). Tight “boxes” of this length are uncommon in crypto and often precede explosive moves.
Spring attempt – Price just dipped below the range low on elevated volume. If it snaps back inside, Wyckoff theory calls this a Spring (Phase C of Accumulation).
Liquidity grab – The wick beneath support flushed late longs & triggered stops, handing larger players cheap inventory—classic shake-out behavior.
Confirmation Criteria
Volume Reclaim on high buy volume
Retest Behavior Low-volume retest into $2,470 = healthy
Structure 1H higher low (HL) during reclaim
Sentiment Perps short-heavy = fuel for squeeze

Ethereum. Daily Timeframe. Seller initiativeHey traders and investors!
📍 Context
• Market phase: Sideways range
• Current control: Seller initiative
📊 Key Price Action:
The price broke above the upper boundary of the range (2738) with a buyer KC candle, touching the 50% retracement level (2874) of the last weekly seller initiative (1).
However, the seller absorbed the buyer’s candle and pushed the price back inside the range (2), forming an IKC candle (3) — the highest volume candle within the seller’s initiative.
This sequence presents three bearish signals that support a potential continuation to the downside.
🎯 Trade Idea
Likely scenario: price tests the lower boundary of the range at 3,323.
🔸 In the meantime, it’s reasonable to look for short setups on lower timeframes within the current seller initiative.
🔸 If price reaches 3,323 and valid buyer patterns appear, this zone may offer a good opportunity for long entries.
This analysis is based on the Initiative Analysis concept (IA).
Wishing you profitable trades!

ETHEREUM ETHUSDT is on a demand floor ,awaiting buy liquidity ,it could seek liquidity before going long.
if buyers fail to hold strong on demand floor ,it will retest the descending trendline at 1300$ level.

ETH-----Sell around 2525, target 2475 areaTechnical analysis of ETH contract on June 14:
Today, the large-cycle daily level closed with a small negative line yesterday, the K-line pattern continued to fall, the price was below the moving average, and the attached indicator was dead cross. The decline in the big trend is still very obvious, but we still have to pay attention to the stimulus brought by the news data. The low support is still around the 2300 area; the short-cycle hourly chart yesterday's European session rose and corrected the US session. The price began to retreat under pressure in the Asian morning today. The current K-line pattern is continuous and the price is below the moving average. The attached indicator is dead cross, so it is likely to continue to fluctuate downward during the day.
ETH short-term contract trading strategy:
The current price is 2525, directly short, stop loss in the 2565 area, and the target is the 2475 area;

ETH UPDATE 🛡️ Ethereum Holds the Line — Critical Support Zone Tested Again
Because Ethereum has plummeted over 14% since Wednesday, traders and long-term holders are worried. Bullish investors expected ETH to break over $3,000 and confirm a wider cryptocurrency rise days earlier.
However, global turmoil has slowed markets. Israel's assaults on Iran and retaliations shook global markets on Thursday, causing crypto asset volatility and risk-off.
Historical trends between August 2021 and early 2024 suggest that keeping $2,500 has led to rallies reaching $4,000. Rekt believes Ethereum must maintain consistency around this zone to prevent a deeper retreat and maintain bullish momentum.
ETH has held $2,500 over five weeks, proving its stability despite numerous testing. In the weeks ahead, altcoins and the crypto market will depend on whether Ethereum can maintain this footing again.
Ethereum fell sharply from $2,830 this week to $2,556. On the daily chart, ETH has been rangebound between $2,500 and $2,830 for weeks. Ethereum has held above the 50-day and 100-day moving averages, which are rising, despite international threats.
The red 200-day moving average at $2,642 has provided resistance. A retracement followed ETH's short break above this level, which it failed to keep. Recent volumes have increased due to heightened attention and emotive price responses in the Israel-Iran conflict.
The $2,500–$2,520 support zone is important. This region has been a floor before and might rocket bulls if they recover control. A clear fall below $2,500 might turn sentiment negative and lead to $2,300.

ETH/USDT Technical Overview – June 14, 2025📝 ETH/USDT Technical Overview – June 14, 2025
Timeframe: 1D (Daily)
Exchange: Bybit Spot
Current Price: $2,538.97
Daily Change: -1.55%
🔍 Market Structure Overview:
Primary Trend: Still bearish on the macro (lower highs from November to April).
Change of Character (CHoCH): Detected around mid-April → first signal of bullish intent.
Short-term Trend: Bullish structure formed from April to early June (marked "UP TREND").
Recent Break: Price has broken the bullish trendline and is currently pulling back.
🧠 Smart Money Concepts:
Fair Value Gap (FVG):
Noted below the current price zone – acting as a potential draw for liquidity. Price may fill this imbalance before deciding on further direction.
CHoCH Confirmation:
The change in character initiated a shift, but without a BOS (Break of Structure) above $3,034, macro bearish bias remains intact.
🛠️ Key Levels:
Type Price ($) Notes
Resistance 3,034.26 Key swing high, trendline confluence
Support 2,397.35 Minor support
Support 2,313.92 Local liquidity zone
Support 2,200–2,104 Strong demand zone + FVG area
Support 1,537.55 Major historical support
🔮 Potential Scenarios:
📉 Bearish Scenario:
Continuation of rejection from downtrend resistance.
Pullback into the FVG around $2,200–$2,100.
Potential bullish reaction from there.
If broken, next major support lies around $1,537.55.
📈 Bullish Scenario:
Support holds at $2,313–$2,200, bounce begins.
Break and close above $2,800–$3,034 would confirm a macro trend shift.
⚠️ Bias Today:
Neutral to Bearish
Until we see a strong bullish reaction from the FVG or a reclaim of the trendline, pressure remains to the downside.

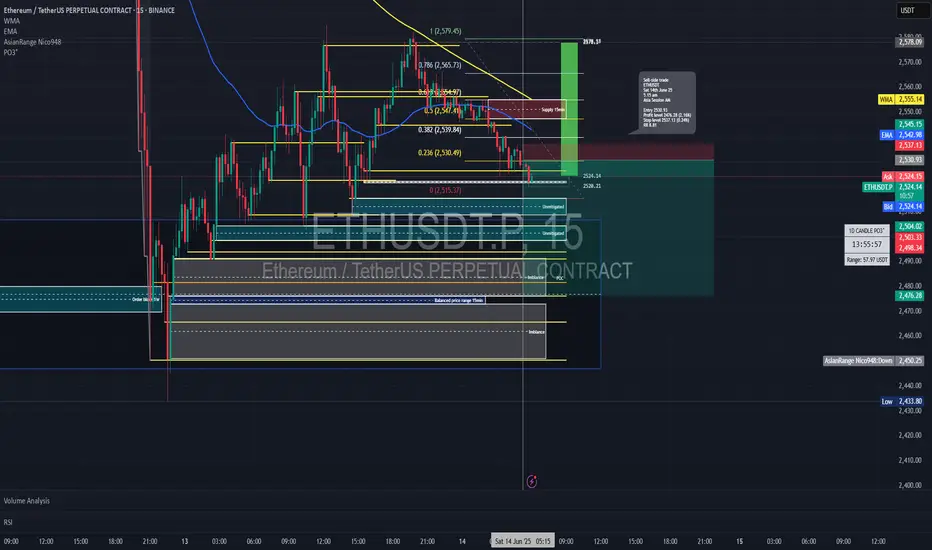
Short trade Sell-side trade
ETHUSDT
Sat 14th June 25
5.15 am
Asia Session AM
Entry 15min TF
Entry 2530.93
Profit level 2476.28 (2.16%)
Stop level 2537.13 (0.24%)
RR 8.81
Sell-side trade idea narrative based on the ICT seek and destroy indicator, taking session liquidity into account for directional bias, along with unmitigated price zones and imbalanced price ranges for confluence.
ETH - AnalysisEvery time Ethereum has broken through $2,800,
it triggered a massive move.
Over the past two years, this level has acted as key support or resistance 7 times.
Once we break through and get a clean, sustained close above, the next major rally is likely to follow.
Keep a close eye on this price level — it will be the turning point.
LFG

ETH LONG TRADE PLAN.ETH long below the liquidity line in demand zone. Below sell side liquidity is our entry zone.
