eth buy longterm"🌟 Welcome to Golden Candle! 🌟
We're a team of 📈 passionate traders 📉 who love sharing our 🔍 technical analysis insights 🔎 with the TradingView community. 🌎
Our goal is to provide 💡 valuable perspectives 💡 on market trends and patterns, but 🚫 please note that our analyses are not intended as buy or sell recommendations. 🚫
Instead, they reflect our own 💭 personal attitudes and thoughts. 💭
Follow along and 📚 learn 📚 from our analyses! 📊💡"
ETHUST.P trade ideas

tahlile eth baye in mahHere is the English translation of your analysis:
---
**Comprehensive Analysis of Ethereum**
Ethereum is currently at a critical point and is experiencing significant volatility. It is attempting to break through key resistance levels to continue its upward trend. However, failure to break these levels could lead to a price decline. Various factors, such as whale activity and the break of key resistance levels, can influence Ethereum's future trend.
### **Technical Analysis**
**Current Trend:**
Ethereum is currently trading in a range, fluctuating between support and resistance levels.
**Support Levels:**
Key support levels are at **\$1,750** and **\$1,650**.
**Resistance Levels:**
Key resistance levels are at **\$1,930** and **\$2,100**.
### **Possible Scenarios**
* **Bullish:** If Ethereum can break above the \$1,930 resistance level and hold above it, it could move toward higher targets.
* **Bearish:** If Ethereum fails to break through the resistance levels, it may decline toward lower support levels.
### **Whale Activity**
Whale activity currently has the potential to significantly impact Ethereum's price trend. If whales continue to accumulate Ethereum, it could support a reversal of the bearish trend.
---
### **Fundamental Analysis**
**Correlation with Bitcoin:**
Ethereum remains heavily influenced by Bitcoin, and its price movement is largely dependent on Bitcoin’s trend.
**New Projects:**
The development of new projects within the Ethereum ecosystem can drive demand and increase its price.
**Regulations:**
New regulations in the cryptocurrency space can affect Ethereum’s future.
---
### **Recommendations**
* **Monitor Whale Activity:**
Investors should pay close attention to whale behavior in the Ethereum market.
* **Watch for Resistance Breakouts:**
Breaking through key resistance levels could signal the beginning of a bullish trend.
* **Risk Management:**
Given the high volatility in the crypto market, effective risk management is crucial in investment strategies.
* **Further Research:**
Conducting additional research on Ethereum and the factors influencing it is highly recommended for better decision-making.
> **Note:** This analysis is a general overview of Ethereum’s current status and should not be considered as investment advice.
---
Let me know if you'd like this formatted as a PDF, presentation, or infographic.

YET AGAIN!! ~~ ETH to $3200!!My shitposting 3 times for eth because it happens!! It happenss! ITT HAPPENS!!! I said it

BUY ETHUSDT 16.7.2025Confluence order: BUY at M15
Type of order: Limit order
Reason:
- M15~FIBO 0,5-0,618 (same position)
Note:
- Management of money carefully at the price of sub key M15 (3152)
Set up entry:
- Entry buy at 3137
- SL at 3127
- TP1: 3152
- TP2: 3164
Trading Method: Price action (No indicator, only trend and candles)

ETH Flash Crash Setup – Gaps Below to WatchEthereum broke out fast, too fast. In the process, it left two clear value gaps around $2850 and $2690 — areas where price barely traded. These usually get revisited.
I’m watching those zones for a potential flash crash setup. If we get a sharp wick down, that’s where I want to be a buyer. No chasing.
Limit orders layered in. Plan is simple:
$2850 — first tap
$2690 — full imbalance fill
Stops below $2600 if triggered
Not saying it has to happen, but if it does, I want to be ready. Mark your levels.
—
Trade safe. This is just my setup, not advice.

$ETH: The 1-week chart is an absolute disaster!Once again, I want to make it clear: I’m naturally a bull. But I live in Thailand, far from the noise of influencers shouting "buy, buy, buy!" I’ve learned my lesson—when they scream buy, you get rekt. That’s why I rely solely on the charts.
Charts are just mathematics—they don’t lie. So here’s my honest interpretation of what I’m seeing for Ethereum:
🕐 Daily Outlook
Yes, we might see a few nice bounces in the short term. But if your plan is to hold ETH, you should be paying attention to higher timeframes, especially the weekly.
📉 Weekly Chart — It's Ugly
We’re clearly in a descending wedge, and overall, ETH is bearish. Don’t be fooled by the hype or the people trying to take your money.
- RSI is bearish, with a strong bearish divergence still unfolding.
- MACD is on the verge of a bearish crossover, and what’s worse, it’s doing that without even touching the neutral zone—a major red flag.
The last time we saw this setup? November 2021. The price crashed below $1,000.
🔍 Where’s the Support?
This cycle, the support zone looks closer to $1,500, mainly due to institutional interest and the ETF narrative. A full retracement seems unlikely, but technically speaking—it’s still a possibility.
🤔 Why Is This Happening Despite Institutional FOMO?
Here’s the key: ETH has staking, and every month, new CRYPTOCAP:ETH is minted to pay stakers. This creates constant inflation. On top of that, many stakers compound their rewards, accelerating the inflation. And guess what? These same stakers are selling as soon as ETH pumps.
So fundamentally, Ethereum is under pressure because of its own staking mechanics—a system flaw that creates long-term selling pressure.
Do your own research (DYOR). I could be wrong—but at least I’m not trying to sell you a course.

ETH Price Forecast: Keep Bullish Above 2519ETH Price Forecast: Keep Bullish Above 2519
Finally, ETH is holding strong above 2520. Over the previous days, ETH lost momentum and was about to invalidate the pattern, as it reached 2475.
However, the uncertain situation from geopolitical tension and tariffs is still supporting the bulls on the crypto market.
On the other hand, ETH still has room for growth and as long as the price respects this flag pattern, the chances of ETH rising further remain high despite the developments in BTC.
You may find more details in the chart!
Thank you and Good Luck!
PS: Please support with a like or comment if you find this analysis useful for your trading day

ETH Pullback Before Next Rally? Hello guys!
Ethereum is currently testing a strong resistance zone around the $2,678 level, which has previously acted as a key barrier. Price action has been climbing steadily within an ascending channel, indicating a clear bullish trend in play.
However, since ETH is right at the resistance, we could see a short-term correction or pullback toward the $2,560–$2,580 support range (highlighted zone), which also aligns with the midline of the channel and previous consolidation structure.
If this support holds, a healthy bounce from this area would likely push ETH toward the next bullish target around the $2,760–$2,800 zone, which sits near the upper boundary of the current channel.

Resistance zone: 3265.0-3321.30
Hello, traders.
If you "Follow", you can always get the latest information quickly.
Have a nice day today.
-------------------------------------
(ETHUSDT 1D chart)
It is showing an upward breakout of the important zone of 2419.83-2706.15.
We need to see if the price can be maintained by rising above the Fibonacci ratio of 0.5 (2788.93).
If so, it is expected to rise to the resistance zone of 3265.0-3321.30.
The important zone of 2419.83-2706.15 is the support and resistance zone that can lead to a full-fledged uptrend.
Therefore, if it falls below this zone, we should stop trading and watch the situation.
-
Thank you for reading to the end.
I hope you have a successful trade.
--------------------------------------------------
- This is an explanation of the big picture.
(3-year bull market, 1-year bear market pattern)
I will explain more details when the bear market starts.
------------------------------------------------------

ETH Short OpportunityETH Short Opportunity 🟥 | Watch 3428 Closely
Ethereum is approaching a key resistance at $3428 — this zone could offer a great short setup if confirmed.
First target on the downside: $3340 📉
High R/R potential if price rejects this level.
Stay sharp and manage your risk!
🔔 Follow me for more real-time trade ideas and technical insights.

$ETH IS GOING TO MAKE ATHsBitcoin amd Etheureum will continue to rise until Ethereum clears these highs. The market is not done yet.
Although, I expect Bitcoin to retrace and consolidate more, i expect more bullish scenario’s than Bearish.

Ethereum Analysis – Vitalik’s Gas Cap Proposal Adds PressureToday, I want to show you the possible moves for Ethereum ( BINANCE:ETHUSDT ) this week.
Please stay with me .
Let’s first take a look at the important news that has come for Ethereum in the last 24 hours :
Ethereum’s Gas Cap Proposal Sparks Concerns
Ethereum co-founder Vitalik Buterin recently proposed EIP-7983 , introducing a gas limit cap to prevent potential DoS (Denial of Service) attacks on the network.
Bearish Takeaways:
This proposal reveals a current vulnerability in Ethereum’s infrastructure. If gas limits grow unchecked, nodes may fail to sync, leading to possible network instability.
Imposing a gas cap could temporarily reduce transaction throughput, affecting DeFi protocols and NFT platforms that rely on Ethereum’s scalability.
The market tends to react cautiously to core protocol changes, and this uncertainty could trigger short-term selling pressure.
Bullish Counterpoints:
The cap aims to strengthen the network’s long-term stability against spam and DoS attacks.
It’s still in the proposal stage, with no immediate impact on users or network performance.
Conclusion:
While the long-term impact may be positive, the short-term uncertainty and exposed risks provide a bearish narrative for Ethereum, especially amid growing competition from alternative chains.
--------------------------------------
Now let's take a look at the Ethereum chart on the 4-hour time frame .
Ethereum is currently trading near the Heavy Resistance zone($2,929-$2,652) and Resistance lines , and is also trying to break the Support line .
In terms of the Elliott Wave theory , it seems that Ethereum has completed the Zigzag Correction(ABC/5-3-5) , so we can expect the next bearish wave .
I expect Ethereum to fall to at least $2,433 AFTER breaking the Support line, and if the Support zone($2,491-$2,323) is broken, we should expect further declines.
Second Target: $2,374
Note: Stop Loss (SL) = $2,689= Worst Stop Loss(SL)
Please respect each other's ideas and express them politely if you agree or disagree.
Ethereum Analyze (ETHUSDT), 4-hour time frame.
Be sure to follow the updated ideas.
Do not forget to put a Stop loss for your positions (For every position you want to open).
Please follow your strategy and updates; this is just my Idea, and I will gladly see your ideas in this post.
Please do not forget the ✅' like '✅ button 🙏😊 & Share it with your friends; thanks, and Trade safe.

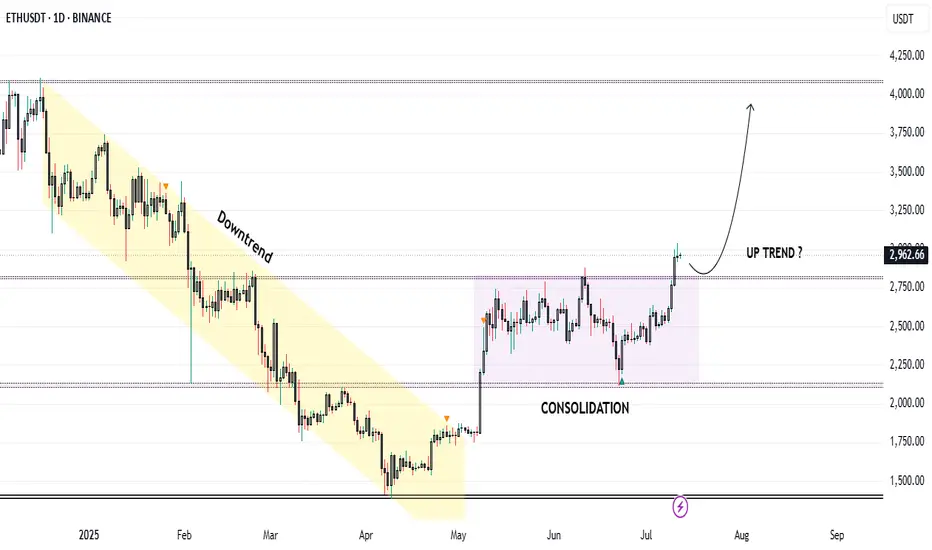
Trend Resumes: Ethereum Breaks Consolidation, Eyes $4050Market Structure Overview:
Markets typically move in two major phases:
🔹 Trend Phase (directional movement)
🔹 Consolidation Phase (sideways movement or accumulation/distribution)
These phases repeat as: Trend → Consolidation → Trend → Consolidation
Ethereum Price Action Breakdown (Daily Timeframe):
Mid-December to End-April: Clear downtrend phase.
May to Early July: Entered a consolidation zone, forming a tight range.
Current Status (July):
🔹 Ethereum has broken out of the consolidation range.
🔹 Currently trading around $3000, confirming strength.
🔹 This breakout may potentially signal the start of Altcoin Season.
Trade Setup – Long Position Idea:
Entry (Buy Zone): Around $2850 (retest of breakout resistance).
Target:
🔹 Primary Target: $4050
🔹 This aligns with a major resistance and Fibonacci extension zone.
Stop Loss: $2600 (below key structure support).
Technical Confluences:
* Breakout above multi-week range.
* Retest of resistance turned support at \$2850.
* Psychological round level near \$3000 acting as a magnet.
* Volume confirmation on breakout (optional to mention if on chart).
Risk Note:
⚠️ Caution: The Market may turn volatile due to unexpected geopolitical or macroeconomic news. Always follow risk management and avoid overleveraging.
Conclusion:
Ethereum’s breakout from a multi-month consolidation phase indicates a potential shift in momentum. If retest levels hold, this could be the beginning of a strong upside rally, possibly leading to a broader Altcoin Season. Traders can position themselves accordingly with a well-defined risk-reward setup.
ETH Needs big money injection ASAPRising wedge presented in the chart is a bearish pattern.
To cancel this bearish pattern we need :
- Break the $2,800 level with bigh green candle
- The break should occur with big volume
- The break should be as soon as possible.
Otherwise, the downtrend will continue and he decline will be sharp.
COINBASE:ETHUSD BITSTAMP:ETHUSD CRYPTOCAP:ETH CRYPTOCAP:ETH.D


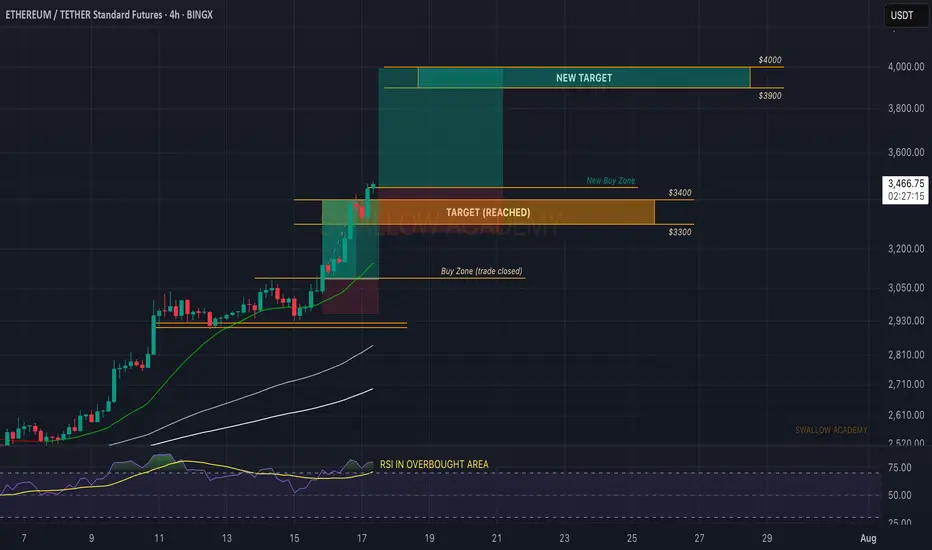
Ethereum (ETH): Yesterdays Target Reached | Now Looking at $4000Ethereum is on fire, where our yesterday's target was reached without any hesitation.
Now we shared a TA this week on a weekly timeframe where we showed that one of our major targets is $4000. So we are aiming to see that one to be reached now; momentum is good so we might as well fill it quite quickly.
Swallow Academy
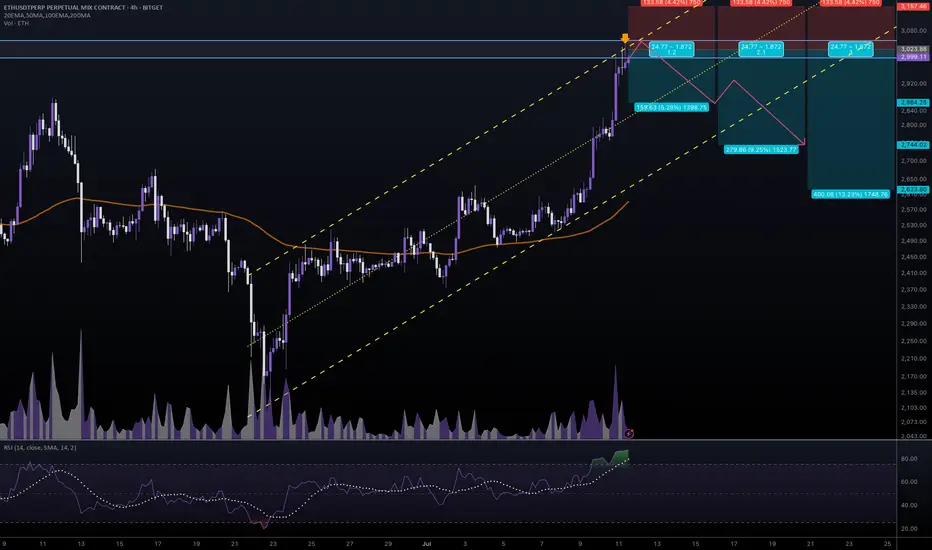
#ETHUSDT #4h (Bitget Futures) Ascending channel on resistanceEthereum printed a gravestone doji followed by a shooting star, RSI is overbought, local top seems in.
⚡️⚡️ #ETH/USDT ⚡️⚡️
Exchanges: Bitget Futures
Signal Type: Regular (Short)
Leverage: Isolated (9.0X)
Amount: 5.0%
Entry Zone:
2996.99 - 3050.49
Take-Profit Targets:
1) 2864.25
2) 2744.02
3) 2623.80
Stop Targets:
1) 3157.46
Published By: @Zblaba
CRYPTOCAP:ETH BITGET:ETHUSDT.P #4h #Ethereum #PoS ethereum.org
Risk/Reward= 1:1.2 | 1:2.1 | 1:3.0
Expected Profit= +47.5% | +83.3% | +119.0%
Possible Loss= -39.8%
Estimated Gaintime= 1-2 weeks
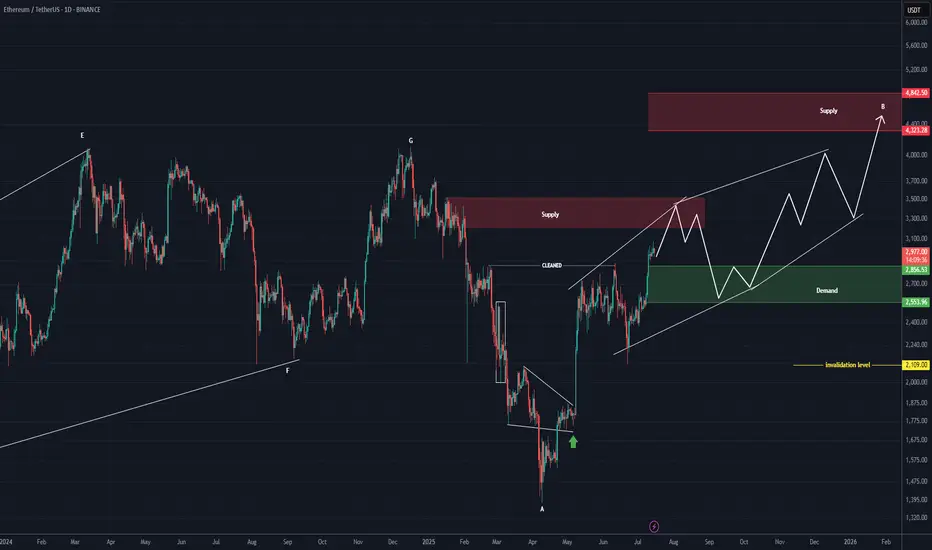
ETHEREUM Roara Map (1D)The previous phase of Ethereum appears to have been a completed diametric, and now it seems we are in a flat pattern.
It can be said that we are currently in wave B of the flat, which itself appears to be a diametric.
This diametric could even extend to the 4300–4800 range.
The green zone is the rebuy area.
A daily candle close below the invalidation level would invalidate this analysis.
For risk management, please don't forget stop loss and capital management
Comment if you have any questions
Thank You
#ETH is about to reach the resistance zone 📊#ETH is about to reach the resistance zone ⚠️
🧠From a structural perspective, we are about to reach the resistance zone at the daily level, so we need to be wary of the risk of a pullback. If your cost price does not have much advantage, then please remember to lock in profits in time.
➡️New long trades need to wait patiently for a pullback to occur before participating, or the trend is relatively strong, and continue to consolidate sideways to form a new long structure to continue the long trend, otherwise we can't chase the rise near the resistance zone.
Will we start a pullback from here? Let's see 👀
🤜If you like my analysis, please like 💖 and share 💬
BITGET:ETHUSDT.P

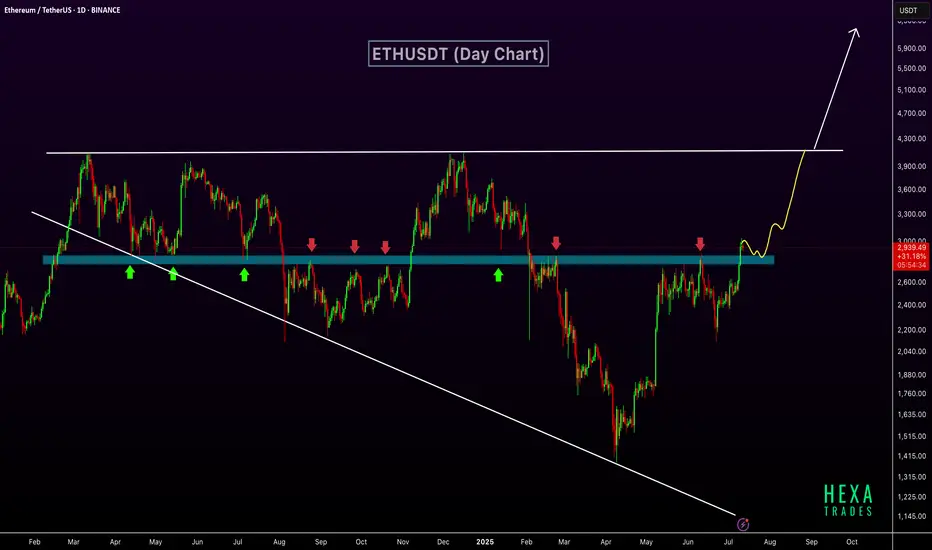
ETH Breaks Key Resistance – $6K Possible if Wedge BreaksETHUSDT has broken out above a key horizontal resistance zone that has historically acted as a strong support and resistance level. This zone, marked in blue, has seen multiple rejections and bounces over the past year, confirming its significance.
The recent breakout above this zone indicates a shift in market structure and suggests growing bullish momentum. The price action shows a clean move above resistance, with potential for a retest before continuing higher. The market is also forming a long-term broadening wedge pattern. The next target lies near the upper resistance of the wedge, around $4,000. If the price breaks above this broadening wedge, it could open the path toward the $6,000 level.
Regards
Hexa
ETHEREUM DAILYETHEREUM DAILY CONFIRMATION FOR LONG IS NOT APPROVED YET.BE PATIENT
Ethereum Approximately $2,930.55 per ETH, watch for 30754 ascending trendline breakout or pull back into 2680 zone ,if we keep buying then 4100 zone will be on the look out as immediate supply roof break and close will expose 4900.my goal in this context is to see ETHUDT buy into my purple supply roof,it will happen .
Market Capitalization: Around $358 billion, making Ethereum the second-largest cryptocurrency by market cap.
Circulating Supply: About 120.7 million ETH.
Recent Performance: Ethereum has gained roughly 17.3% over the past week and about 7% over the last month, though it is down about 4% compared to one year ago.
Market and Technical Overview
Ethereum remains a key player in the blockchain ecosystem, supporting decentralized finance (DeFi), NFTs, and smart contract applications.
The price is consolidating near the $3,000 level, with technical indicators suggesting moderate bullish momentum but some short-term volatility.
Trading volume in the last 24 hours is around $29 billion, indicating strong liquidity and active market participation.
Ethereum continues to be a foundational blockchain platform with strong institutional interest and ongoing development, maintaining its position as a major digital asset in 2025.
#ethusdt #btc #bitcoin

ETHUSDT BUY / Long SetupThis 4hrs candle closes above the mentioned level, then took long from 50% fib level of the fvg, and put sl below the recent swing low, I will update the trade whether it's active or not? tp towards 3.3-3.4k , while btc.d getting recked so becareful shorting any altcoin.

ETHEREUM ETHEREUM DAILY CONFIRMATION FOR LONG IS NOT APPROVED YET.BE PATIENT
Ethereum Approximately $2,930.55-2,925$ per ETH, watch for 30754 ascending trendline breakout or pull back into 2680 zone ,if we keep buying then 4100 zone will be on the look out as immediate supply roof break and close will expose 4900.my goal in this context is to see ETHUDT buy into my purple supply roof,it will happen .
Market Capitalization: Around $358 billion, making Ethereum the second-largest cryptocurrency by market cap.
Circulating Supply: About 120.7 million ETH.
Recent Performance: Ethereum has gained roughly 17.3% over the past week and about 7% over the last month, though it is down about 4% compared to one year ago.
Market and Technical Overview
Ethereum remains a key player in the blockchain ecosystem, supporting decentralized finance (DeFi), NFTs, and smart contract applications.
The price is consolidating near the $3,000 level, with technical indicators suggesting moderate bullish momentum but some short-term volatility.
Trading volume in the last 24 hours is around $29 billion, indicating strong liquidity and active market participation.
Ethereum continues to be a foundational blockchain platform with strong institutional interest and ongoing development, maintaining its position as a major digital asset in 2025.
#ethusdt #btc #bitcoin
