ETH Structure Tightens – Big Move Loading?📉 CRYPTOCAP:ETH – Watching the Structure Closely
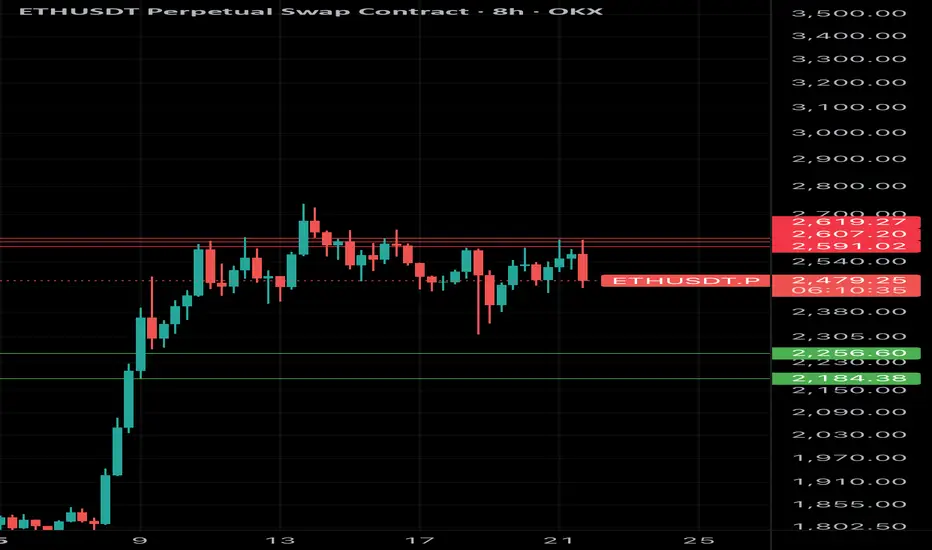
ETH is still facing resistance around the $2580+ level — bulls haven’t sealed the breakout just yet 🧨
On the lower timeframes, a fresh symmetrical triangle has formed, signaling indecision and coiled momentum 🔺
As mentioned before, holding above $2400 keeps the bullish macro structure intact 💪
A breakout from this pattern could kick off the next major leg — either direction, expect volatility.
👀 Eyes on ETH — it's reaching a crucial inflection point!
ETHUST.P trade ideas

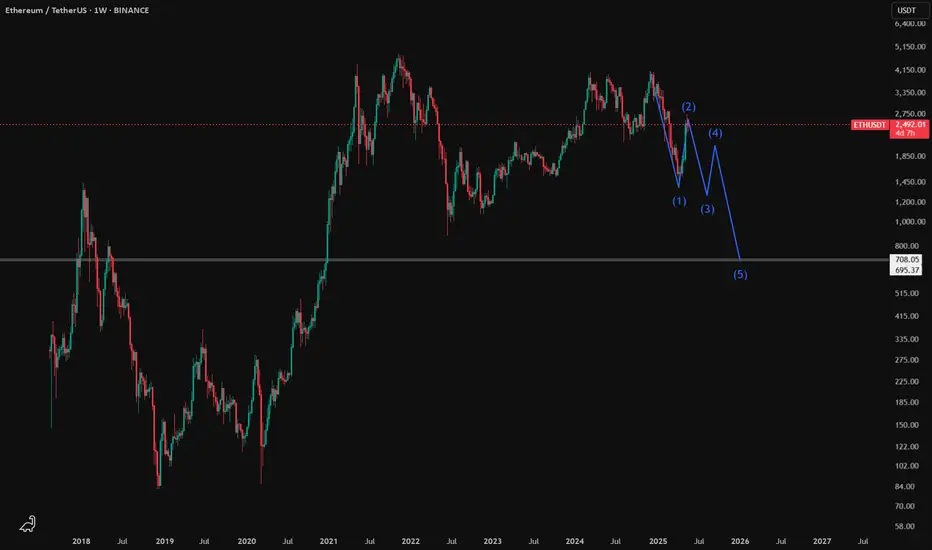
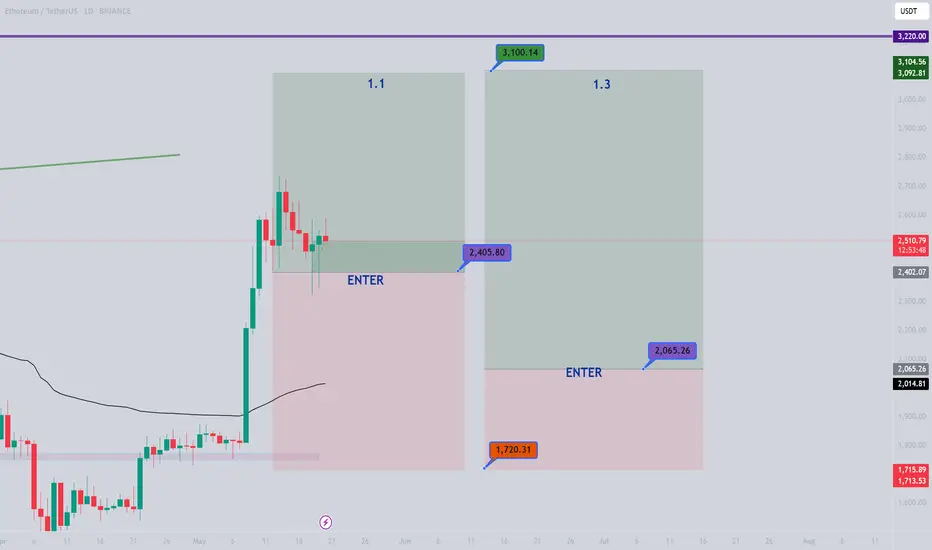
Going Short on EthereumBINANCE:ETHUSDT
Ethereum has moved up strongly in the last 6 weeks to a key resistance level, which is the 50% Fibonacci Retracement, leaving a huge Fair Value Gap between the $2,400 USDT and the $1,900 USDT level. Most Fair Value Gaps get filled, and I expect it to be the case this time. The Gap closes at around $1,900 USDT.
I also see this move overextended in the short term and do for a correction, so I am going short here.
I hope you find this interesting.
Good luck to you

BTC on the Move — Will ETH Join the Rally?Hello everyone!
Bitcoin is on the rise, targeting the liquidity zone above $110,000 . This brings up a key question: Will BINANCE:ETHUSDT follow with a rally of its own?
In this idea, I’ll analyze the current ETHUSDT setup and highlight the key levels to watch for a potential breakout.
ETHUSDT on 4H timeframe
- The previous 4H candle closed above $2,553 , which is a strong bullish signal, as this level has previously acted as firm resistance with multiple rejections.
In my view, ETH is now targeting the liquidity at the top of the falling wedge around $2,738.
If this level is successfully swept, the next likely target is $2,878, where a significant amount of liquidity sits above this swing high.
- If a quick pullback occurs, there is strong demand in the $2,338–$2,311 range , which could serve as a solid support zone. However, in my opinion, this scenario is less likely to play out at the moment .
In conclusion, ETH is well-positioned for a continuation if market conditions remain favorable.

ETH$ As far as we see as I explained before eth got rejected will start doing DCA within the green levels cheers …
ETH Short IdeaWill everyone one day collectively agree to ditch ETH's and its high fees? Smart contracts that perform millions of transactions cannot continue to be burdened by high fees. ETH short idea.
ETHUSDT - UniverseMetta - Signal #ETHUSDT - UniverseMetta - Signal
H4 - Formation of a 3-wave structure in continuation of the upward trend + exit from the channel. Stop behind the minimum of the 2nd wave.
Entry: 2589.93
TP: 2823.31 - 2992.67 - 3147.16 - 3408.07
Stop: 2437.44


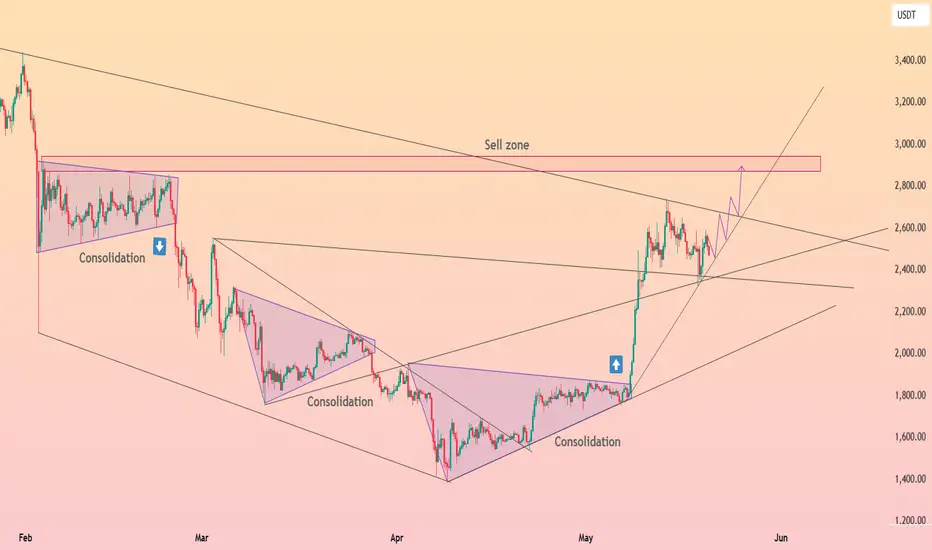
HolderStat┆ETHUSD reboundedCRYPTOCAP:ETH exploded out of its multi-month falling wedge, racing from 1.8 k to 2.7 k. It now straddles the broken wedge roof plus a fresh rising guide at 2.45-2.50 k. Hold that shelf and the chart still projects into the 2.9-3.0 k sell zone; slip beneath 2.35 k and bulls will likely regroup at deeper support near 2.2 k. 🎯
ETHUSDT is Breaking Out!! Is the Bull Run Finally Here?After a long period of consolidation within a descending channel, BINANCE:ETHUSDT is showing signs of life as it finally breaks out with bullish intent. This technical breakout could mark the beginning of a fresh bull run, reminiscent of past explosive moves we’ve seen from MARKETSCOM:ETHEREUM following major corrections. Historically, CRYPTOCAP:ETH has experienced drawdowns of over 90%, only to bounce back stronger and reach new all-time highs.
Currently, BITSTAMP:ETHUSD remains deep in the oversold zone, suggesting it’s still undervalued relative to its potential. As momentum begins to pick up, we could see targets being hit one by one, driven by renewed investor interest and favorable market conditions.
Moreover, the recent surge in COINBASE:ETHUSD ETF inflows adds fundamental weight to the technical setup. This institutional participation could act as a catalyst for a sustained rally, reinforcing the bullish bias.
That said, risk management is key. Always trade with a clear stop loss and position sizing to protect capital. The opportunity is brewing – the question is, are you ready to ride the wave?
BYBIT:ETHUSDT Currently trading at $1790
Buy level : Above $1750
Stop loss : Below $1490
Target : $4000
Max leverage 3x
Always keep stop loss
Follow Our Tradingview Account for More Technical Analysis Updates, | Like, Share and Comment Your thoughts

Ethereum (ETH): Looking For Re-Test Before Next Major MoveSeeing the slight overweight by buyers, we are still looking for our local resistance zone to be retested, considering the current demand for upward movement on the socials. We are waiting for that resistance to be touched, after which we will be monitoring the price development and seeing if we get any proper breakouts with retests from there (PLAN A), or we see a good rejection and MSB to form (PLAN B).
Swallow Academy

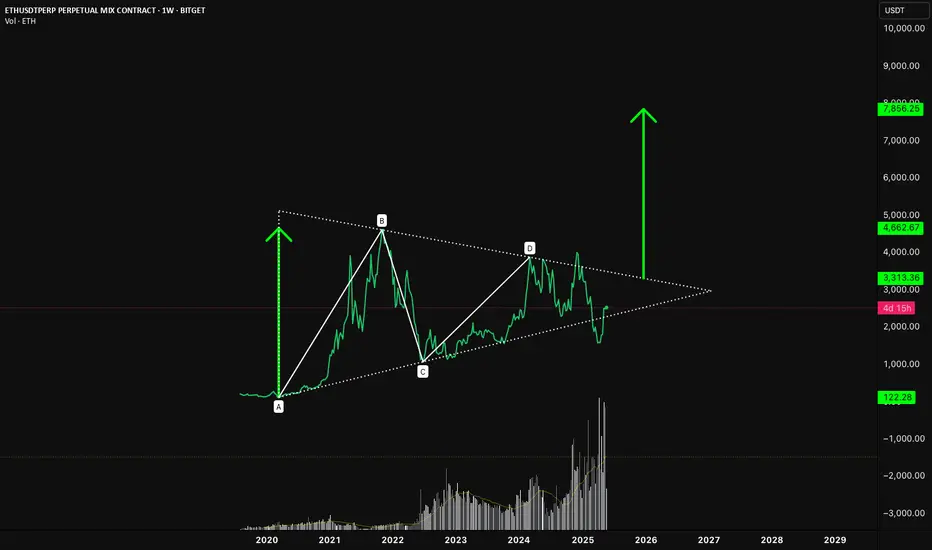
ETH/USDT – The Ethmuda TriangleZoom out.
Since the 2021 highs, Ethereum has spent years grinding sideways, printing what now looks like a textbook symmetrical triangle. Labeled here as an ABCD compression pattern, this structure has been tightening since the macro top (B), slowly building energy within narrowing volatility.
🔺 Structure Breakdown:
• A to B: The explosive bull run from the March 2020 low to the all-time high.
• B to C: A deep correction that shook out weak hands and set the bottom.
• C to D: A multi-year coil of consolidation, forming higher lows and lower highs.
• D to ?: We’re now nearing the apex, where compression typically leads to expansion.
📍 The Trigger Zone
The key level to watch is $4,000–$4,200. A clean breakout above this zone would invalidate the downtrend line and break the triangle to the upside. From a pattern-measured move perspective, the height of the triangle (A to B) projected from the breakout point suggests potential upside into the $7,800–$8,000 region.
🧠 Why This Matters
• Volume has been tapering throughout the structure — classic behaviour in large triangles.
• Market sentiment remains uncertain, making a breakout all the more impactful.
• Ethereum fundamentals are arguably stronger than they were in 2021 — Layer 2s, institutional use cases, and new ETH ETF speculation all add fuel.
📊 Potential Target:
• Immediate resistance: $3,300
• Breakout trigger: $4,000–$4,200
• Projected move: ~$8,000
🕰️ When? Well.. who knows but it does sort of line-up with my previous idea using a SOL/USDT chart that says early next year.. and not this year.
This is the type of setup plays out pretty well on lower timeframes, why not a massive one? The real question is: Are we on the verge of expansion after compression?
Let the chart do the talking.
⚡️ Not Financial Advice

Decoding Momentum with Precision: Absolute Strength HistogramMomentum is more than just a buzzword—it’s the pulse of price action. The Absolute Strength Histogram v2 is a powerful open-source indicator that brings that pulse to life, helping traders visualize the ongoing tug-of-war between bulls and bears with clarity and precision.
In this post, we’ll explore how this tool works, how we use it at Xuantify, and how you can integrate it into your own trading strategy to sharpen your edge.
🔍 What Is the Absolute Strength Histogram ?
Originally developed by jiehonglim , this indicator is a refined version of the classic Absolute Strength Histogram. It measures the relative strength of buyers and sellers and plots it as a color-coded histogram.
Key Features:
Color-coded bars to reflect bullish or bearish dominance
Clear visual cues for trend strength and exhaustion
Helps identify trending vs. ranging market conditions
Open-source and customizable
Unlike traditional oscillators, this histogram doesn’t just show overbought or oversold—it shows who’s in control , and how strongly.
🧠 How We Use It at Xuantify
At Xuantify, we use the Absolute Strength Histogram as a momentum confirmation tool within our multi-layered trading models. Here’s how:
1. Trend Confirmation
We look for alignment between price structure and histogram color. For example, if price breaks structure to the upside and the histogram turns green and rising, that’s a strong confirmation of bullish momentum.
2. Divergence Detection
When price makes a new high but the histogram prints a lower high, it signals momentum divergence —a potential early warning of reversal.
3. Range Filtering
Flat or alternating histogram bars often indicate a ranging market . We avoid trend trades during these periods and instead look for mean-reversion setups.
🧩 New: Pivot High/Low Overlay for Reversal Clarity
To make the Absolute Strength Histogram even more actionable, we’ve added a custom Pivot High/Low indicator that visually marks key swing points on the chart. This addition helps traders clearly see how the histogram behaves before, during, and after reversals .
Below an example of HTF 4H used as stronger trade confirmation:
Why this matters:
It highlights where momentum shifts align with structural turning points
It helps validate divergence signals from the histogram
It makes backtesting and visual analysis much easier
How to use it:
Watch for histogram color or slope changes near pivot highs/lows
Look for divergence between price and histogram at these pivots
Use the pivot zones as potential entry or exit points when confirmed by momentum
🔄 Does It Repaint?
One of the most common concerns with momentum indicators is whether they repaint —meaning they change past values based on future price action. The Absolute Strength Histogram is designed to be non-repainting .
Once a histogram bar is printed, it remains fixed, making it suitable for real-time decision-making and reliable backtesting . This gives traders confidence that what they see on the chart is what actually happened in the moment—not a hindsight illusion.
⚙️ Settings That Matter
The indicator comes with several adjustable parameters, but one of the most impactful is the “Indicator Method” setting.
Our recommendation:
Set Indicator Method = STOCHASTIC for smoother, more responsive signals
This setting tends to reduce noise and better capture momentum shifts
It works especially well in combination with structure-based entries
Other useful settings include:
Length – Controls the sensitivity of the histogram
Smoothing – Helps reduce choppiness in volatile markets
Color thresholds – Customize visual cues for easier interpretation
⚙️ Best Combinations with This Indicator
To maximize its effectiveness, we combine the Absolute Strength Histogram v2 with:
Market Structure Tools – Like BOS/CHOCH from LuxAlgo Smart Money Concepts
Volume Profile – To confirm strength around key volume nodes
Fair Value Gaps (FVGs) – For precision entries when histogram confirms direction
RSI or Stochastic – For additional momentum or exhaustion confirmation
This layered approach helps us filter out noise and focus only on high-conviction trades .
⚠️ What to Watch Out For
No indicator is perfect. The Absolute Strength Histogram can sometimes lag slightly in fast-moving markets. It’s best used as a confirmation tool , not a standalone signal generator.
Also, in low-volume or choppy conditions, the histogram may give mixed signals. Always combine it with structure and context.
🚀 Final Thoughts
The Absolute Strength Histogram is a clean, intuitive, and powerful tool for traders who want to see momentum clearly . Whether you’re a trend trader, scalper, or swing strategist, this indicator can help you stay on the right side of the market.
At Xuantify, we’re all about combining simplicity with precision. This tool fits that philosophy perfectly.
Add it to your chart, test it, and see how it sharpens your edge.

ETHEREUM Long Outlook – Grand Supercycle Perspective(2025.05.21)Hello everyone,
This is SeoVereign, operator of the SeoVereign Team.
Today, I would like to share an Ethereum analysis based on the daily (1D) chart for the first time in a while.
Before reading this post, please refer to the idea I uploaded on April 18, 2025, through the link below. It will help you better understand the context:
🔗
(Clicking the image will take you to the corresponding link.)
If you look at the April 18 idea, you’ll see that I presented a bullish outlook based on the Deep Crab pattern.
This analysis is a continuation of that idea.
Through years of research, I’ve observed that when a Deep Crab pattern sees a rebound from the PRZ (Potential Reversal Zone), the trend that begins from that point tends to extend for a long time.
If you look closely at the chart, you’ll also see the 2.24 Fibonacci extension level.
Some people messaged me saying, “Since it went above 1.902 and even exceeded the 2.0 Fibonacci line, isn’t this Deep Crab invalid?”
However, I’ve studied harmonic patterns in depth for a long time and have set my own Fibonacci criteria based on that research.
In this particular Deep Crab case, I define the invalidation level as 2.24.
Therefore, I judged that the pattern is still valid, and this allowed me to forecast a long-term bullish trend.
Back to the main point,
Based on this Deep Crab pattern, I’ve consistently maintained a bullish outlook on the daily chart,
and so far, there have been no clear signals indicating a reversal into a bearish trend.
Thus, I would like to post a continuation of the bullish outlook on the daily chart.
On May 19, 2025, there was a sharp drop around the 2,587 USDT level.
At that time, our team expected the bullish trend that started from around 2,447 USDT to hold its low and continue.
However, the price broke below 2,447 USDT and made a new low.
We then closely monitored Bitcoin’s movement in response.
Typically, strong volatility occurs before a major trend begins.
Bitcoin was also showing significant volatility at the time.
So we concluded: “Let’s maintain a bullish stance, but do not be fully convinced until the previous high of 2,587 USDT is clearly broken upward.”
And by the time this post is published, we’ve confirmed that the price has indeed broken above 2,587 USDT.
Therefore, I have come to the conclusion that the bullish trend is still valid.
Based on this, I present the following three target levels.
🎯 SeoVereign’s Ethereum Bullish Targets
1st Target: 3,000 USDT
2nd Target: 3,400 USDT
3rd Target: 3,700 USDT
The market still shows strong volatility.
I sincerely hope you all trade wisely and calmly, achieving great returns,
and may great fortune be with you both in trading and in life.
I’ll see you again in the next daily analysis.
Thank you.
- SeoVereign

ETH 4H LONG SETUPCRYPTOCAP:ETH has bounced off 4H trend support and is coiling into a falling wedge—volatility is low, so a sharp move is likely.
1. Context & Structure
• Rejection off trendline at ~$2,516.50 (diagonal resistance)
• Price contained in a tightening wedge after correction
• Holding above wedge support since the last low
2. Key Levels
• Resistance break: $2,520
• Lower wedge base/buy zone: $2,289.27–$2,270
• Stop-loss: Weekly/4H close below $2,270
• Primary take-profit: $3,050.50
3. Trading Plan
– Primary: Go long on a 4H close > $2,520; target $3,050.50; SL < $2,270
– Alternate: If rejected at resistance, wait for a pullback into $2,289–$2,270; look for a bullish MSB or reversal candle to enter the long with the same TP/SL
Trade confirmed breakouts or clean reversal signals—avoid FOMO and overleveraging. 🚀

ETH 12H LONGCRYPTOCAP:ETH is trapped in a 12H “pain corridor” after false breakouts above $2,608.13 and below $2,406.63 wiped out late buyers & shorts. Here’s the refined playbook:
Context & Observations
• 12H range: $2,406.63–$2,608.13
• Liquidity grabs above & below, now coiling mid-range
• Volume cluster around $2,506 hints at pent-up energy
• Market structure leans bullish for a breakout
Plan & Levels
• Primary: Hold longs through the range, target $3,164.51 (0.618 Fibo) on a clean 12H close > $2,608.13
• Alternative: On a retest of $2,406.63–$2,500, add or reinforce longs if support holds
• Stop-loss: 12H close < $2,406.63
Triggers
– 12H close > $2,608.13 → priority long entry
– Fake downside breakout & swift reclaim of $2,406.63 → buy signal
– Volume surge on breakout for confirmation
Conclusion
Both longs & shorts have been flushed. Now wait for a decisive exit above $2,608.13 before chasing the move up to $3,164.51. Patience is your edge. 🚀

Short-term next target for ETH - 2808$; 80% for ETHFinally main goal for correction since december has been reached!
ETH hit 1550$.
For more detailed idea check this one
On 3D timeframe you can see that StochRSI is trending UP, means momentum is building for next move UP.
RSI may finish to form a bullish divergence in coming days.
Also price hit liquidity zone since oct. 2023. This level has to show us some buy pressure.
Next short term target could be 2808$ which is 80% above from current level.
2 reasons for this price:
200MA
Liquidity and resistance zone since february

Check if the price can hold above 2627.18
Hello, traders.
If you "Follow", you can always get the latest information quickly.
Have a nice day today.
-------------------------------------
(ETHUSDT 1D chart)
The M-Signal indicator on the 1M chart has risen above.
Accordingly, the key is whether it can find support near 2677.18 and rise.
If OBV rises above the A line, the price is expected to rise significantly once more.
Then, it is expected to rise to around 3265.0-3321.30.
-
If it falls without being supported near 2627.18, it is necessary to check whether it is supported near the right Fibonacci ratio 0.5 (2295.84).
Since the M-Signal indicator on the 1W and 1D charts is passing near that point, it is expected to play an important role.
-
Since the StochRSI indicator is in the overbought zone, it will eventually show a downward trend.
It is not known how much this decline will occur, but since the StochRSI 50 indicator is currently formed near 2359.35, it is important to check whether there is support near that area.
Therefore, in order to proceed with a new transaction, I think it is better to check the support point when the StochRSI indicator shows a downward and then upward trend in the overbought zone.
-
Thank you for reading to the end.
I hope you have a successful transaction.
--------------------------------------------------
- Here is an explanation of the big picture.
I used TradingView's INDEX chart to check the entire range of BTC.
I rewrote the previous chart to update it while touching the Fibonacci ratio range of 1.902 (101875.70) ~ 2 (106275.10).
(Previous BTCUSD 12M chart)
Looking at the big picture, it seems to have been maintaining an upward trend following a pattern since 2015.
In other words, it is a pattern that maintains a 3-year bull market and faces a 1-year bear market.
Accordingly, the upward trend is expected to continue until 2025.
-
(Current BTCUSD 12M chart)
Based on the currently written Fibonacci ratio, it is displayed up to 3.618 (178910.15).
It is expected that it will not fall again below the Fibonacci ratio of 0.618 (44234.54).
(BTCUSDT 12M chart)
Based on the BTCUSDT chart, I think it is around 42283.58.
-
I will explain it again with the BTCUSD chart.
The Fibonacci ratio ranges marked in the green boxes, 1.902 (101875.70) ~ 2 (106275.10) and 3 (151166.97) ~ 3.14 (157451.83), are expected to be important support and resistance ranges.
In other words, it seems likely that they will act as volume profile ranges.
Therefore, in order to break through these ranges upward, I think the point to watch is whether they can receive support and rise near the Fibonacci ratios of 1.618 (89126.41) and 2.618 (134018.28).
Therefore, the maximum rising range in 2025 is expected to be the 3 (151166.97) ~ 3.14 (157451.83) range.
In order to do that, we need to see if it is supported and rises near 2.618 (134018.28).
If it falls after the bull market in 2025, we don't know how far it will fall, but based on the previous decline, we expect it to fall by about -60% to -70%.
Therefore, if it starts to fall near the Fibonacci ratio 3.14 (157451.83), it seems likely that it will fall to around Fibonacci 0.618 (44234.54).
I will explain more details when the bear market starts.
------------------------------------------------------

$Eth Direction I think Eth will be waving some sort of correction t0 2240 - 2180 area then we should run while btc in this time is doing very good and expecting 125 k soon


Golden Cross Brewing on Ethereum — Eyes on $4,000 BreakoutEthereum (ETH) is on the verge of printing a golden cross on the daily chart — a bullish signal where the 21-day moving average crosses above the 200-day moving average. Historically, this formation has triggered strong upward moves, and current price structure supports the possibility of a similar rally if key resistance is broken.
ETH has already bounced from the Point of Control (POC) and is currently consolidating just under $2,800, a major resistance level that also aligns with the Value Area High (VAH). This confluence makes it a critical breakout zone.
Key Highlights:
Golden Cross Setup: 21MA approaching a bullish crossover of 200MA
Major Resistance: $2,800 (confluence with VAH)
Support Structure: 21MA and 200MA providing bullish structure
Next Target: $4,000 if breakout is confirmed with volume
Volume remains the key missing piece — a breakout above $2,800 without volume may lead to a fakeout, but strong participation could validate the breakout and accelerate a rally toward $4,000.
Watch for price to either consolidate under $2,800 (bullish compression) or break with a volume spike. A confirmed golden cross and breakout could be the trigger for a multi-week bullish expansion, similar to previous patterns in ETH’s history.

Ethereum (ETH): Filled Bearish CME, Buyers Dominating For Now...Ethereum started with decent upward movement after we recently filled the bearish CME gap near $2346, which also marked the successful retest of the broken area (on bigger timeframes).
We are monitoring that area still but seeing the dominance from buyers, we might be seeing a good upwards movement and breakout happening very soon so eyes on resistance!!
Swallow Academy
